UNITED STATES
SECURITIES AND EXCHANGE COMMISSION
Washington, D.C. 20549
Form 6-K
REPORT OF FOREIGN PRIVATE ISSUER
PURSUANT TO RULE 13a-16 OR 15d-16
UNDER THE SECURITIES EXCHANGE ACT OF 1934
20 October 2026
BHP GROUP LIMITED
(ABN 49 004 028 077)
(Exact name of Registrant as specified in its charter)
VICTORIA, AUSTRALIA
(Jurisdiction of incorporation or organisation)
171 COLLINS STREET, MELBOURNE,
VICTORIA 3000 AUSTRALIA
(Address of principal executive offices)
Indicate by check mark whether the registrant files or will file annual reports under cover of Form 20-F or Form 40-F: ☐ Form 20-F ☐ Form 40-F
Indicate by check mark if the registrant is submitting the Form 6-K in paper as permitted by Regulation S-T Rule 101(b)(1): ☐
Indicate by check mark if the registrant is submitting the Form 6-K in paper as permitted by Regulation S-T Rule 101(b)(7): ☐
Indicate by check mark whether the registrant by furnishing the information contained in this Form is also thereby furnishing the information to the Commission pursuant to Rule 12g3-2(b) under the Securities Exchange Act of 1934: ☐ Yes ☒ No
If “Yes” is marked, indicate below the file number assigned to the registrant in connection with Rule 12g3-2(b): n/a

|
20 October 2026 |
Operational review for the quarter ended 30 September 2026
Safety a key focus; strong price realisation with no change to production guidance.
“The deaths of two colleagues at Escondida and Peak Downs are a profound loss. Our thoughts remain with their families and friends. No loss of life is acceptable. Investigations are underway and we will keep strengthening the controls that keep people safe in our pursuit of being a fatality free business.
Copper production was lower in the first quarter, reflecting planned grade declines and scheduled maintenance, alongside temporary disruptions from severe weather in Chile, stops for safety and the conveyor failure at Carrapateena. Our bulk commodities delivered a strong start to FY27 through a maintenance-intensive quarter. WAIO set records at both the mine and port, while BMA and NSW Energy Coal both delivered higher production than the same period last year. Stronger commodity prices provided a tailwind for earnings, particularly in copper where prices were around 50 per cent higher than a year ago.
We are building the next phase of growth in copper and potash. We continued to strengthen one of the world’s largest copper portfolios, from funding the Escondida New Concentrator in Chile to growing our resource base and long-term production potential at Copper South Australia, while also expanding our copper growth pipeline across the Americas. Jansen is rapidly taking shape, with Stage 1 now 87 per cent complete and on track for first production in mid-2027, adding a new and important commodity to our portfolio.
Global markets remain volatile, with geopolitical tensions, trade uncertainty and elevated energy and freight costs continuing to create headwinds across the industry. At the same time, demand for commodities remains resilient, supported by continued industrialisation and urbanisation in China and India, alongside unprecedented investment in data centres and enabling infrastructure globally, which is reinforcing the long-term outlook for copper. That demand plays to the strength of our portfolio, which touches almost every part of how the world builds, powers and feeds itself.”
| Brandon Craig, | ||
| BHP Chief Executive Officer | ||
| Summary |
||
| Operational excellence |
Copper growth | |
| Full year guidance remains unchanged |
Progressing our organic growth options | |
| Copper production decreased due to lower planned concentrator feed grades and operational disruptions across our assets including planned maintenance and severe weather in Chile. Our bulk commodities delivered a strong start to the year. WAIO increased production 4% during a period of significant planned maintenance, demonstrating the strength and resilience of our integrated supply chain. Production at BMA was also strong reflecting improved operating performance, while NSWEC’s production increased due to higher bypass coal. |
We are advancing our strategy to grow Copper SA’s copper production to ~500ktpa by 2035 and up to 650ktpa by 2040 and today we announced an increase to Olympic Dam’s mineral resource base. At our November site visit, we will provide further detail regarding our strategy. We also renamed the Oak Dam exploration project ‘Ankata’ in recognition of the cultural significance of the area to the Kokatha people. At Escondida, US$0.8 bn (100% basis) of pre-commitment funding was approved to enable execution readiness for the Escondida New Concentrator and we remain on track to deliver first potash production at our Jansen project in mid-CY27. | |
| Strategic partnerships |
Social value | |
| Supporting growth |
Building long-term, sustainable value | |
| In September, BHP signed an MOU with KGHM Polska Miedź S.A. (55% owner of Sierra Gorda) to explore opportunities for both parties to collaborate and unlock synergy value at Spence and Sierra Gorda. The focus areas of collaboration include technical expertise, exploration and future development projects. We also completed a transaction with Faraday to divest BHP’s San Manuel legacy asset and increase BHP’s interest in the emerging US copper developer to 32% (non-diluted basis). |
In July 2026, BMA became BHP’s first operated Australian asset to reach 100% renewable electricity, based on current forecast demand. We also partnered with Amazon Web Services (AWS) on an industry-first pilot to sell credits to AWS for lower greenhouse gas-emissions associated with copper from Escondida, helping to develop a market-based mechanism that connects lower-emissions copper production with customer demand. In September, we held our ESG Roundtable covering safety, operational decarbonisation, climate and social value. | |
| Production | Quarter performance | Production guidance | ||||||||||||||||||
| Q1 FY27 | v Q4 FY26 | v Q1 FY26 | FY27 guidance |
|||||||||||||||||
| Copper (kt) |
400.7 | (19 | %) | (19 | %) | 1,650 – 1,800 | ||||||||||||||
| Escondida (kt) |
252.6 | (19 | %) | (23 | %) | 1,000 – 1,100 | Unchanged | |||||||||||||
| Pampa Norte (Spence) (kt) |
47.4 | (13 | %) | (15 | %) | 210 – 230 | Unchanged | |||||||||||||
| Copper South Australia (kt) |
60.7 | (33 | %) | (16 | %) | 290 – 320 | Unchanged | |||||||||||||
| Antamina (kt) |
40.0 | 13 | % | 18 | % | 120 – 140 | Unchanged | |||||||||||||
| Iron ore (Mt) |
66.5 | (2 | %) | 4 | % | 260 – 272 | ||||||||||||||
| WAIO (Mt) |
64.3 | (3 | %) | 4 | % | 253 – 264 | Unchanged | |||||||||||||
| WAIO (100% basis) (Mt) |
71.9 | (4 | %) | 2 | % | 286 – 298 | Unchanged | |||||||||||||
| Samarco (Mt) |
2.2 | 10 | % | 4 | % | 7.5 – 8.0 | Unchanged | |||||||||||||
| Steelmaking coal – BMA (Mt) |
4.9 | (13 | %) | 1 | % | 18.5 – 20.5 | ||||||||||||||
| BMA (100% basis) (Mt) |
9.8 | (13 | %) | 1 | % | 37 – 41 | Unchanged | |||||||||||||
| Energy coal – NSWEC (Mt) |
4.4 | 6 | % | 26 | % | 14 – 16 | Unchanged | |||||||||||||
BHP | Operational review for the quarter ended 30 September 2026
Segment and asset performance | FY27 YTD v FY26 YTD

|
Further information in Appendix 1 Detailed production and sales information for all operations in Appendix 2 |
| Copper |
||
| Production 401 kt ê19% Q1 FY26 494 kt FY27e 1,650 – 1,800 kt Average realised price US$7.01/lb é53% Q1 FY26 US$4.59/lb |
Total copper production decreased 19% to 401 kt. Copper production guidance for FY27 remains unchanged at between 1,650 and 1,800 kt. Escondida 252.6 kt ê23% (100% basis) A fatal incident involving one of our employees occurred at Escondida on 23 September. An investigation is underway and we are working closely with local authorities. Production decreased due to lower concentrate production, reflecting planned lower feed grade of 0.81% (Q1 FY26: 0.94%) and scheduled maintenance in the quarter. The fatal incident also led to a temporary suspension of all mining activities, and severe weather in July and August constrained operational logistics and truck fleet utilisation. Cathode production increased, supported by higher Full SaL recoveries and improved sulphide leaching performance. A new collective agreement with Union N°2 of Supervisors was signed and became effective for 36 months from 14 October 2026. Production guidance for FY27 remains unchanged at between 1,000 and 1,100 kt. Concentrator feed grade guidance of ~0.70% for the full year also remains unchanged. | |
| We continue to make progress on the Escondida Growth Program, with US$0.8 bn (100% basis) of pre-commitment funding approved to enable further engineering, permitting and execution readiness for the Escondida New Concentrator. Pampa Norte (Spence) 47.4 kt ê15% | ||
| Production decreased due to lower concentrate production, reflecting planned lower feed grade of 0.53% (Q1 FY26: 0.65%) and ongoing challenges in managing ore variability. | ||
| Progress continues towards first production from the Concentrator Upgrade Recovery project in FY28 and the Spence Chalcopyrite Leaching project in CY28. | ||
| Production guidance for FY27 remains unchanged at between 210 and 230 kt, with volumes weighted to the second half. | ||
| Copper South Australia 60.7 kt ê16% | ||
| Production decreased primarily due to the underground conveyor belt failure at Carrapateena, disclosed with the FY26 results. A replacement belt was installed and was operational within seven weeks, followed by a progressive ramp-up through September. The conveyor is now operating at full capacity. Olympic Dam started to build anode inventory as planned ahead of the Smelter Campaign Maintenance 27 program (scheduled for H1 FY28). | ||
| At Prominent Hill, concentrate sales were higher than production during the quarter, reflecting the drawdown of inventory built up in H2 FY26. | ||
| Production guidance for FY27 remains unchanged at between 290 and 320 kt. | ||
| Other copper | ||
| At Antamina, copper production increased 18% to 40 kt as a result of planned higher feed grades and strong operational performance. Zinc production decreased 70% to 11 kt as a result of planned lower feed grades. | ||
| FY27 copper production guidance of between 120 and 140 kt and zinc production guidance of between 35 and 55 kt remain unchanged. | ||
2
BHP | Operational review for the quarter ended 30 September 2026
| Iron ore |
||
| Production 66 Mt é4% Q1 FY26 64 Mt FY27e 260 – 272 Mt Average realised price US$76.27/wmt ê9% Q1 FY26 US$84.04/wmt |
Iron ore production increased 4% to 66.5 Mt. Production guidance for FY27 remains unchanged at between 260 and 272 Mt. WAIO 64.3 Mt é4% | 71.9 Mt (100% basis) Production increased as a result of strong operational performance across our mine, rail and port operations, in a quarter of significant planned maintenance, with Q1 records achieved at both the mine and port. We are currently undertaking a major rebuild of Car Dumper 4 at Port Hedland, which had a 1.4 Mt (100% basis) volume impact in Q1. The project is progressing well at ~40% complete and remains on track for completion in H1 FY27. We are also making strong progress on our investments to deliver production of >305 Mt by the end of FY28. The sixth car dumper (CD6) is on track for completion in Q4 FY28. Once operational we expect CD6 will assist in offsetting the production impact from major car dumper renewals beginning in FY29, while also enhancing ore blending and screening capability at the port. The Western Ridge Crusher project remains on track with first ore scheduled for H1 FY27. Production guidance for FY27 remains unchanged at between 253 and 264 Mt (286 and 298 Mt on a 100% basis). | |
| Samarco 2.2 Mt é4% | 4.3 Mt (100% basis) | ||
| Production increased due to strong concentrator performance. Production guidance for FY27 remains unchanged at between 7.5 and 8 Mt. | ||
| Coal Steelmaking coal |
||
| Production 4.9 Mt é1% Q1 FY26 4.9 Mt FY27e 18.5 – 20.5 Mt Average realised price US$242.82/t é34% Q1 FY26 US$180.67/t |
BMA 4.9 Mt é1% | 9.8 Mt (100% basis) Production increased reflecting strong operational performance and mine sequencing. BMA’s focus remains on stabilising raw coal inventory levels and normalising strip ratio over the medium term. Operations at all mines were suspended following the fatality of a team member, with mining suspended for one week at Peak Downs and 24 hours across other operations. Investigations are ongoing. A longwall move at Broadmeadow is scheduled to commence late in Q2 FY27. Production guidance for FY27 remains unchanged at between 18.5 and 20.5 Mt (37 and 41 Mt on a 100% basis), with volumes weighted to the second half. | |
| Energy coal |
||
| Production 4.4 Mt é26% Q1 FY26 3.5 Mt FY27e 14 – 16 Mt Average realised price US$116.60/t é23% Q1 FY26 US$95.18/t |
NSWEC 4.4 Mt é26% Production increased driven by higher bypass coal as mining progressed into lower strip ratio areas and improved wash plant throughput. Production guidance for FY27 remains unchanged at between 14 and 16 Mt, with volumes weighted to the first half. | |
3
BHP | Operational review for the quarter ended 30 September 2026
Quarterly performance | Q1 FY27 v Q4 FY26
|
Copper |
Iron ore |
|||||
| 401 kt ê19% Q4 FY26 492 kt |
Lower production at Escondida and Spence due to planned lower grades, scheduled maintenance, the safety incident at Escondida and severe weather impacts. Production was also lower at Copper SA due to planned maintenance and the Carrapateena belt rip. This was partially offset by higher production at Antamina due to higher concentrator throughput. |
66 Mt ê2% Q4 FY26 68 Mt |
Lower production at WAIO as a result of planned maintenance including the rebuild of Car Dumper 4. | |||
|
Steelmaking coal |
Energy coal | |||||
| 4.9 Mt ê13% Q4 FY26 5.7 Mt |
Production decreased due to planned higher strip ratio and scheduled maintenance. Operations were also impacted following the safety incident at Peak Downs. |
4.4 Mt é6% Q4 FY26 4.2 Mt |
Higher production due to increased bypass coal. This was supported by the completion ahead of schedule of the annual wash plant maintenance. | |||
4
BHP | Operational review for the quarter ended 30 September 2026
Average realised pricesi
| Quarter | ||||||||||||
| Q1 FY27 | v Q4 FY26 | v Q1 FY26 | ||||||||||
| Copper (US$/lb) |
7.01 | 7% | 53% | |||||||||
| Iron ore (US$/wmt, FOB) |
76.27 | (9% | ) | (9% | ) | |||||||
| Steelmaking coal (US$/t) |
242.82 | 4% | 34% | |||||||||
| Energy coal (US$/t)ii |
116.60 | (1% | ) | 23% | ||||||||
| i | Based on provisional, unaudited estimates. Prices exclude sales from equity accounted investments, third party product and internal sales, and represent the weighted average of various sales terms (for example: FOB, CIF and CFR), unless otherwise noted. Includes the impact of provisional pricing and finalisation adjustments. |
| ii | Export sales only. Includes thermal coal sales from steelmaking coal mines. |
Current year unit cost guidance
| Unit cost |
FY27 guidance | i | ||||||
| Escondida (US$/lb) |
1.20 – 1.50 | Unchanged | ||||||
| Spence (US$/lb) |
2.40 – 2.70 | Unchanged | ||||||
| Copper South Australia (US$/lb)ii |
0.30 – 0.80 | Unchanged | ||||||
| WAIO (US$/t) |
20.25 – 21.75 | Unchanged | ||||||
| BMA (US$/t) |
126 –137 | Unchanged | ||||||
| i | FY27 unit cost guidance ranges are based on exchange rates of AUD/USD 0.70 and USD/CLP 890. WAIO and BMA’s FY27 unit cost guidance ranges are subject to movements in the diesel benchmark. |
| ii | Copper SA unit cost guidance is calculated using the following assumptions for by-products: gold US$4,300/oz and uranium US$80/lb. |
Medium term guidancei
| Production guidance |
Unit cost guidance |
|||||||
| Escondida |
900 –1,000 ktpa | US$1.30 – 1.60/lb | ||||||
| Spence |
~235 ktpa | US$2.10 – 2.40/lb | ||||||
| WAIO (100% basis) |
>305 Mtpa | <US$19.00/t | ||||||
| BMA (100% basis) |
43 – 45 Mtpa | <US$120/t | ||||||
| i | Medium-term unit cost guidance ranges are based on exchange rates of AUD/USD 0.70 and USD/CLP 890. Medium-term guidance target refers to an average between FY28 and FY31 for Escondida and Spence. At WAIO this is expected to be achieved in FY29 and at BMA by the end of the five-year medium-term horizon. |
Major projects
|
Commodity |
Project and ownership | Capacity | Estimated project expenditurei US$M |
First production target date |
Progress | |||||
| Potash |
Jansen Stage 1 (Canada) 100% |
Design, engineering and construction of an underground potash mine and surface infrastructure, with capacity to produce 4.15 Mtpa | 8,400 | Mid-CY27 | Project is 87% complete | |||||
| Potash |
Jansen Stage 2 (Canada) 100% |
Development of additional mining districts, completion of the second shaft hoist infrastructure, expansion of processing facilities and addition of rail cars to facilitate production of an incremental 4.36 Mtpa | 6,900 | Late-FY31 | Project is 18% complete | |||||
| i | Includes project capital expenditure, project operating expenditure, cost to construct right-of-use assets (i.e. Westshore port terminal and third-party rail line) and related contingencies. |
Exploration
Minerals exploration and evaluation expenditure was US$87 m for Q1 FY27 (Q1 FY26: US$90 m), of which US$67 m was expensed (Q1 FY26: US$76 m).
5
BHP | Operational review for the quarter ended 30 September 2026
Appendix 2
| Production | Sales | |||||||||||||||||||||||||||||||||||||||||||||||||||||||||||||||||||||||||||||||||||
| Quarter ended | Year to date | Quarter ended | Year to date | |||||||||||||||||||||||||||||||||||||||||||||||||||||||||||||||||||||||||||||||||
| Sep | Dec | Mar | Jun | Sep | Sep | Sep | Var | Sep | Dec | Mar | Jun | Sep | Sep | Sep | Var | |||||||||||||||||||||||||||||||||||||||||||||||||||||||||||||||||||||
| 2025 | 2025 | 2026 | 2026 | 2026 | 2026 | 2025 | % | 2025 | 2025 | 2026 | 2026 | 2026 | 2026 | 2025 | % | |||||||||||||||||||||||||||||||||||||||||||||||||||||||||||||||||||||
| Group production and sales summary |
||||||||||||||||||||||||||||||||||||||||||||||||||||||||||||||||||||||||||||||||||||
| By commodity |
||||||||||||||||||||||||||||||||||||||||||||||||||||||||||||||||||||||||||||||||||||
| Metals production is payable metal unless otherwise noted. |
||||||||||||||||||||||||||||||||||||||||||||||||||||||||||||||||||||||||||||||||||||
| Throughout this report figures in italics indicate that this figure has been adjusted since it was previously reported. |
||||||||||||||||||||||||||||||||||||||||||||||||||||||||||||||||||||||||||||||||||||
| Copper |
Payable metal in concentrate | kt | 374.0 | 366.5 | 347.7 | 337.6 | 277.0 | 277.0 | 374.0 | (26 | %) | 343.0 | 373.8 | 350.0 | 321.2 | 302.2 | 302.2 | 343.0 | (12 | %) | ||||||||||||||||||||||||||||||||||||||||||||||||||||||||||||||||
| Escondida | kt | 282.4 | 270.5 | 248.3 | 245.6 | 197.9 | 197.9 | 282.4 | (30 | %) | 258.3 | 277.7 | 252.1 | 233.6 | 210.7 | 210.7 | 258.3 | (18 | %) | |||||||||||||||||||||||||||||||||||||||||||||||||||||||||||||||||
| Pampa Norte (Spence) | kt | 35.4 | 33.3 | 25.7 | 26.9 | 27.2 | 27.2 | 35.4 | (23 | %) | 33.2 | 27.9 | 34.9 | 24.4 | 32.2 | 32.2 | 33.2 | (3 | %) | |||||||||||||||||||||||||||||||||||||||||||||||||||||||||||||||||
| Copper South Australia | kt | 19.9 | 22.2 | 27.5 | 29.8 | 11.9 | 11.9 | 19.9 | (40 | %) | 15.9 | 24.8 | 18.0 | 27.3 | 22.9 | 22.9 | 15.9 | 44 | % | |||||||||||||||||||||||||||||||||||||||||||||||||||||||||||||||||
| Antamina | kt | 33.9 | 38.2 | 44.1 | 35.3 | 40.0 | 40.0 | 33.9 | 18 | % | 33.1 | 40.4 | 43.3 | 35.9 | 36.4 | 36.4 | 33.1 | 10 | % | |||||||||||||||||||||||||||||||||||||||||||||||||||||||||||||||||
| Carajás1 | kt | 2.4 | 2.3 | 2.1 | - | - | - | 2.4 | - | 2.5 | 3.0 | 1.7 | - | - | - | 2.5 | - | |||||||||||||||||||||||||||||||||||||||||||||||||||||||||||||||||||
| Cathode | kt | 119.6 | 124.0 | 129.1 | 154.3 | 123.7 | 123.7 | 119.6 | 3 | % | 105.9 | 130.7 | 118.7 | 162.1 | 115.1 | 115.1 | 105.9 | 9 | % | |||||||||||||||||||||||||||||||||||||||||||||||||||||||||||||||||
| Escondida | kt | 46.5 | 46.7 | 54.9 | 66.3 | 54.7 | 54.7 | 46.5 | 18 | % | 38.1 | 50.0 | 50.1 | 71.8 | 48.4 | 48.4 | 38.1 | 27 | % | |||||||||||||||||||||||||||||||||||||||||||||||||||||||||||||||||
| Pampa Norte (Spence) | kt | 20.4 | 24.4 | 18.9 | 27.6 | 20.2 | 20.2 | 20.4 | (1 | %) | 17.9 | 25.4 | 17.4 | 29.3 | 20.0 | 20.0 | 17.9 | 12 | % | |||||||||||||||||||||||||||||||||||||||||||||||||||||||||||||||||
| Copper South Australia | kt | 52.7 | 52.9 | 55.3 | 60.4 | 48.8 | 48.8 | 52.7 | (7 | %) | 49.9 | 55.3 | 51.2 | 61.0 | 46.7 | 46.7 | 49.9 | (6 | %) | |||||||||||||||||||||||||||||||||||||||||||||||||||||||||||||||||
| Total | kt | 493.6 | 490.5 | 476.8 | 491.9 | 400.7 | 400.7 | 493.6 | (19 | %) | 448.9 | 504.5 | 468.7 | 483.3 | 417.3 | 417.3 | 448.9 | (7 | %) | |||||||||||||||||||||||||||||||||||||||||||||||||||||||||||||||||
| Lead |
Payable metal in concentrate | t | 754 | 91 | 209 | 225 | 73 | 73 | 754 | (90 | %) | 1,469 | 551 | 14 | 207 | 236 | 236 | 1,469 | (84 | %) | ||||||||||||||||||||||||||||||||||||||||||||||||||||||||||||||||
| Antamina | t | 754 | 91 | 209 | 225 | 73 | 73 | 754 | (90 | %) | 1,469 | 551 | 14 | 207 | 236 | 236 | 1,469 | (84 | %) | |||||||||||||||||||||||||||||||||||||||||||||||||||||||||||||||||
| Zinc |
Payable metal in concentrate | t | 35,991 | 27,003 | 17,723 | 15,410 | 10,952 | 10,952 | 35,991 | (70 | %) | 41,499 | 26,046 | 18,573 | 14,703 | 11,413 | 11,413 | 41,499 | (72 | %) | ||||||||||||||||||||||||||||||||||||||||||||||||||||||||||||||||
| Antamina | t | 35,991 | 27,003 | 17,723 | 15,410 | 10,952 | 10,952 | 35,991 | (70 | %) | 41,499 | 26,046 | 18,573 | 14,703 | 11,413 | 11,413 | 41,499 | (72 | %) | |||||||||||||||||||||||||||||||||||||||||||||||||||||||||||||||||
| Gold |
Payable metal in concentrate | troy oz | 76,242 | 73,585 | 105,321 | 84,889 | 70,710 | 70,710 | 76,242 | (7 | %) | 66,377 | 82,099 | 87,012 | 87,621 | 81,378 | 81,378 | 66,377 | 23 | % | ||||||||||||||||||||||||||||||||||||||||||||||||||||||||||||||||
| Escondida | troy oz | 35,348 | 31,927 | 52,473 | 39,706 | 40,946 | 40,946 | 35,348 | 16 | % | 35,348 | 31,927 | 52,473 | 39,706 | 40,946 | 40,946 | 35,348 | 16 | % | |||||||||||||||||||||||||||||||||||||||||||||||||||||||||||||||||
| Pampa Norte (Spence) | troy oz | 2,589 | 2,724 | 3,800 | 3,595 | 5,379 | 5,379 | 2,589 | 108 | % | 2,589 | 2,724 | 3,800 | 3,595 | 5,379 | 5,379 | 2,589 | 108 | % | |||||||||||||||||||||||||||||||||||||||||||||||||||||||||||||||||
| Copper South Australia | troy oz | 36,489 | 36,993 | 47,264 | 41,588 | 24,385 | 24,385 | 36,489 | (33 | %) | 26,476 | 45,024 | 29,234 | 44,320 | 35,053 | 35,053 | 26,476 | 32 | % | |||||||||||||||||||||||||||||||||||||||||||||||||||||||||||||||||
| Carajás1 | troy oz | 1,816 | 1,941 | 1,784 | - | - | - | 1,816 | - | 1,964 | 2,424 | 1,505 | - | - | - | 1,964 | - | |||||||||||||||||||||||||||||||||||||||||||||||||||||||||||||||||||
| Refined gold | troy oz | 50,716 | 61,910 | 54,511 | 63,888 | 49,656 | 49,656 | 50,716 | (2 | %) | 51,147 | 59,054 | 57,336 | 55,962 | 48,038 | 48,038 | 51,147 | (6 | %) | |||||||||||||||||||||||||||||||||||||||||||||||||||||||||||||||||
| Copper South Australia | troy oz | 50,716 | 61,910 | 54,511 | 63,888 | 49,656 | 49,656 | 50,716 | (2 | %) | 51,147 | 59,054 | 57,336 | 55,962 | 48,038 | 48,038 | 51,147 | (6 | %) | |||||||||||||||||||||||||||||||||||||||||||||||||||||||||||||||||
| Total | troy oz | 126,958 | 135,495 | 159,832 | 148,777 | 120,366 | 120,366 | 126,958 | (5 | %) | 117,524 | 141,153 | 144,348 | 143,583 | 129,416 | 129,416 | 117,524 | 10 | % | |||||||||||||||||||||||||||||||||||||||||||||||||||||||||||||||||
| Silver |
Payable metal in concentrate | troy koz | 4,114 | 4,109 | 4,839 | 3,709 | 3,493 | 3,493 | 4,114 | (15 | %) | 4,136 | 4,252 | 4,518 | 3,573 | 3,319 | 3,319 | 4,136 | (20 | %) | ||||||||||||||||||||||||||||||||||||||||||||||||||||||||||||||||
| Escondida | troy koz | 1,942 | 2,176 | 2,780 | 2,193 | 1,790 | 1,790 | 1,942 | (8 | %) | 1,942 | 2,176 | 2,780 | 2,193 | 1,790 | 1,790 | 1,942 | (8 | %) | |||||||||||||||||||||||||||||||||||||||||||||||||||||||||||||||||
| Pampa Norte (Spence) | troy koz | 358 | 316 | 375 | 241 | 356 | 356 | 358 | (1 | %) | 358 | 316 | 375 | 241 | 356 | 356 | 358 | (1 | %) | |||||||||||||||||||||||||||||||||||||||||||||||||||||||||||||||||
| Copper South Australia | troy koz | 182 | 179 | 222 | 219 | 114 | 114 | 182 | (37 | %) | 131 | 207 | 162 | 192 | 180 | 180 | 131 | 37 | % | |||||||||||||||||||||||||||||||||||||||||||||||||||||||||||||||||
| Antamina | troy koz | 1,632 | 1,438 | 1,462 | 1,056 | 1,233 | 1,233 | 1,632 | (24 | %) | 1,705 | 1,553 | 1,201 | 947 | 993 | 993 | 1,705 | (42 | %) | |||||||||||||||||||||||||||||||||||||||||||||||||||||||||||||||||
| Refined silver | troy koz | 227 | 284 | 308 | 281 | 224 | 224 | 227 | (1 | %) | 255 | 250 | 340 | 249 | 234 | 234 | 255 | (8 | %) | |||||||||||||||||||||||||||||||||||||||||||||||||||||||||||||||||
| Copper South Australia | troy koz | 227 | 284 | 308 | 281 | 224 | 224 | 227 | (1 | %) | 255 | 250 | 340 | 249 | 234 | 234 | 255 | (8 | %) | |||||||||||||||||||||||||||||||||||||||||||||||||||||||||||||||||
| Total | troy koz | 4,341 | 4,393 | 5,147 | 3,990 | 3,717 | 3,717 | 4,341 | (14 | %) | 4,391 | 4,502 | 4,858 | 3,822 | 3,553 | 3,553 | 4,391 | (19 | %) | |||||||||||||||||||||||||||||||||||||||||||||||||||||||||||||||||
| Uranium |
Payable metal in concentrate | t | 819 | 903 | 778 | 1,147 | 817 | 817 | 819 | 0 | % | 649 | 815 | 650 | 1,552 | 494 | 494 | 649 | (24 | %) | ||||||||||||||||||||||||||||||||||||||||||||||||||||||||||||||||
| Copper South Australia | t | 819 | 903 | 778 | 1,147 | 817 | 817 | 819 | 0 | % | 649 | 815 | 650 | 1,552 | 494 | 494 | 649 | (24 | %) | |||||||||||||||||||||||||||||||||||||||||||||||||||||||||||||||||
| Molybdenum |
Payable metal in concentrate | t | 341 | 281 | 341 | 288 | 599 | 599 | 341 | 76 | % | 347 | 322 | 263 | 225 | 500 | 500 | 347 | 44 | % | ||||||||||||||||||||||||||||||||||||||||||||||||||||||||||||||||
| Pampa Norte (Spence) | t | 257 | 269 | 194 | 163 | 303 | 303 | 257 | 18 | % | 208 | 256 | 205 | 132 | 339 | 339 | 208 | 63 | % | |||||||||||||||||||||||||||||||||||||||||||||||||||||||||||||||||
| Antamina | t | 84 | 12 | 147 | 125 | 296 | 296 | 84 | 252 | % | 139 | 66 | 58 | 93 | 161 | 161 | 139 | 16 | % | |||||||||||||||||||||||||||||||||||||||||||||||||||||||||||||||||
| Iron ore |
Western Australia Iron Ore (WAIO) | kt | 62,015 | 67,766 | 60,922 | 66,174 | 64,299 | 64,299 | 62,015 | 4 | % | 62,430 | 66,909 | 58,608 | 66,430 | 66,306 | 66,306 | 62,430 | 6 | % | ||||||||||||||||||||||||||||||||||||||||||||||||||||||||||||||||
| Samarco | kt | 2,066 | 1,938 | 1,882 | 1,954 | 2,151 | 2,151 | 2,066 | 4 | % | 2,042 | 2,512 | 1,590 | 1,950 | 1,941 | 1,941 | 2,042 | (5 | %) | |||||||||||||||||||||||||||||||||||||||||||||||||||||||||||||||||
| Total | kt | 64,081 | 69,704 | 62,804 | 68,128 | 66,450 | 66,450 | 64,081 | 4 | % | 64,472 | 69,421 | 60,198 | 68,380 | 68,247 | 68,247 | 64,472 | 6 | % | |||||||||||||||||||||||||||||||||||||||||||||||||||||||||||||||||
|
Steelmaking coal |
BHP Mitsubishi Alliance (BMA) | kt | 4,865 | 4,291 | 3,816 | 5,654 | 4,913 | 4,913 | 4,865 | 1 | % | 4,472 | 4,413 | 3,852 | 5,905 | 4,821 | 4,821 | 4,472 | 8 | % | ||||||||||||||||||||||||||||||||||||||||||||||||||||||||||||||||
| Energy coal |
NSW Energy Coal (NSWEC) | kt | 3,518 | 4,610 | 4,037 | 4,196 | 4,449 | 4,449 | 3,518 | 26 | % | 3,707 | 4,372 | 4,048 | 4,538 | 3,931 | 3,931 | 3,707 | 6 | % | ||||||||||||||||||||||||||||||||||||||||||||||||||||||||||||||||
1 The divestment of Carajás was completed on 2 April 2026.
6
BHP | Operational review for the quarter ended 30 September 2026
|
Production |
Sales |
|||||||||||||||||||||||||||||||||||||||||||||||||||||||||||||||||||||||||||
| Quarter ended | Year to date | Quarter ended | Year to date | |||||||||||||||||||||||||||||||||||||||||||||||||||||||||||||||||||||||||
| Sep 2025 |
Dec 2025 |
Mar 2026 |
Jun 2026 |
Sep 2026 |
Sep 2026 |
Sep 2025 |
Var % |
Sep 2025 |
Dec 2025 |
Mar 2026 |
Jun 2026 |
Sep 2026 |
Sep 2026 |
Sep 2025 |
Var % |
|||||||||||||||||||||||||||||||||||||||||||||||||||||||||||||
| Production and sales |
||||||||||||||||||||||||||||||||||||||||||||||||||||||||||||||||||||||||||||
| By asset |
||||||||||||||||||||||||||||||||||||||||||||||||||||||||||||||||||||||||||||
| Copper |
||||||||||||||||||||||||||||||||||||||||||||||||||||||||||||||||||||||||||||
| Metals production is payable metal unless otherwise noted. |
||||||||||||||||||||||||||||||||||||||||||||||||||||||||||||||||||||||||||||
| Escondida, Chile¹ |
BHP interest 57.5% | |||||||||||||||||||||||||||||||||||||||||||||||||||||||||||||||||||||||||||
| Material mined | kt | 114,527 | 112,808 | 114,506 | 130,749 | 107,802 | 107,802 | 114,527 | (6%) | |||||||||||||||||||||||||||||||||||||||||||||||||||||||||||||||||||
| Concentrator throughput | kt | 36,721 | 35,628 | 34,225 | 35,862 | 31,429 | 31,429 | 36,721 | (14%) | |||||||||||||||||||||||||||||||||||||||||||||||||||||||||||||||||||
| Average copper grade - concentrator | % | 0.94% | 0.91% | 0.88% | 0.85% | 0.81% | 0.81% | 0.94% | (14%) | |||||||||||||||||||||||||||||||||||||||||||||||||||||||||||||||||||
| Production ex mill | kt | 294.2 | 279.7 | 255.1 | 253.5 | 210.0 | 210.0 | 294.2 | (29%) | |||||||||||||||||||||||||||||||||||||||||||||||||||||||||||||||||||
| Payable copper | kt | 282.4 | 270.5 | 248.3 | 245.6 | 197.9 | 197.9 | 282.4 | (30%) | 258.3 | 277.7 | 252.1 | 233.6 | 210.7 | 210.7 | 258.3 | (18%) | |||||||||||||||||||||||||||||||||||||||||||||||||||||||||||
| Copper cathode (EW) | kt | 46.5 | 46.7 | 54.9 | 66.3 | 54.7 | 54.7 | 46.5 | 18% | 38.1 | 50.0 | 50.1 | 71.8 | 48.4 | 48.4 | 38.1 | 27% | |||||||||||||||||||||||||||||||||||||||||||||||||||||||||||
| Oxide leach | kt | 16.8 | 11.1 | 19.9 | 29.3 | 22.3 | 22.3 | 16.8 | 33% | |||||||||||||||||||||||||||||||||||||||||||||||||||||||||||||||||||
| Sulphide leach | kt | 29.7 | 35.6 | 35.0 | 37.0 | 32.4 | 32.4 | 29.7 | 9% | |||||||||||||||||||||||||||||||||||||||||||||||||||||||||||||||||||
| Total copper | kt | 328.9 | 317.2 | 303.2 | 311.9 | 252.6 | 252.6 | 328.9 | (23%) | 296.4 | 327.7 | 302.2 | 305.4 | 259.1 | 259.1 | 296.4 | (13%) | |||||||||||||||||||||||||||||||||||||||||||||||||||||||||||
| Payable gold concentrate | troy oz | 35,348 | 31,927 | 52,473 | 39,706 | 40,946 | 40,946 | 35,348 | 16% | 35,348 | 31,927 | 52,473 | 39,706 | 40,946 | 40,946 | 35,348 | 16% | |||||||||||||||||||||||||||||||||||||||||||||||||||||||||||
| Payable silver concentrate | troy koz | 1,942 | 2,176 | 2,780 | 2,193 | 1,790 | 1,790 | 1,942 | (8%) | 1,942 | 2,176 | 2,780 | 2,193 | 1,790 | 1,790 | 1,942 | (8%) | |||||||||||||||||||||||||||||||||||||||||||||||||||||||||||
| 1 Presented on a 100% basis. BHP interest in saleable production is 57.5%. |
||||||||||||||||||||||||||||||||||||||||||||||||||||||||||||||||||||||||||||
| Pampa Norte (Spence), Chile¹ |
BHP interest 100% | |||||||||||||||||||||||||||||||||||||||||||||||||||||||||||||||||||||||||||
| Material mined | kt | 24,695 | 22,895 | 21,690 | 22,066 | 21,201 | 21,201 | 24,695 | (14%) | |||||||||||||||||||||||||||||||||||||||||||||||||||||||||||||||||||
| Ore stacked | kt | 5,652 | 5,354 | 4,435 | 5,146 | 5,386 | 5,386 | 5,652 | (5%) | |||||||||||||||||||||||||||||||||||||||||||||||||||||||||||||||||||
| Average copper grade - stacked | % | 0.61% | 0.58% | 0.66% | 0.64% | 0.56% | 0.56% | 0.61% | (8%) | |||||||||||||||||||||||||||||||||||||||||||||||||||||||||||||||||||
| Concentrator throughput | kt | 7,778 | 8,002 | 7,329 | 8,107 | 7,459 | 7,459 | 7,778 | (4%) | |||||||||||||||||||||||||||||||||||||||||||||||||||||||||||||||||||
| Average copper grade - concentrator | % | 0.65% | 0.60% | 0.53% | 0.50% | 0.53% | 0.53% | 0.65% | (18%) | |||||||||||||||||||||||||||||||||||||||||||||||||||||||||||||||||||
| Payable copper | kt | 35.4 | 33.3 | 25.7 | 26.9 | 27.2 | 27.2 | 35.4 | (23%) | 33.2 | 27.9 | 34.9 | 24.4 | 32.2 | 32.2 | 33.2 | (3%) | |||||||||||||||||||||||||||||||||||||||||||||||||||||||||||
| Copper cathode (EW) | kt | 20.4 | 24.4 | 18.9 | 27.6 | 20.2 | 20.2 | 20.4 | (1%) | 17.9 | 25.4 | 17.4 | 29.3 | 20.0 | 20.0 | 17.9 | 12% | |||||||||||||||||||||||||||||||||||||||||||||||||||||||||||
| Total copper | kt | 55.8 | 57.7 | 44.6 | 54.5 | 47.4 | 47.4 | 55.8 | (15%) | 51.1 | 53.3 | 52.3 | 53.7 | 52.2 | 52.2 | 51.1 | 2% | |||||||||||||||||||||||||||||||||||||||||||||||||||||||||||
| Payable gold concentrate | troy oz | 2,589 | 2,724 | 3,800 | 3,595 | 5,379 | 5,379 | 2,589 | 108% | 2,589 | 2,724 | 3,800 | 3,595 | 5,379 | 5,379 | 2,589 | 108% | |||||||||||||||||||||||||||||||||||||||||||||||||||||||||||
| Payable silver concentrate | troy koz | 358 | 316 | 375 | 241 | 356 | 356 | 358 | (1%) | 358 | 316 | 375 | 241 | 356 | 356 | 358 | (1%) | |||||||||||||||||||||||||||||||||||||||||||||||||||||||||||
| Payable molybdenum | t | 257 | 269 | 194 | 163 | 303 | 303 | 257 | 18% | 208 | 256 | 205 | 132 | 339 | 339 | 208 | 63% | |||||||||||||||||||||||||||||||||||||||||||||||||||||||||||
1 Pampa Norte consists of Spence and Cerro Colorado. Cerro Colorado entered temporary care and maintenance in December 2023.
7
BHP | Operational review for the quarter ended 30 September 2026
|
Production |
Sales |
|||||||||||||||||||||||||||||||||||||||||||||||||||||||||||||||||||||||||||
| Quarter ended | Year to date | Quarter ended | Year to date | |||||||||||||||||||||||||||||||||||||||||||||||||||||||||||||||||||||||||
| Sep 2025 |
Dec 2025 |
Mar 2026 |
Jun 2026 |
Sep 2026 |
Sep 2026 |
Sep 2025 |
Var % |
Sep 2025 |
Dec 2025 |
Mar 2026 |
Jun 2026 |
Sep 2026 |
Sep 2026 |
Sep 2025 |
Var % |
|||||||||||||||||||||||||||||||||||||||||||||||||||||||||||||
| Copper (continued) |
||||||||||||||||||||||||||||||||||||||||||||||||||||||||||||||||||||||||||||
| Copper South Australia, Australia |
BHP interest 100% | |||||||||||||||||||||||||||||||||||||||||||||||||||||||||||||||||||||||||||
| Copper |
Payable metal in concentrate | kt | 25.5 | 24.8 | 28.3 | 30.7 | 17.7 | 17.7 | 25.5 | (31%) | 15.9 | 24.8 | 18.0 | 27.3 | 22.9 | 22.9 | 15.9 | 44% | ||||||||||||||||||||||||||||||||||||||||||||||||||||||||||
| Cathode | kt | 52.7 | 52.9 | 55.3 | 60.4 | 48.8 | 48.8 | 52.7 | (7%) | 49.9 | 55.3 | 51.2 | 61.0 | 46.7 | 46.7 | 49.9 | (6%) | |||||||||||||||||||||||||||||||||||||||||||||||||||||||||||
| Total copper | kt | 78.2 | 77.7 | 83.6 | 91.1 | 66.5 | 66.5 | 78.2 | (15%) | 65.8 | 80.1 | 69.2 | 88.3 | 69.6 | 69.6 | 65.8 | 6% | |||||||||||||||||||||||||||||||||||||||||||||||||||||||||||
| Payable metal in concentrate transfer to Olympic Dam | kt | (5.6) | (2.6) | (0.8) | (0.9) | (5.8) | (5.8) | (5.6) | 4% | |||||||||||||||||||||||||||||||||||||||||||||||||||||||||||||||||||
| Net copper | kt | 72.6 | 75.1 | 82.8 | 90.2 | 60.7 | 60.7 | 72.6 | (16%) | |||||||||||||||||||||||||||||||||||||||||||||||||||||||||||||||||||
| Gold |
Payable metal in concentrate | troy oz | 47,893 | 41,351 | 48,532 | 43,408 | 33,159 | 33,159 | 47,893 | (31%) | 26,476 | 45,024 | 29,234 | 44,320 | 35,053 | 35,053 | 26,476 | 32% | ||||||||||||||||||||||||||||||||||||||||||||||||||||||||||
| Refined gold | troy oz | 50,716 | 61,910 | 54,511 | 63,888 | 49,656 | 49,656 | 50,716 | (2%) | 51,147 | 59,054 | 57,336 | 55,962 | 48,038 | 48,038 | 51,147 | (6%) | |||||||||||||||||||||||||||||||||||||||||||||||||||||||||||
| Total gold | troy oz | 98,609 | 103,261 | 103,043 | 107,296 | 82,815 | 82,815 | 98,609 | (16%) | 77,623 | 104,078 | 86,570 | 100,282 | 83,091 | 83,091 | 77,623 | 7% | |||||||||||||||||||||||||||||||||||||||||||||||||||||||||||
| Payable metal in concentrate transfer to Olympic Dam |
troy oz | (11,404) | (4,358) | (1,268) | (1,820) | (8,774) | (8,774) | (11,404) | (23%) | |||||||||||||||||||||||||||||||||||||||||||||||||||||||||||||||||||
| Net gold | troy oz | 87,205 | 98,903 | 101,775 | 105,476 | 74,041 | 74,041 | 87,205 | (15%) | |||||||||||||||||||||||||||||||||||||||||||||||||||||||||||||||||||
| Silver |
Payable metal in concentrate | troy koz | 213 | 193 | 226 | 224 | 139 | 139 | 213 | (35%) | 131 | 207 | 162 | 192 | 180 | 180 | 131 | 37% | ||||||||||||||||||||||||||||||||||||||||||||||||||||||||||
| Refined silver | troy koz | 227 | 284 | 308 | 281 | 224 | 224 | 227 | (1%) | 255 | 250 | 340 | 249 | 234 | 234 | 255 | (8%) | |||||||||||||||||||||||||||||||||||||||||||||||||||||||||||
| Total silver | troy koz | 440 | 477 | 534 | 505 | 363 | 363 | 440 | (18%) | 386 | 457 | 502 | 441 | 414 | 414 | 386 | 7% | |||||||||||||||||||||||||||||||||||||||||||||||||||||||||||
| Payable metal in concentrate transfer to Olympic Dam |
troy koz | (31) | (14) | (4) | (5) | (25) | (25) | (31) | (19%) | |||||||||||||||||||||||||||||||||||||||||||||||||||||||||||||||||||
| Net silver | troy koz | 409 | 463 | 530 | 500 | 338 | 338 | 409 | (17%) | |||||||||||||||||||||||||||||||||||||||||||||||||||||||||||||||||||
| Uranium |
t | 819 | 903 | 778 | 1,147 | 817 | 817 | 819 | 0% | 649 | 815 | 650 | 1,552 | 494 | 494 | 649 | (24%) | |||||||||||||||||||||||||||||||||||||||||||||||||||||||||||
| Olympic Dam |
||||||||||||||||||||||||||||||||||||||||||||||||||||||||||||||||||||||||||||
| Material mined | kt | 2,818 | 2,763 | 2,732 | 2,927 | 2,851 | 2,851 | 2,818 | 1% | |||||||||||||||||||||||||||||||||||||||||||||||||||||||||||||||||||
| Ore milled | kt | 2,640 | 2,926 | 2,565 | 2,769 | 2,764 | 2,764 | 2,640 | 5% | |||||||||||||||||||||||||||||||||||||||||||||||||||||||||||||||||||
| Average copper grade | % | 1.97% | 1.97% | 1.92% | 2.14% | 1.98% | 1.98% | 1.97% | 1% | |||||||||||||||||||||||||||||||||||||||||||||||||||||||||||||||||||
| Average uranium grade | kg/t | 0.55 | 0.56 | 0.57 | 0.65 | 0.58 | 0.58 | 0.55 | 5% | |||||||||||||||||||||||||||||||||||||||||||||||||||||||||||||||||||
| Copper cathode (ER and EW) | kt | 52.7 | 52.9 | 55.3 | 60.4 | 48.8 | 48.8 | 52.7 | (7%) | 49.9 | 55.3 | 51.2 | 61.0 | 46.7 | 46.7 | 49.9 | (6%) | |||||||||||||||||||||||||||||||||||||||||||||||||||||||||||
| Refined gold | troy oz | 50,716 | 61,910 | 54,511 | 63,888 | 49,656 | 49,656 | 50,716 | (2%) | 51,147 | 59,054 | 57,336 | 55,962 | 48,038 | 48,038 | 51,147 | (6%) | |||||||||||||||||||||||||||||||||||||||||||||||||||||||||||
| Refined silver | troy koz | 227 | 284 | 308 | 281 | 224 | 224 | 227 | (1%) | 255 | 250 | 340 | 249 | 234 | 234 | 255 | (8%) | |||||||||||||||||||||||||||||||||||||||||||||||||||||||||||
| Payable uranium | t | 819 | 903 | 778 | 1,147 | 817 | 817 | 819 | 0% | 649 | 815 | 650 | 1,552 | 494 | 494 | 649 | (24%) | |||||||||||||||||||||||||||||||||||||||||||||||||||||||||||
| Prominent Hill |
||||||||||||||||||||||||||||||||||||||||||||||||||||||||||||||||||||||||||||
| Material mined | kt | 1,049 | 1,014 | 1,026 | 1,271 | 975 | 975 | 1,049 | (7%) | |||||||||||||||||||||||||||||||||||||||||||||||||||||||||||||||||||
| Ore milled | kt | 1,621 | 1,376 | 1,494 | 1,651 | 1,211 | 1,211 | 1,621 | (25%) | |||||||||||||||||||||||||||||||||||||||||||||||||||||||||||||||||||
| Average copper grade | % | 0.71% | 0.83% | 0.90% | 0.94% | 0.84% | 0.84% | 0.71% | 18% | |||||||||||||||||||||||||||||||||||||||||||||||||||||||||||||||||||
| Concentrate produced | kt | 19.0 | 19.1 | 25.7 | 30.7 | 20.5 | 20.5 | 19.0 | 8% | |||||||||||||||||||||||||||||||||||||||||||||||||||||||||||||||||||
| Payable copper | kt | 9.9 | 9.7 | 11.8 | 13.1 | 8.8 | 8.8 | 9.9 | (11%) | 4.4 | 7.5 | 3.1 | 12.2 | 9.4 | 9.4 | 4.4 | 114% | |||||||||||||||||||||||||||||||||||||||||||||||||||||||||||
| Payable gold concentrate | troy oz | 24,105 | 17,406 | 23,664 | 18,941 | 19,072 | 19,072 | 24,105 | (21%) | 9,033 | 17,671 | 5,894 | 23,401 | 15,199 | 15,199 | 9,033 | 68% | |||||||||||||||||||||||||||||||||||||||||||||||||||||||||||
| Payable silver concentrate | troy koz | 61 | 49 | 60 | 63 | 40 | 40 | 61 | (34%) | 29 | 45 | 20 | 61 | 48 | 48 | 29 | 66% | |||||||||||||||||||||||||||||||||||||||||||||||||||||||||||
|
Carrapateena |
||||||||||||||||||||||||||||||||||||||||||||||||||||||||||||||||||||||||||||
| Material mined | kt | 1,488 | 1,479 | 1,632 | 1,751 | 753 | 753 | 1,488 | (49%) | |||||||||||||||||||||||||||||||||||||||||||||||||||||||||||||||||||
| Ore milled | kt | 1,511 | 1,415 | 1,516 | 1,713 | 962 | 962 | 1,511 | (36%) | |||||||||||||||||||||||||||||||||||||||||||||||||||||||||||||||||||
| Average copper grade | % | 1.18% | 1.20% | 1.22% | 1.17% | 1.07% | 1.07% | 1.18% | (9%) | |||||||||||||||||||||||||||||||||||||||||||||||||||||||||||||||||||
| Concentrate produced | kt | 52.4 | 53.4 | 61.4 | 65.2 | 32.6 | 32.6 | 52.4 | (38%) | |||||||||||||||||||||||||||||||||||||||||||||||||||||||||||||||||||
| Payable copper | kt | 15.6 | 15.1 | 16.5 | 17.6 | 8.9 | 8.9 | 15.6 | (43%) | 11.5 | 17.3 | 14.9 | 15.1 | 13.5 | 13.5 | 11.5 | 17% | |||||||||||||||||||||||||||||||||||||||||||||||||||||||||||
| Payable gold concentrate | troy oz | 23,788 | 23,945 | 24,868 | 24,467 | 14,087 | 14,087 | 23,788 | (41%) | 17,443 | 27,353 | 23,340 | 20,919 | 19,854 | 19,854 | 17,443 | 14% | |||||||||||||||||||||||||||||||||||||||||||||||||||||||||||
| Payable silver concentrate | troy koz | 152 | 144 | 166 | 161 | 99 | 99 | 152 | (35%) | 102 | 162 | 142 | 131 | 132 | 132 | 102 | 29% | |||||||||||||||||||||||||||||||||||||||||||||||||||||||||||
8
BHP | Operational review for the quarter ended 30 September 2026
| Production | Sales | |||||||||||||||||||||||||||||||||||||||||||||||||||||||||||||||||||||||||||
| Quarter ended | Year to date | Quarter ended | Year to date | |||||||||||||||||||||||||||||||||||||||||||||||||||||||||||||||||||||||||
| Sep 2025 |
Dec 2025 |
Mar 2026 |
Jun 2026 |
Sep 2026 |
Sep 2026 |
Sep 2025 |
Var % |
Sep 2025 |
Dec 2025 |
Mar 2026 |
Jun 2026 |
Sep 2026 |
Sep 2026 |
Sep 2025 |
Var % |
|||||||||||||||||||||||||||||||||||||||||||||||||||||||||||||
| Copper (continued) |
||||||||||||||||||||||||||||||||||||||||||||||||||||||||||||||||||||||||||||
| Antamina, Peru |
BHP interest 33.75% |
|||||||||||||||||||||||||||||||||||||||||||||||||||||||||||||||||||||||||||
| Material mined | kt | 58,970 | 57,442 | 54,819 | 60,871 | 61,562 | 61,562 | 58,970 | 4% | |||||||||||||||||||||||||||||||||||||||||||||||||||||||||||||||||||
| Concentrator throughput | kt | 13,307 | 13,725 | 13,783 | 10,984 | 12,617 | 12,617 | 13,307 | (5%) | |||||||||||||||||||||||||||||||||||||||||||||||||||||||||||||||||||
| Average head grade - copper | % | 0.86% | 0.98% | 1.12% | 1.08% | 1.02% | 1.02% | 0.86% | 19% | |||||||||||||||||||||||||||||||||||||||||||||||||||||||||||||||||||
| Average head grade - zinc | % | 1.26% | 1.01% | 0.79% | 0.74% | 0.56% | 0.56% | 1.26% | (56%) | |||||||||||||||||||||||||||||||||||||||||||||||||||||||||||||||||||
| Payable copper | kt | 33.9 | 38.2 | 44.1 | 35.3 | 40.0 | 40.0 | 33.9 | 18% | 33.1 | 40.4 | 43.3 | 35.9 | 36.4 | 36.4 | 33.1 | 10% | |||||||||||||||||||||||||||||||||||||||||||||||||||||||||||
| Payable zinc | t | 35,991 | 27,003 | 17,723 | 15,410 | 10,952 | 10,952 | 35,991 | (70%) | 41,499 | 26,046 | 18,573 | 14,703 | 11,413 | 11,413 | 41,499 | (72%) | |||||||||||||||||||||||||||||||||||||||||||||||||||||||||||
| Payable silver | troy koz | 1,632 | 1,438 | 1,462 | 1,056 | 1,233 | 1,233 | 1,632 | (24%) | 1,705 | 1,553 | 1,201 | 947 | 993 | 993 | 1,705 | (42%) | |||||||||||||||||||||||||||||||||||||||||||||||||||||||||||
| Payable lead | t | 754 | 91 | 209 | 225 | 73 | 73 | 754 | (90%) | 1,469 | 551 | 14 | 207 | 236 | 236 | 1,469 | (84%) | |||||||||||||||||||||||||||||||||||||||||||||||||||||||||||
| Payable molybdenum | t | 84 | 12 | 147 | 125 | 296 | 296 | 84 | 252% | 139 | 66 | 58 | 93 | 161 | 161 | 139 | 16% | |||||||||||||||||||||||||||||||||||||||||||||||||||||||||||
| Carajás, Brazil1 |
BHP interest 100% |
|||||||||||||||||||||||||||||||||||||||||||||||||||||||||||||||||||||||||||
| Material mined | kt | 134 | 147 | 148 | - | - | - | 134 | - | |||||||||||||||||||||||||||||||||||||||||||||||||||||||||||||||||||
| Ore milled | kt | 160 | 172 | 156 | - | - | - | 160 | - | |||||||||||||||||||||||||||||||||||||||||||||||||||||||||||||||||||
| Average copper grade | % | 1.63% | 1.51% | 1.48% | - | - | - | 1.63% | - | |||||||||||||||||||||||||||||||||||||||||||||||||||||||||||||||||||
| Production ex mill | kt | 10.3 | 9.8 | 8.8 | - | - | - | 10.3 | - | |||||||||||||||||||||||||||||||||||||||||||||||||||||||||||||||||||
| Average gold grade | g/t | 0.46 | 0.47 | 0.47 | - | - | - | 0.46 | - | |||||||||||||||||||||||||||||||||||||||||||||||||||||||||||||||||||
| Payable copper | kt | 2.4 | 2.3 | 2.1 | - | - | - | 2.4 | - | 2.5 | 3.0 | 1.7 | - | - | - | 2.5 | - | |||||||||||||||||||||||||||||||||||||||||||||||||||||||||||
| Payable gold concentrate | troy oz | 1,816 | 1,941 | 1,784 | - | - | - | 1,816 | - | 1,964 | 2,424 | 1,505 | - | - | - | 1,964 | - | |||||||||||||||||||||||||||||||||||||||||||||||||||||||||||
| 1 The divestment of Carajás was completed on 2 April 2026. |
||||||||||||||||||||||||||||||||||||||||||||||||||||||||||||||||||||||||||||
| Iron ore |
||||||||||||||||||||||||||||||||||||||||||||||||||||||||||||||||||||||||||||
| Iron ore production is reported on the basis of saleable product, which is wet metric tonnes (wmt) for WAIO and dry metric tonnes (dmt) for Samarco. |
||||||||||||||||||||||||||||||||||||||||||||||||||||||||||||||||||||||||||||
| WAIO, Australia |
BHP interest 85% |
|||||||||||||||||||||||||||||||||||||||||||||||||||||||||||||||||||||||||||
| Newman Joint Venture | kt | 13,724 | 13,340 | 13,517 | 12,100 | 11,300 | 11,300 | 13,724 | (18%) | |||||||||||||||||||||||||||||||||||||||||||||||||||||||||||||||||||
| Area C Joint Venture | kt | 29,415 | 32,265 | 33,584 | 33,762 | 29,149 | 29,149 | 29,415 | (1%) | |||||||||||||||||||||||||||||||||||||||||||||||||||||||||||||||||||
| Yandi Joint Venture | kt | 3,498 | 2,899 | 2,941 | 3,252 | 2,671 | 2,671 | 3,498 | (24%) | |||||||||||||||||||||||||||||||||||||||||||||||||||||||||||||||||||
| Jimblebar¹ | kt | 15,378 | 19,262 | 10,880 | 17,060 | 21,179 | 21,179 | 15,378 | 38% | |||||||||||||||||||||||||||||||||||||||||||||||||||||||||||||||||||
| Total | kt | 62,015 | 67,766 | 60,922 | 66,174 | 64,299 | 64,299 | 62,015 | 4% | |||||||||||||||||||||||||||||||||||||||||||||||||||||||||||||||||||
| Total (100%) | kt | 70,246 | 76,326 | 69,752 | 74,840 | 71,909 | 71,909 | 70,246 | 2% | |||||||||||||||||||||||||||||||||||||||||||||||||||||||||||||||||||
| Lump | kt | 20,250 | 20,595 | 19,878 | 22,014 | 18,505 | 18,505 | 20,250 | (9%) | |||||||||||||||||||||||||||||||||||||||||||||||||||||||||||||||||||
| Fines | kt | 42,180 | 46,314 | 38,730 | 44,416 | 47,801 | 47,801 | 42,180 | 13% | |||||||||||||||||||||||||||||||||||||||||||||||||||||||||||||||||||
| Total | kt | 62,430 | 66,909 | 58,608 | 66,430 | 66,306 | 66,306 | 62,430 | 6% | |||||||||||||||||||||||||||||||||||||||||||||||||||||||||||||||||||
| Total (100%) | kt | 70,592 | 75,397 | 67,001 | 75,105 | 73,953 | 73,953 | 70,592 | 5% | |||||||||||||||||||||||||||||||||||||||||||||||||||||||||||||||||||
| 1 Presented on a 100% basis. BHP interest in saleable production is 85%. |
||||||||||||||||||||||||||||||||||||||||||||||||||||||||||||||||||||||||||||
| Samarco, Brazil |
BHP interest 50% |
|||||||||||||||||||||||||||||||||||||||||||||||||||||||||||||||||||||||||||
| Total | kt | 2,066 | 1,938 | 1,882 | 1,954 | 2,151 | 2,151 | 2,066 | 4% | 2,042 | 2,512 | 1,590 | 1,950 | 1,941 | 1,941 | 2,042 | (5%) | |||||||||||||||||||||||||||||||||||||||||||||||||||||||||||
9
BHP | Operational review for the quarter ended 30 September 2026
| Production | Sales | |||||||||||||||||||||||||||||||||||||||||||||||||||||||||||||||||||||||||||
| Quarter ended | Year to date | Quarter ended | Year to date | |||||||||||||||||||||||||||||||||||||||||||||||||||||||||||||||||||||||||
| Sep 2025 |
Dec 2025 |
Mar 2026 |
Jun 2026 |
Sep 2026 |
Sep 2026 |
Sep 2025 |
Var % |
Sep 2025 |
Dec 2025 |
Mar 2026 |
Jun 2026 |
Sep 2026 |
Sep 2026 |
Sep 2025 |
Var % |
|||||||||||||||||||||||||||||||||||||||||||||||||||||||||||||
| Coal |
||||||||||||||||||||||||||||||||||||||||||||||||||||||||||||||||||||||||||||
| Coal production is reported on the basis of saleable product. |
||||||||||||||||||||||||||||||||||||||||||||||||||||||||||||||||||||||||||||
| BMA, Australia |
BHP interest 50% | |||||||||||||||||||||||||||||||||||||||||||||||||||||||||||||||||||||||||||
| Goonyella | kt | 1,880 | 1,254 | 1,124 | 1,995 | 1,909 | 1,909 | 1,880 | 2% | |||||||||||||||||||||||||||||||||||||||||||||||||||||||||||||||||||
| Peak Downs | kt | 1,111 | 967 | 1,176 | 1,584 | 1,191 | 1,191 | 1,111 | 7% | |||||||||||||||||||||||||||||||||||||||||||||||||||||||||||||||||||
| Saraji | kt | 884 | 1,146 | 849 | 1,073 | 846 | 846 | 884 | (4%) | |||||||||||||||||||||||||||||||||||||||||||||||||||||||||||||||||||
| Caval Ridge | kt | 990 | 924 | 667 | 1,002 | 967 | 967 | 990 | (2%) | |||||||||||||||||||||||||||||||||||||||||||||||||||||||||||||||||||
| Total1 | kt | 4,865 | 4,291 | 3,816 | 5,654 | 4,913 | 4,913 | 4,865 | 1% | |||||||||||||||||||||||||||||||||||||||||||||||||||||||||||||||||||
| Total (100%)1 | kt | 9,730 | 8,582 | 7,632 | 11,308 | 9,826 | 9,826 | 9,730 | 1% | |||||||||||||||||||||||||||||||||||||||||||||||||||||||||||||||||||
| Hard coking coal | kt | 4,428 | 4,302 | 3,842 | 5,522 | 4,733 | 4,733 | 4,428 | 7% | |||||||||||||||||||||||||||||||||||||||||||||||||||||||||||||||||||
| Energy coal | kt | 44 | 111 | 10 | 383 | 88 | 88 | 44 | 100% | |||||||||||||||||||||||||||||||||||||||||||||||||||||||||||||||||||
| Total | kt | 4,472 | 4,413 | 3,852 | 5,905 | 4,821 | 4,821 | 4,472 | 8% | |||||||||||||||||||||||||||||||||||||||||||||||||||||||||||||||||||
| Total (100%) | kt | 8,944 | 8,826 | 7,704 | 11,810 | 9,642 | 9,642 | 8,944 | 8% | |||||||||||||||||||||||||||||||||||||||||||||||||||||||||||||||||||
| 1 Production figures include some energy coal. |
||||||||||||||||||||||||||||||||||||||||||||||||||||||||||||||||||||||||||||
| NSWEC, Australia |
BHP interest 100% | |||||||||||||||||||||||||||||||||||||||||||||||||||||||||||||||||||||||||||
| Energy coal - Export | kt | 3,549 | 4,190 | 3,935 | 4,224 | 3,879 | 3,879 | 3,549 | 9% | |||||||||||||||||||||||||||||||||||||||||||||||||||||||||||||||||||
| Energy coal - Domestic | kt | 158 | 182 | 113 | 314 | 52 | 52 | 158 | (67%) | |||||||||||||||||||||||||||||||||||||||||||||||||||||||||||||||||||
| Total | kt | 3,518 | 4,610 | 4,037 | 4,196 | 4,449 | 4,449 | 3,518 | 26% | 3,707 | 4,372 | 4,048 | 4,538 | 3,931 | 3,931 | 3,707 | 6% | |||||||||||||||||||||||||||||||||||||||||||||||||||||||||||
10
BHP | Operational review for the quarter ended 30 September 2026
Appendix 3
Executive Summary
Olympic Dam - Updated Mineral Resources
Table 1: Updated Olympic Dam Mineral Resources (inclusive of Ore Reserves) as at 1st September 20261
| Material type | Measured Resources |
Indicated Resources |
Inferred Resources |
Total Resources | ||||||||||||||||||||||||||||||||||||
| Mt | Cu % | U3O8 kg/t |
Au g/t |
Ag g/t |
Mt | Cu % | U3O8 kg/t |
Au g/t |
Ag g/t |
Mt | Cu % | U3O8 kg/t |
Au g/t |
Ag g/t |
Mt | Cu % | U3O8 kg/t |
Au g/t |
Ag g/t | |||||||||||||||||||||
| UG Sulphide (Block Cave) 2,3,4,5,6 |
4,000 | 0.61 | 0.19 | 0.21 | 1 | 4,130 | 0.57 | 0.18 | 0.21 | 1 | 2,600 | 0.60 | 0.19 | 0.23 | 1 | 10,730 | 0.59 | 0.19 | 0.21 | 1 | ||||||||||||||||||||
| UG Sulphide (SLOS)7 | 840 | 1.59 | 0.47 | 0.62 | 3 | 540 | 1.56 | 0.45 | 0.57 | 3 | 210 | 1.44 | 0.42 | 0.63 | 3 | 1,590 | 1.56 | 0.46 | 0.60 | 3 | ||||||||||||||||||||
| OC Sulphide8 | - | - | - | - | - | - | - | - | - | - | - | - | - | - | - | - | - | - | - | - | ||||||||||||||||||||
Footnotes for Table 1
| 1. | The information in this report that relates to Mineral Resources is based on and fairly represent the information and supporting documentation compiled by MP O’Hare, a Competent Person who is a Member of The Australasian Institute of Mining and Metallurgy (MAusIMM). The Competent Person is a full-time employee of BHP and has sufficient experience that is relevant to the style of mineralisation and type of deposit under consideration and to the activity being undertaken to qualify as a Competent Person as defined in the 2012 Edition of the ‘Australasian Code for Reporting of Exploration Results, Mineral Resources and Ore Reserves’. The Competent Person confirms they have no conflict of interest, perceived or otherwise, and consents to the inclusion in the report of the matters based on their information in the form and context in which it appears. |
| Tonnes and grades have been rounded so small differences may present in the totals. |
| 2. | Block cave Mineral Resource assumes prior mining of declared underground (UG) sub-level open stoping (SLOS) Mineral Resource. |
| 3. | A break-even economic cut-off of ≥0.35% Cu was applied to each selective mining unit (SMU) (after depletion for existing mining and entire SLOS Mineral Resource). |
| 4. | Minimum SMU comprised of three connected regularised blocks with dimensions of 100 m by 100 m in XY and minimum of 200 m in Z, and a maximum depth of ~1,500 m from surface. |
| 5. | SMU which contained ≥50% backfill (actual or future) was classified as Inferred. |
| 6. | Geological confidence is informed by drilling samples, with drill spacing of <80 m for Measured, 80 m to 180 m for Indicated, and 180 m to 300 m for Inferred Resources. |
| 7. | The UG Sulphide (SLOS) Mineral Resource is unchanged from that reported in BHP’s FY26 Annual Report (www.bhp.com), where it is referred to as ‘UG sulphide’. |
| 8. | The UG Sulphide (SLOS) and UG Sulphide Block Cave (BC) Mineral Resources together account for the majority of the shallower mineralisation. The remaining mineralisation is insufficient to warrant ongoing reporting of an Open Cut (OC) Mineral Resource, and has been removed. |
Table 2: Olympic Dam Ore Reserves as at 30th June 20261
| Material type |
Proved Ore Reserve |
Probable Ore Reserve |
Total Ore Reserve | |||||||||||||||||||||||||||
| Mt | Cu % |
U3O8 kg/t |
Au g/t |
Ag g/t |
Mt | Cu % | U3O8 kg/t |
Au g/t |
Ag g/t |
Mt | Cu % | U3O8 kg/t |
Au g/t |
Ag g/t | ||||||||||||||||
| UG Sulphide2,3,5,6 |
355 | 1.89 | 0.59 | 0.72 | 4 | 254 | 1.68 | 0.53 | 0.62 | 3 | 609 | 1.80 | 0.56 | 0.68 | 4 | |||||||||||||||
| Low grade4 |
- | - | - | - | - | 44 | 0.83 | 0.28 | 0.34 | 2 | 44 | 0.83 | 0.28 | 0.34 | 2 | |||||||||||||||
Footnotes for Table 2
| 1. | The information in this report that relates to Ore Reserves is based on and fairly represent the information and supporting documentation compiled by Naveen S Kinthada, a Competent Person who is a Member of The Australasian Institute of Mining and Metallurgy (MAusIMM). The Competent Person is a full-time employee of BHP and has sufficient experience that is relevant to the style of mineralisation and type of deposit under consideration and to the activity being undertaken to qualify as a Competent Person as defined in the 2012 Edition of the ‘Australasian Code for Reporting of Exploration Results, Mineral Resources and Ore Reserves’. The Competent Person confirms they have no conflict of interest, perceived or otherwise, and consents to the inclusion in the report of the matters based on their information in the form and context in which it appears. |
| Tonnes and grades have been rounded so small differences may present in the totals. |
| 2. | Ore Reserves are declared using a SLOS mining method and are unchanged from that reported in BHP’s FY26 Annual Report (www.bhp.com). |
| 3. | Variable cut-off between 1.0% and 1.7% Cu |
| 4. | Low-grade is ≥0.6 Cu% |
| 5. | Approximate drill-hole spacing used to classify the reserves were: 20 m to 35 m for Proved Reserves and 35 m to 70m for Probable Reserves. |
| 6. | The metallurgical recoveries: Cu 94%, U3O8 65%, Au 71%, Ag 63%. |
11
BHP | Operational review for the quarter ended 30 September 2026
1 Introduction
This report is issued in support of the first-time reporting of an underground block cave (BC) Mineral Resource at Olympic Dam, alongside the existing underground sub-level open stoping (SLOS) Mineral Resource. Ore Reserves remain unchanged from that reported in the FY26 Annual Report and is included for transparency and completeness. The newly reported Block Cave Mineral Resource has not been converted to Ore Reserve. The UG Sulphide (SLOS) and UG Sulphide Block Cave (BC) Mineral Resources together account for the majority of the shallower mineralisation. The remaining mineralisation is insufficient to warrant ongoing separate reporting of an Open Cut (OC) Mineral Resource and has been removed. These changes reflect the application of updated mining scenarios for the Olympic Dam Deposit: selective sub-level open stoping for higher-grade material and bulk underground mining, such as block caving, for large continuous volumes. Together, these scenarios support assessment of future mining options as studies progress.
Olympic Dam is an integrated copper (Cu), uranium (U3O8), gold (Au) and silver (Ag) mine located on traditional Kokatha Country in South Australia, 16 kilometres north of Roxby Downs and approximately 570 kilometres north-northwest of Adelaide, the capital of South Australia (Figure 1). The operation consists of an underground mine, mineral processing plant, copper smelter and refinery, as well as associated infrastructure. These are contained within the Olympic Dam’s special mining lease (SML) (Figure 2).
The updated Mineral Resource is based on the underlying resource model reported in BHP’s FY2026 Annual report as at 30 June 2026 (www.bhp.com). Material outside the existing SLOS Mineral Resource, including the relevant portion of mineralisation previously reported as OC, was reassessed for reasonable prospects of eventual economic extraction under a block-caving scenario. Total drilling for the updated Olympic Dam Mineral Resource is approximately 4,070 km, with a nominal drill hole spacing ranging from 20 m to >300 m, and approximately perpendicular to the interpreted orebody orientation. Resource definition drilling activities continue at Olympic Dam.
The Olympic Dam BC Mineral Resource is 10,730 Mt at 0.59 % Cu, 0.19 kg/t U3O8, 0.21 g/t Au, and 1 g/t Ag (Table 1). This considers a non-selective underground block caving scenario, reporting all material within a continuous shape designed to capture material generally above 0.35% Cu, where all material was deemed to have reasonable prospects of eventual economic extraction. As such, zero-grade waste material was included as internal dilution to account for the non-selective nature of block caving. As mining studies progress, the constraint (and therefore the reported Olympic Dam Mineral Resource) may change; block-cave mining remains at an early stage of assessment, and its potential development timeframe is not yet known.
The inclusion of an underground bulk mining method provides an updated total classified underground Mineral Resource for Olympic Dam, estimated to contain 88.1 Mt of Cu, 2.8 Mt of U3O8, 103 Moz of Au and 498 Moz of Ag, where Moz is million troy ounces. Contained metal estimates are calculated from the rounded total Resource tonnages and grades reported in Table 1, and are not an estimate of recoverable metal. Totals may differ due to rounding.
Mineralisation remains open at depth.1
2 Mineral tenement and land tenure
The Roxby Downs (Indenture Ratification) Act 1982 (SA) provides statutory authority for an agreement (Indenture) between BHP and the State of South Australia. The Indenture establishes the legal framework for existing and future operations at Olympic Dam and defines the roles and responsibilities of the South Australian Government and BHP. Part of the Indenture provided the grant of Olympic Dam’s special mining lease (SML).
The Indenture confers continuous mining rights (via the SML) to BHP until the deposit is economically depleted. The current 50-year term of the SML ends in 2036. Under key amendments to the Indenture agreed between the South Australian Government and BHP in 2026, a Final Investment Decision (FID) by BHP for the first phase of the Smelter Refinery Expansion Project would trigger rights for the expansion of the SML boundaries and extension of the SML term by 10 years to 2046. A subsequent FID by BHP for the Mine Concentrator Growth project would trigger a right to extend the SML term for a further 40 years to 2086. In addition to these specific extension rights, the Indenture still provides rights for further SML term extensions linked to the expected life of the mine (regardless of any FIDs by BHP). All agreements are in place as part of the normal operating practices.
| 1 | BHP Quarterly Activities Report, 18th Jan 2024 “Operational review for the half year ended 31 December 2023”. Appendix 3, Project status update – Olympic Dam “Deeps” (OD Deeps). www.bhp.com |
12
BHP | Operational review for the quarter ended 30 September 2026
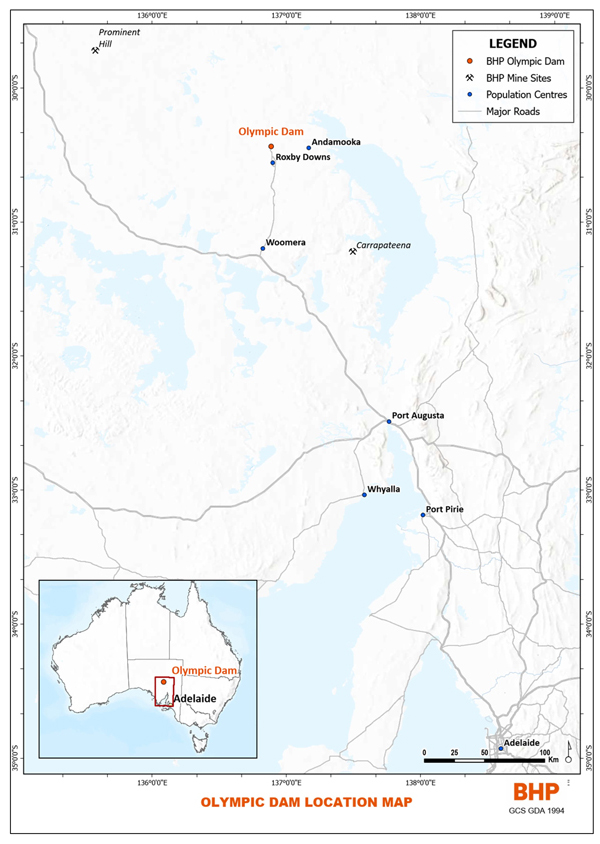
Figure 1. Location of the Olympic Dam mine.
13
BHP | Operational review for the quarter ended 30 September 2026
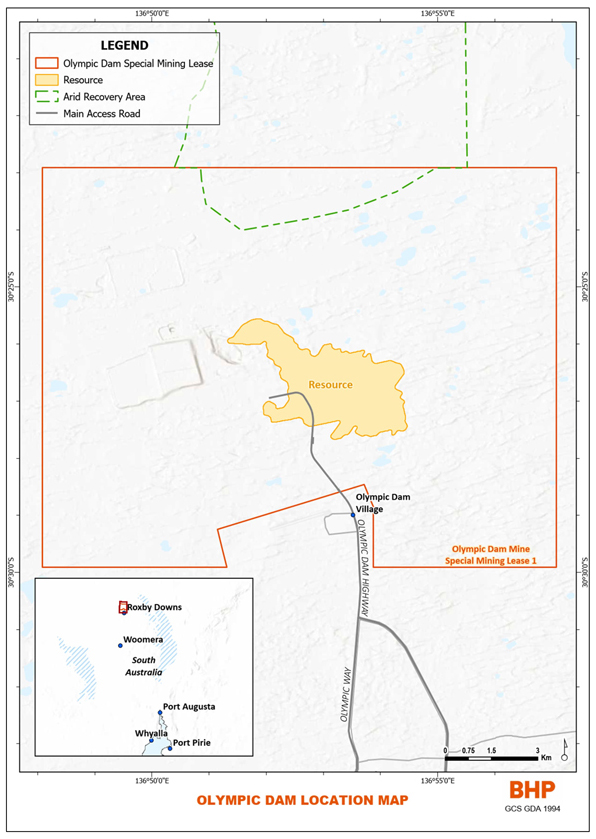
Figure 2. Approximate Olympic Dam resource outline within Special Mining Lease 1 (SML)
14
BHP | Operational review for the quarter ended 30 September 2026
3 Geology
The Olympic Dam deposit lies entirely within the Olympic Dam Breccia Complex (Figure 3), which is hosted by the 1,593.28 ± 0.26 Ma Roxby Downs Granite. The breccia complex contains the mineralised rock volume and covers approximately 50 km². It is about 6 km long and 3 km wide, typically extends to a depth of 900 m, and locally reaches more than 2,000 m below surface.
Approximately 350 m of unaltered, unmineralised, flat-lying Neoproterozoic to Cambrian sedimentary rocks unconformably overlie the breccia complex. The Roxby Downs Granite is the principal host rock. Other important components are bedded clastic facies; clasts of 1,594.63 ± 0.71 Ma Gawler Range Volcanic felsic feldspar-phyric lavas in hematite-rich breccias and dykes; and mafic-ultramafic lavas and dykes (MDY). The MDY are pre-, syn- and post-mineralisation, and form an integral part of the Olympic Dam ore-forming system. The breccia complex and the surrounding unbrecciated Roxby Downs Granite are intruded by the regionally extensive ca. 825 Ma Gairdner Dyke Swarm (dolerite).
Mineralisation is hosted by Roxby Downs Granite and other lithologies, including bedded clastic facies, felsic lavas, mafic-ultramafic lavas, sills and dykes, and subvolcanic quartz-phyric rhyolite. Tectonic, magmatic and hydrothermal processes have weakly to intensely brecciated these rocks. Iron oxide alteration has variably replaced them, producing a compositional continuum from recognisable lithologies to iron oxide breccias in which primary lithological textures have been obliterated. Faulting and brecciation commonly obscure lithological contacts.
More than 100 minerals occur in the deposit, although 15 account for more than 98% of the rock mass. The principal gangue minerals are hematite, quartz, muscovite, K-feldspar, chlorite, fluorite, siderite and barite. The dominant sulphide minerals are chalcocite/digenite/djurleite (collectively referred to here as chalcocite), bornite, chalcopyrite and pyrite. Sphalerite, galena, molybdenite and tennantite-tetrahedrite are less abundant, while native copper occurs only in trace amounts. Sulphides generally occur as disseminated grains within the breccia matrix and clasts, ranging in size from <20 µm to several millimetres, with an average grain size of approximately 100 µm. They only rarely occur as veins in granite-dominated breccias.
At the deposit scale, Cu ± Fe sulphides show a distinct upward and inward zonation: pyrite g chalcopyrite-pyrite g chalcopyrite exsolution lamellae in brown bornite g purple bornite-chalcocite symplectites g digenite lamellae in chalcocite.
15
BHP | Operational review for the quarter ended 30 September 2026
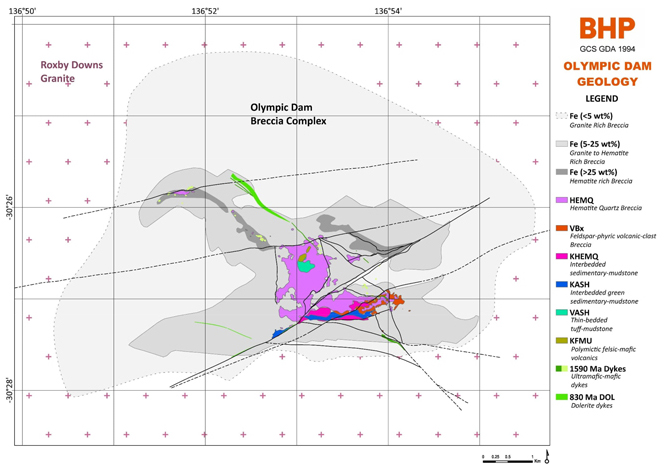
Figure 3. Simplified geological plan of the Olympic Dam deposit, approximately 350 m below surface.
16
BHP | Operational review for the quarter ended 30 September 2026
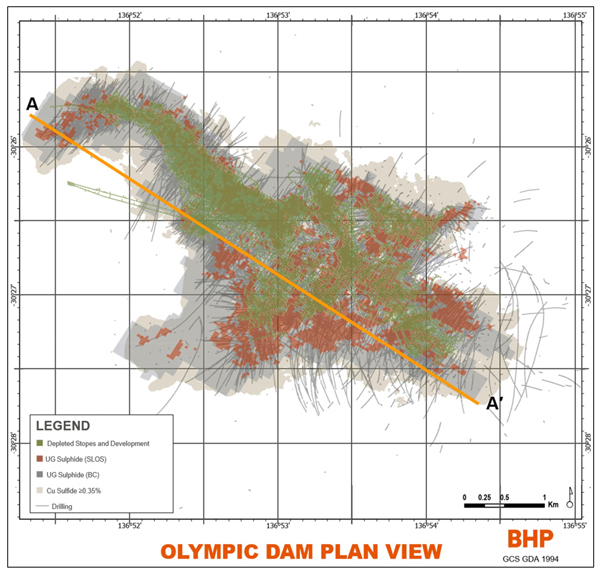
Figure 4. Plan view of the Olympic Dam deposit, showing the spatial relationship between a 0.35% Cu envelope, the outlines of mineral resource block cave and sublevel stoping. Mined stope, development and drilling provided for context.
17
BHP | Operational review for the quarter ended 30 September 2026
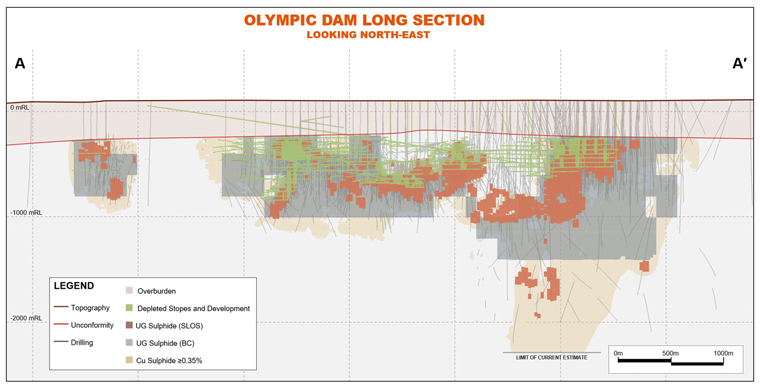
Figure 5. Long section through the Olympic Dam deposit along A – A’ (Figure 4) looking NE. The ~500 m thick projection shows the spatial relationship between a 0.35% Cu envelope, the outlines of mineral resource block cave and sublevel stoping. Mined stope, development and drilling provided for context
18
BHP | Operational review for the quarter ended 30 September 2026
4 Data acquisition
4.1 Drilling and sampling
Drilling comprises oriented and unoriented diamond drilling from surface and underground locations. The drilling includes parent holes and, where additional trajectories are required, wedge holes. A parent hole is the primary drill hole; a wedge hole is a subsidiary or “child” hole initiated from a parent hole at depth, allowing several trajectories to be drilled from a single parent-hole collar. Drill spacing varies across the deposit from approximately 20 m to >300 m, and drilling is generally oriented perpendicular to the interpreted orebody geometry.
Surface drilling comprised parent holes and, where required, wedge holes drilled from parent holes. Surface parent holes were collared in PQ3 diameter (83 mm) through the overburden and continued in HQ3 (61.1 mm) or HQ (63.5 mm) core. Wedge holes were generally drilled in NQ2 diameter (50.6 mm). Navigational drilling was used in selected surface and underground programs to support trajectory control, including parent-hole and wedge-hole drilling. Downhole survey methods and quality control are described in Section 4.3 Surveys.
Longer underground parent holes were collared in HQ diameter (63.5 mm) to approximately 500 m, continued in NQ2 diameter (50.6 mm) to approximately 1,700 m, and completed in BQ diameter (36.5 mm) where required. Underground infill and grade-control holes were drilled in BQ diameter (36.5 mm) and were generally not oriented. Longer holes were oriented using the REFLEX ACT III tool; at the end of each run, the drillers marked the low side of the core, which was then used as the reference for marking the core and recording structural measurements. Grade-control holes were generally not oriented and were therefore not used for oriented structural measurements.
The drilling data and distribution are considered sufficient to support interpretation of geological and grade continuity for the declared Mineral Resource for an underground bulk-mining scenario and the existing Mineral Resource declaration for the selective-mining method. The geology is supported by ongoing underground mapping and mining. Drilling orientations were selected to test the interpreted mineralisation and structures, and the scale and geometry of the mineralised system in relation to the drilling orientation is unlikely to have introduced material sampling bias.
Sample recovery was estimated during logging by reconciling the cumulative reconstructed core length with the drilled length for each core run. Estimated recoveries were high, generally exceeding 99%. Fresh core is relatively competent, and the sulphide minerals are generally not friable. There is no clear relationship between sample recovery and grade in Olympic Dam drill core; consequently, no material bias is expected from preferential loss or gain of fine or coarse material.
Drill holes were logged in qualitative detail below the post-mineralised cover. Logging included lithology, rock composition and texture, alteration minerals, sulphide distribution, mineralisation characteristics and geotechnical information for rock-mass qualification. Structural measurements were recorded from oriented core, and core was photographed dry. Geological, geotechnical, structural, sampling and assay data were managed in a SQL server-hosted database. Logging was completed to a standard appropriate for Mineral Resource estimation, mining studies and metallurgical studies.
Diamond core was split using an automatic core saw. One half was submitted for assay and the other half was retained in labelled trays at the Olympic Dam core storage facility. Retention of the half core provides material for geological review and verification sampling, while the generally competent nature of the fresh core and non-friable sulphide mineralisation supports preservation of representative material in storage.
No dedicated twinned holes have been drilled. Wedge drilling, proximal or cross-cutting drilling, close to existing mineralisation shows some short-scale variations in the tenor of mineralisation. However, this close-spaced drilling provides correlation and general support for the geological and grade modelling.
The majority (>91%) of mineralised diamond core was sampled at the standard interval appropriate to the core diameter: predominantly 2 m and 1 m for NQ2 core, and 2.5 m for BQ/BQTK core. These interval lengths were selected to provide representative sample masses of approximately 4-8 kg and are supported by Olympic Dam site-specific sampling testwork and sample nomograms, which demonstrated that the intervals provide an appropriate balance between sample precision and practical sample-preparation requirements for the respective core sizes. Minor (<9%) historical samples were collected at 1 m or 5 m intervals; these data are retained and used subject to the applicable data validation, compositing and estimation controls.
Samples were submitted to an analytical laboratory for final drying, staged crushing to 2 mm, splitting to an approximately 2-3 kg portion and pulverisation to produce a pulp with 90% passing 75 µm. Duplicate samples were collected at each preparation stage where a reduction in sample mass occurred. Bulk dry density was measured on all assayed samples using the water-immersion method on core samples at the Olympic Dam core-processing facilities.
19
BHP | Operational review for the quarter ended 30 September 2026
The mineralisation is readily identifiable from alteration, brecciated textures and the presence of sulphides, and is relatively pervasive through the broader mineralised zones. Sample sizes and the sampling intervals are therefore considered appropriate for the style of mineralisation. Sampling, assay and quality-control methodologies have been established over several decades and are applied consistently across the relevant drilling methods.
4.2 Surveys
All surface drill hole collar locations (historic and recent) have been surveyed with Leica GS16 Rover and transferred to Olympic Dam’s acQuire database. Underground drill hole collar locations have been surveyed using Leica TS16 Total Station, or TS15 / TS14 prior to 2006. All drilling survey methods are considered appropriate for the estimation and mining of Olympic Dam.
Downhole surveying of surface diamond drilling was carried out at 18 m intervals using a REFLEX GYRO SPRINT-IQ™ tool using GYRO North Seeking (NS) single-shot mode. At the completion of each hole a continuous survey was taken from the collar to end of hole for comparison and quality control. Downhole surveying of underground diamond drilling was undertaken using REFLEX magnetic camera tools.
BHP applies robust quality assurance and quality control (QA/QC) standards and procedures to collar and downhole-survey data. Collar and downhole surveys are managed in the acQuire database through controlled imports, validation checks and review of survey type, grid and azimuth; downhole surveys are also assessed for compliance with the planned drillhole orientation. Validated, appropriately ranked survey data are exported for use in resource modelling, and sample locations are therefore considered suitable for Mineral Resource estimation.
The topography at Olympic Dam is relatively flat, and along with any mining excavations, has been surveyed by airborne LiDAR. The region has minimal vegetation and cover. Surface topographic model is considered appropriate for use in the resource model and mining of Olympic Dam.
4.3 Sample security
Core trays are transported by BHP contractors from the drill rigs to the core processing facility at Olympic Dam, Roxby Downs. Samples in calico bags are transported from Olympic Dam via road on trucks to the external laboratory Intertek, Adelaide, South Australia. Calico bag numbers are automatically generated. Intertek is informed of the sample number ranges for each pending shipment, and these are recorded in Intertek’s management system. Intertek use these to create barcode labels for geochemical bags used for storing the pulverised samples. On sample receipt, Intertek manually checks the submitted sample list against all samples in the shipment. Once the samples are pulverised, all further steps are tracked using the barcodes. BHP is informed of any discrepancies.
BHP has internal governance and standards related to sample security and data management. BHP undertakes routine verification of these practices.
4.4 Quality of assay data and laboratory tests
Samples were submitted to Intertek Group plc, Adelaide, and analysed using either the routine Olympic Dam multi-element suite or the expanded Olympic Dam multi-element suite, as detailed below. Intertek has ISO/IEC 17025 laboratory accreditation.
The routine suite includes Cu, Ag, Co, Ni, Pb, Zn (3-acid digest, measured via ICP-OES) and Li-borate fusion measured via ICP-OES/MS (Al, As, Ba, Bi, Ca, Ce, Cr, Fe, K, La, Mg, Mn, Mo, Na, P, Sb, Sc, Si, Sr, Ti, U, V, Y, Zr). The expanded suite includes 4-acid digest measured via ICP-OES/MS (Cu, Ni, Pb, Zn, Ag, As, Bi, Cd, Co, Ge, In, Li, Re, Se, Te, Tl) and Li-borate fusion measured via ICP-OES/MS (Al, As, Ba, Be, Bi, Ca, Ce, Cr, Cs, Dy, Er, Eu, Fe, Ga, Gd, Hf, Ho, K, La, Lu, Mg, Mn, Mo, Na, Nb, Nd, P, Pr, Rb, Sb, Sc, Si, Sm, Sn, Sr, Ta, Tb, Th, Ti, Tm, U, V, W, Y, Yb, Zr) and loss-on-ignition. All samples were assayed for Au via 25-g fire assay with ICP-OES finish, and C and S via induction furnace combustion, measured by infrared analyser.
Comparative analysis between the 4- and 3-acid digest methods demonstrates equal accuracy and precision within the Olympic Dam mineral system. The 4-acid digest was used to expand the geochemical suite of elements when initially characterising new parts of the deposit.
BHP maintains robust QA/QC standards and procedures for sampling and assay quality. All routine assay QA/QC samples were analysed by Intertek Adelaide, the external primary laboratory, including half-core field duplicates, coarse and pulp duplicates; Intertek also inserted matrix-matched certified reference materials and blanks at defined rates.
Quality-control samples comprised pulp duplicates at 3%, half-core field duplicates at 1% and Boyd crusher/coarse duplicates at 1%, equivalent to duplicates at a minimum rate of 1:20. Analytical blanks, including BHP supplied blanks and additional laboratory blanks, were inserted at a minimum rate of 1:50. Intertek manages and inserts both blank types, and BHP reviews performance internally and with Intertek on at least a monthly basis. Certified reference materials were inserted at a minimum rate of 1:25, with actual rates varying by analytical method.
20
BHP | Operational review for the quarter ended 30 September 2026
Quality control results were reviewed when received and all results were within acceptable accuracy and precision limits.
BHP has robust standards and procedures relating to data transfers (from laboratory to Olympic Dam’s acQuire database, and from database to user), with strictly monitored permission controls relating to reviewers, approvers and users of exported data. Data was electronically uploaded to Olympic Dam’s acQuire database as received from the external laboratory. All drill hole data was managed internally via a SQL server-hosted database with strict validation rules. Adjustments to the received assay data included; copper values converted from parts per million (ppm) to percent (%), and values that returned below the detection limit were assigned a value equal to half of the applicable detection limit: 0.001% and 0.0025% for Cu (3- and 4-acid digests, respectively), 0.5 ppm and 0.025 ppm for Ag (3- and 4-acid digests, respectively), 0.0025 ppm for Au, and 0.25 ppm for U3O8.
A full pulp library, as well as all unsampled reference half core, is retained at the Olympic Dam mine site. These samples are available for verification sampling, if required, due to stable storage in a low humidity desert environment. This is supplemented by core photography of all drilling.
Dr Francis Pitard reviewed Olympic Dam processing facilities, sampling stations and Intertek Laboratory in 2023 with no material observations. BHP routinely reviews standards, procedures and results from external laboratories. No issues have been noted from any BHP review.
4.5 Database management and security
Geological and geotechnical logging are collected via company digital logging tablets and loaded to Olympic Dam’s acQuire geological database. Geologists request sampling intervals through customised acQuire user interfaces. Entry of assay data was through the direct loading of laboratory assay files into the acQuire geological database.
Data validation steps included, but were not limited to the following:
| • | QAQC vetting of data by Intertek laboratory prior to transmission to BHP, followed by further QAQC vetting by BHP prior to acceptance into Olympic Dam’s acQuire database. |
| • | Additional validation through constraints and libraries set in the database by the Database Manager (e.g. overlapping/missing intervals, intervals exceeding maximum depth, valid geology codes, missing assays, prioritised assay protocol). |
| • | Post data-entry validation included secondary system checks and visualisation in 3D software to check for collar, survey or assay import errors. |
4.6 Geophysical data
2D and pseudo 3D seismic data acquisition was undertaken in July 2022. In June-August 2023 BHP acquired 3D seismic data. 3D seismic data is used to inform known deposit scale structural continuity beyond drilling data.
4.7 Site visits
The Competent Person last visited the Olympic Dam mine in April 2026. The site visit included a review of drilling practices, drilling results and geology, and sampling and logging practices. While at the core processing site, checks included validation of sampling, density data collection, and sample and pulp storage.
5 Mineral Resource estimation
The first-time reporting of the underground block cave Mineral Resource at Olympic Dam is presented in Table 1.
The Olympic Dam Mineral Resource is based on:
| • | 17,557 diamond drill holes (surface and underground drilling) comprising a total of 4,660,620 m of drilling. Of this, 4,067,581 m of the drilling has been sampled. A total of 2,613,301 m of the sampled drilling occurs within copper-sulphide domains. |
| • | Sampling was predominantly 1 m or 2.5 m, together accounting for more than 85% of all samples. |
| • | Nominal drill hole spacing ranges from 20 m to >300 m. |
The Olympic Dam mineralised deposit is approximately six kilometres long and three kilometres wide and typically extends to depths of 900 m, and locally beyond 2,000 m beneath the surface. The mineralisation at Olympic Dam is open at depth in local areas.
21
BHP | Operational review for the quarter ended 30 September 2026
Deterministic geological models (wireframes) of the sulphide species are built in Leapfrog modelling software, using a combination of implicit geological modelling combined with local updates driven by geological sectional interpretation. Extensive peer reviews of the geological models are undertaken prior to use in resource estimation.
The confidence of the geological interpretation of the Olympic Dam mineral deposit is supported by a long history of diamond drilling, geological logging, assay results, underground mapping, and reconciliation of mined material and metal production. Confidence in the mineralised model is sufficient in areas declared as Mineral Resource, where mineralisation orientations are adequately constrained by data spacing and supported by lithological, alteration and structural modelling. Areas outside the declared Mineral Resource generally have lower confidence due to wider drill spacing, reduced geological confidence, or insufficient demonstrated mineralisation continuity at a scale relevant to potential underground mining methods, including both bulk and selective mining scenarios. Future drilling and studies may refine these interpretations.
The Mineral Resource estimation process included:
| • | Raw assay data composited to 5 m lengths, due to consideration of sampling, mineralisation style and mining method choices, with the relevant domains flagged after compositing. |
| • | Statistical analysis of the composites within key mineralisation domains. |
| • | Variography modelling on mineralisation, sulphide and orientation domains. |
| • | Identification of outliers and application of high yield thresholds to the composites, determined by geostatistical domain analysis and calculated using a metal-at-risk approach. |
| • | For the mineralised domains being reported, estimation of grade and density via either a combination of multiple-indicator kriging with ordinary kriging (MIK-OK) or ordinary kriging (OK) methods within estimation domains constrained by mineralisation through sulphide domains and orientation domains. |
Estimation was undertaken using Vulcan mining software (version 2023.4). Drill hole information is exported from the acQuire database as ASCII format text files and imported into a Vulcan format drill hole dataset. No top-cutting is applied; extreme or outlier values are instead managed using the high yield thresholds described above, which are customised to each stope area domain.
The block model uses estimation supports approximate to drilling density and resource confidence. Measured blocks are estimated at 5 m X by 10 m Y by 5 m Z support, while Indicated and Inferred blocks are estimated at 30 m X by 30 m Y by 15 m Z support. The model is sub celled to a minimum of 2.5 m in each dimension to represent geological domain boundaries accurately.
The classified elements reported in the Mineral Resource are Cu, U3O8, Au and Ag. All four are estimated using the same MIK-OK methodology and the same variography approach described below, with the exception that Au and Ag are subject to an additional Indicator Kriging (IK) domaining step to account for the portion of Au and Ag mineralisation not contained within the sulphide domains. Dry bulk density is also estimated using this approach (see Section 5.5 Moisture and density). As Cu is the main economic element at Olympic Dam and MIK-OK is the predominant estimation method applied, the following discussion of variography modelling is framed in terms of Cu.
The MIK-OK methodology uses two estimation techniques: MIK and OK. The intent of the MIK technique is to divide the grade distribution into 20 domains (classes) using 19 strategic cut-offs. The spatial variability of grade within these 20 domains is modelled using three indicator variograms. The indicator cut-offs are calculated based on a mixture of metal abundance in each class, the number of sample composites within each class, and the overall shape of the grade distribution. Typically, the three cut-offs occur at 50%, 30% and 20%, respectively, of the available sample composites in the distribution, resulting in apportionment of the distribution into low, medium and high-grade variography components.
The OK component of the MIK-OK method uses the samples flagged against the MIK estimate to derive the final block grade. The spatial variability of the flagged samples is modelled using two variograms, which are based on a 50/50 split of the 20 MIK classes described above.
The resource estimation process has well established procedures, including peer reviews, that govern geological interpretation, resource estimation and reporting of Mineral Resources. Documentation is stored electronically in a secure centralised location. These documents contain information on deposit geology, geometry, detailed geological and geostatistical modelling, data preparation including compositing, and classification parameters.
The classified elements reported in deeper domains (known as Olympic Dam Deeps), which run along the base of the deposit, are estimated using OK.
A large number of other unclassified elements are estimated in various ways for use in assessment of economic elements, gangue elements, and gangue minerals that may impact processing.
22
BHP | Operational review for the quarter ended 30 September 2026
Validation of the Mineral Resource estimate has been conducted in several ways, including but not limited to, visual drill hole section and plan data comparison with the block model and various statistical and swath plot comparisons by domain and element.
Olympic Dam has a long history of mining and processing and reconciliation with production data provides confidence in Resource determination.
5.1 Cut-off parameters
A cut-off grade was chosen to reflect reasonable prospects for economic extraction assuming a bulk underground mining method such as block caving. For the block cave Mineral Resource, this was a cut-off greater than or equal to 0.35% Cu for any selective mining unit (see Mining Factors), which was based on internal benchmarking studies combined with potential economic modelling. This cut-off was used to filter potentially economic blocks from potentially sub-economic blocks, where any material within the retained selective mining unit (SMU) was deemed to have reasonable prospects of eventual economic extraction. As such, zero grade material (in-situ waste material or current or assumed future sub-level open stopes backfill) was included as internal dilution to account for the non-selective nature of block caving.
For the UG Sulphide (SLOS), the cutoff grade used was variable between 0.6% Cu and 1% Cu. There has been no change to the SLOS Mineral Resource from that reported in the BHP FY26 Annual Report (www.bhp.com).
5.2 Mining factors
The total Olympic Dam Mineral Resource assumes both selective SLOS method and a bulk underground mining method such as block caving. The UG Sulphide (SLOS) and UG Sulphide Block Cave (BC) Mineral Resources together account for the majority of the shallower mineralisation. The remaining mineralisation is insufficient to warrant ongoing separate reporting of an Open Cut (OC) Mineral Resource and has been removed.
It is assumed that the SLOS Mineral Resource would be extracted prior to block caving (with zero grade backfill material replacing mineralisation). Future mining studies are required and may determine that some areas of the deposit are more economically amenable to block caving without extraction of the selective SLOS Mineral Resource component, in which case, some of the SLOS Mineral Resource may convert to block cave Mineral Resource in future.
A maximum depth threshold of -1,500 m from surface level (~-1400 mRL) for block caving was applied to the BC Mineral Resource. This threshold was applied based on benchmarking of deposits of similar style and tenor to account for modifying factors, such as economic and geotechnical factors relating to the reasonable prospects for economic extraction of deep block cave mining. Beyond this depth there are uncertainties on management of geotechnical conditions, heat and ventilation. Future mining studies may refine these assumptions and considerations. No depth constraint exists for reporting of the SLOS Mineral Resource.
For the block caving Smallest Mining Unit (SMU) and potential feasibility, minimum mining widths and heights were considered. This included an assessment of grade continuity, relative to potential SMU sizes, to quantitatively demonstrate the degree of spatial consistency in mineral grade distribution. The assessment utilised a model regularised to 100 m X by 100 m Y by 200 m Z, where SMU selection required a minimum of three connected blocks in the XY plane, all of which needed to be above the nominal economic cutoff. This criterion was informed by technical studies, internal analysis, and consultation with mining engineers and caving specialists.
The presence of current or future backfill (such as rockfill, concrete aggregate fill or paste fill) in any future cave design could present a risk of mud rush (wet or dry), poor cave propagation, breakages or particle comminution. This material may act like other in-situ fine geological units (e.g. overburden) or may have variable properties dependent on backfill formulation. Backfill material could also act differently under varied seismic or stress conditions. The Competent Person assumes that prior to any future mining, sufficient mining controls relating to managing mud rush risks, geotechnical risks, grade variability (of economic and any potential deleterious elements) would be established to manage and maintain safe working and extraction practices.
There is no assumption related to potential concurrent caving, cave induced seismicity or seismic interaction, or distance buffers required for concurrent SLOS mining. The Competent Person assumes that any future caving would have optimisation on spatial or temporal mining sequences, with controls established prior to, during, or post-extraction of caved areas.
The Competent Person assumes that block caving, or other bulk underground mining methods, could occur in the presence of backfill material. No assumption has been made regarding the impact of non-homogeneous cave flow on the distribution or forecasting of economic or deleterious elements or materials. Prior to any consideration of conversion to Ore Reserves, future studies are required to understand practical constraints, or absolute limits, of either geotechnical, metallurgical, or other modifying factors. Due to the uncertainty of caving where there might be a significant portion of backfill, a nominal limit of ≥50% backfill, from current or future SLOS mining, is used to constrain resource classification to Inferred.
23
BHP | Operational review for the quarter ended 30 September 2026
It is expected that future studies and additional information will continue to refine the Mineral Resource as it relates to modifying factors.
There is no assumption that all or any part of the block cave Mineral Resource would convert to Ore Reserves with further mining studies required.
5.3 Metallurgical factors
The declared Mineral Resource reports on a 100% basis and does not account for metallurgical recovery. No assumptions have been made regarding recovery of by-products other than those reported, and no deleterious elements have been factored into the reported Mineral Resource.
The declaration of Mineral Resource assumes that any future caving material that include backfill material (such as rockfill, concrete aggregate fill, paste fill) would be supported by suitable processing studies and blending strategies.
The block cave mineral resource assumes metallurgical recoveries similar to current SLOS recoveries. Future studies are required prior to any conversion to Ore Reserve.
5.4 Environmental factors
The Olympic Dam mine is currently in operation. It is assumed that there would be sufficient data and studies on any impacts of block caving in terms of surface disturbance, and appropriate waste, water, material disposal and management options, prior to commencement of a new mining method. It also assumes there are reasonable prospects of obtaining all necessary permits and approvals prior to commencement of a new mining method.
5.5 Moisture and density
Tonnages are estimated on a dry basis using dry bulk density data collected for every sampled interval of drill holes and domained in accordance with the copper mineralisation.
Bulk density measurements were collected on all assayed samples using the water immersion method from core samples at the Olympic Dam core processing facilities. The majority of fresh Olympic Dam core has very low porosity and negligible moisture content; therefore, no moisture correction is applied. The estimation of density is performed using an approach similar to that used for Cu (MIK-OK or OK).
6 Mineral Resource statement
6.1 Classification
A range of criteria was considered in determining the block cave Mineral Resource classification, including:
| • | Drill hole and data density (i.e. informing samples). |
| • | Sample and assay confidence. |
| • | Geological interpretation confidence and, similarly, geological continuity. |
| • | Grade continuity within mineralisation. |
| • | Estimation performance through validation. |
| • | Reasonable prospects for eventual economic extraction. |
| • | Mining method with appropriate modifying factors. |
Comparison to the SLOS Mineral Resource is provided for context where appropriate. There has been no change to the SLOS Mineral Resource from that reported in the BHP FY26 Annual Report (www.bhp.com).
Determination of the classification category relating to geological confidence was undertaken using geological confidence shells (wireframes). These shells were created as follows:
| • | Regular grids, at spacings corresponding to desired confidence, were created using RMSP software (Python mining software). Grid spacings were increased according to confidence levels. |
| • | At each grid point, a search was conducted using radii which correspond to twice the grid spacing to count the number of drill holes within that volume. Doubling the grid spacing ensures that the search volume around each grid centroid covers the entire area of influence for that cell and its immediate neighbours. |
| • | Boundaries were generated where the drill hole density transitions between classification thresholds, creating 3D shells which reflect increasing classification confidence. These shells were manually calibrated in Leapfrog Geo (2023.3) with the current drilling database to resolve any artefacts and ensure that drilling confidence levels matched expectations. The following table provides a summary of parameters used in creating geological confidence shells (Table 3) and corresponding nominal drill spacings. |
24
BHP | Operational review for the quarter ended 30 September 2026
Table 3. Summary of spacing requirements for geological confidence for the Olympic Dam block cave classification
|
Block cave Resource Classification |
Sample drill hole search radius (m) |
Grid cell size (m) |
Required drill holes |
Nominal spacing (m) | ||||
| Measured |
60 m | 30 | 4 | <80 m | ||||
| Indicated |
120 m | 60 | 3 | 80 m to 180 m | ||||
| Inferred |
180 m | 90 | 2 | 180 m to 300 m | ||||
For comparison, the nominal drilling density applied for SLOS Mineral Resource classification are 20 m to 35 m for Measured, 35 m to 70 m for Indicated and 70 m to 200 m for Inferred.
Additional requirements for classifying of the block cave Mineral Resource includes:
| • | Minimum SMU comprising three connected 100 m by 100 m regularised blocks in the XY plane, with a vertical minimum of 200 m in Z. |
| • | Maximum depth of ~1,500 m from surface (~-1400 mRL). |
| • | Grade cut-off greater than or equal to 0.35% Cu for any SMU. |
| • | Classification limit of Inferred for any SMU with ≥50% backfill (current or future). |
The classification is considered appropriate by the Competent Person.
6.2 Relative accuracy / confidence
Olympic Dam has a significant history of SLOS mining and has available production data for comparative purposes which does not highlight any material issues. Relative accuracy and confidence have been assessed through validation of the model outlined above.
The Mineral Resource estimate comprises material categorised as Measured, Indicated or Inferred Mineral Resource. These categories reflect the accuracy and confidence as a global estimate.
Further drilling and mining studies will most likely result in changes to both the Mineral Resource and future mine plans at Olympic Dam.
The Competent Person considers the classification approach and methodologies applied are appropriate for this deposit.
7 Independent review
A review of the Mineral Resource estimate was undertaken by AMC Consultants in 2024. A review of the resource classification regarding block cave was completed by AMC Consultants in 2026.
In the Competent Person’s opinion, there are no outstanding issues arising from these reviews that are not being addressed within the Mineral Resource report’s recommendations or included in assumptions outlined in this document.
8 Future work
Further drilling may be undertaken to test the lateral and depth extent of mineralisation and improve confidence in grade continuity. Further studies are required to assess modifying factors related to the potential application of block caving. These may include mine design and sequencing, geotechnical conditions, backfill interaction, seismicity, heat and ventilation, and associated economic parameters.
9 Estimation and Reporting of Ore Reserves
The mine plan for the Olympic Dam Ore Reserves is underpinned by a Life of Mine plan prepared in accordance with BHP requirements. There has been no change to the Ore Reserves from those reported in the BHP FY26 Annual Report (www.bhp.com). The following information relates to the reporting of SLOS Ore Reserves. The newly reported Block Cave Mineral Resource has not been converted to Ore Reserve. Study work is currently in progress to assess the mining method and underlying factors.
25
BHP | Operational review for the quarter ended 30 September 2026
9.1 Assumptions
9.1.1 Mineral Resources estimate for conversion to Ore Reserves
The relevant resource block model has been used as the basis for mine planning and conversion to Ore Reserves. The reported SLOS Mineral Resources are inclusive of Ore Reserves.
The Ore Reserve converts Measured Mineral Resource to Proved Ore Reserve and Indicated Mineral Resource to Probable Ore Reserve, with the exception of low-grade stockpiles where the Measured Mineral Resource converts to Probable Ore Reserve.
9.1.2 Site visits
The Ore Reserve Competent Person has worked on site for four years and acquired direct operational knowledge of Olympic Dam. There has been continuous involvement with site teams with the most recent site visit undertaken in June 2025 to visit new underground workings and assess Critical controls.
9.1.3 Study status
Olympic Dam has been in continuous production since 1988 and prepares an annual Life of Mine plan that supports the Ore Reserve estimate. The modifying factors underpinning the Ore Reserves have been assessed to an appropriate level of confidence for an operation with a long life of mine. Projects in later stages of the mine plan will continue to be refined through future studies and optimisation. These projects do not materially impact the confidence in the Ore Reserve estimate.
9.1.4 Cut-off parameters
Olympic dam applies a variable cut-off grade strategy that is informed by a study. Ore reserves are estimated at a cut-off grade of 1.0-1.7% Cu for UG Sulphide and ≥ 0.6% Cu for Low grade. UG Sulphide includes ore from stopes and development, while low-grade and waste is the material from development.
Mining block-specific cut-off grades exploit the unique geological properties of each block to produce a relatively consistent ore feed. This seeks to maximise throughput through a series of surface processing stages. This strategy enables high-grade material to be targeted in early years of the mine plan. Lower grade material is then exploited as higher-grade material is depleted.
Price and cost assumptions are used to support a variable cut-off. Operating costs are inclusive of mining, surface processing, general and administration, closure, marketing and royalties.
9.1.5 Mining factors
The mining method selected at Olympic Dam is underground SLOS with cemented aggregate backfill. Paste fill has also been identified as an alternative backfill strategy, with a paste plant currently under execution. The stopes are sequentially extracted and progressively backfilled to control maximum excavation spans and manage stresses in the rock mass.
The conversion of Mineral Resource to Ore Reserve is achieved by creating stope shapes using manual (engineered stopes) and automated techniques (Stope Optimiser tools). These stopes are incorporated into a mine schedule and sequenced considering geotechnical parameters and ventilation constraints, and operating parameters.
Detailed development and stope designs are generated with mine block specific cut-off grades and schedules are prepared considering respective mine block constraints.
The nominal stope mining dimension is 30 m by 30 m in plan, with stope heights varying according to geotechnical parameters and ground conditions. Stope widths range from 15 m to 30 m to accommodate irregular orebody geometries. The development dimensions and profiles vary for different applications but are typically in the ranges of 5 m by 5 m to 7 m by 7 m.
Overbreak (OB) and underbreak (UB) factors that inform dilution and recovery are reviewed annually and updated as necessary. Modifying factors are informed through reconciliation of site performance. They are applied by mine area to reflect localised geotechnical conditions. Typical planned factors are; UB tonnage factor: 5-11%, OB tonnage factor: 9-28%, OB grade factor: 47-77%. The wide range of factors reflects area-specific geotechnical and mining conditions across the operation. The use of these factors enhances the accuracy and confidence of the Ore Reserve estimate.
The mine plan includes a new material handling system with new underground crusher and conveyor to surface, supported by appropriate ventilation raises to deliver production profile.
Inferred Mineral Resources were considered in the Life of Mine schedule but are not included in the Ore Reserve estimate. To assess the impact of Inferred Mineral Resources, revenue attributable to Inferred Resources was removed from the valuation model while all associated costs were retained. The resulting valuation generated a positive NPV, demonstrating that the Ore Reserve remains economically viable without the contribution of Inferred Resources.
26
BHP | Operational review for the quarter ended 30 September 2026
9.1.6 Metallurgical factors
The Olympic Dam metallurgical process is well established and has been in operation since mining commenced in 1988. The integrated processing plant produces copper cathode, uranium oxide, and gold and silver bullion, while removing deleterious elements at various stages of the process.
A comprehensive geometallurgical program tests ore from both existing and new mine areas, with results calibrated against operating plant performance. Hundreds of samples are collected and tested every year based on the mine areas identified in medium and long-term mine plans. These samples are combined into monthly composite samples and assessed using the same characterisation procedures. Metallurgical recovery factors applied in the mine plan are based on this data and planned operating conditions for the plant.
Average metallurgical recoveries applied in the Ore Reserve estimate are 94% for Cu, 65% for U3O8, 71% for Au, and 63% for Ag. Recovery assumptions are based on a combination of operating performance and geometallurgical test work.
9.1.7 Environmental
Environmental performance is managed through a comprehensive Environmental Protection and Management Program (EPMP), approved by both the Commonwealth and South Australian governments. Required under the Roxby Downs (Indenture Ratification) Act 1982 (SA) and associated project approval conditions. The EPMP provides the framework for managing environmental impacts from operations. It is reviewed and approved annually by the South Australian Minister for Energy and Mining, including a reassessment of operational activities, environmental aspects, and associated impacts. All material governmental approvals, licences and permits required for current Ore Reserve extraction are in place or expected to be renewed in the ordinary course of operations. There are no known environmental issues that materially affect extraction of the declared Ore Reserves.
The closure plan is reviewed regularly and updated to reflect changes as the operation has a long life and will be subject to change over the remaining life of the asset. Appropriate uncertainty has been built into the closure cost estimate.
In the current closure plan, Tailings Storage Facility (TSF) and EP (Evaporation Ponds) are planned to be progressively rehabilitated during operations, and redundant infrastructure will be demolished when practicable. Given the underground nature of Olympic Dam, most other major closure activities (e.g., the closure of operational TSF and EP, infrastructure and general land rehabilitation) are scheduled to commence at the end of life. Active closure is planned to take three years, and a 20-year post-closure monitoring and maintenance period is planned.
9.1.8 Social factors
The Roxby Downs (Indenture Ratification) Act 1982 (SA) provides statutory authority for an agreement (Indenture) between BHP and the State of South Australia. Refer to Section 2 Mineral tenement and land tenure for further details.
The Olympic Dam operation has been subject to multiple Environmental Impact Statement (EIS) assessments under three separate South Australian and Commonwealth processes since commencement of operations in 1988. All phases considered expansion of operations over time and support current operations and Ore Reserves.
Olympic Dam also holds a range of statutory approvals, licences, permits, exemptions, registrations, certifications, memberships and leases that enable Olympic Dam operations and are logged in Olympic Dam’s Integrated Management System.
BHP has a suite of policies and procedures in place that ensure appropriate consideration and management of any potential community or human rights impacts of its operations, capital projects and investment decisions (both positive and negative) in line with public commitments set out in BHP’s Human Rights Policy Statement and Indigenous Peoples Policy Statement.
9.1.9 Infrastructure
The Olympic Dam mine has been in production for more than 35 years. Production commenced in the northern portion of the orebody and subsequently expanded south, which underpins a significant part of the Ore Reserves.
The underground mine plan incorporates incremental extension of the truck haulage network to facilitate production from new mine areas. A new material handling system, including conveyors to surface, ore passes, and haulage corridors, is planned to enable material movement from new mine areas.
Underground and surface ventilation raises, supported by refrigeration for deeper mine areas, are incorporated in the mine plan to facilitate access to new mine areas.
Current operations utilise Cemented Aggregate Fill method to backfill stopes. Paste Fill has been selected as an alternative backfill method to support production in existing and future mining areas. Construction of the paste fill plant and associated infrastructure supporting the Ore Reserves is in execution.
27
BHP | Operational review for the quarter ended 30 September 2026
Surface processing facilities are in place and capital allocation for planned processing infrastructure upgrades has been incorporated into the Life of Mine plan.
10 Market and commodity price assumptions
10.1 Cost factors
Capital costs for new infrastructure are derived from the Life of Mine plan and informed by relevant historical costs and study work where appropriate. Major capital provisions include significant smelter shutdowns occurring every 6 to 10 years, and planned transition from single stage smelter configuration to twin stage. Capital estimated includes progressive rehabilitation activities and final closure costs consistent with ongoing closure planning. Sustaining capital estimates are based on extensive study work and long-term asset integrity programs targeting reliability of operations.
Operating cost estimates are derived from first principle models for mining, processing and General and Administrative costs informed by historical operating performance, budget forecasts and life of mine planning assumptions.
Transport, marketing and other off-site costs are incorporated in cost estimations. As Olympic Dam produces final metal products on site, all treatment costs and refining costs are based on current performance. Government royalties and applicable taxes have been incorporated into the economic evaluation.
10.2 Revenue factors
Revenue is calculated by applying forecast commodity prices and foreign exchange rates to the planned production in period, with production estimates reflecting the applicable metallurgical recovery assumptions. Forecast commodity prices (copper, uranium, gold and silver) and foreign exchange rates are determined in accordance with BHP protocols and are used as inputs to the valuation model.
Ore Reserves are based on the Life of Mine plan and use latest BHP forecast commodity prices forecasts for revenue projection.
The commodity price protocols and the process that establishes them is commercially sensitive and is not disclosed in this report.
10.3 Market assessment
Olympic Dam is a polymetallic deposit that produces copper cathode, uranium oxide concentrate, and gold and silver bullion. These products are sold to various domestic and international markets.
Future copper demand growth is expected to be underpinned by development in emerging economies as they electrify, industrialise, and urbanise. The global energy transition provides further upside, as copper is widely used in electric vehicles and renewable energy infrastructure.
Currently, the copper market is broadly balanced; however, demand is expected to exceed committed supply in the coming years, requiring new supply to come to market.
Nuclear power generation, and associated uranium demand, are expected to grow in the future, requiring new sources of supply.
Unlike most industrial metals, gold and silver prices are influenced not only by physical supply-demand balances but also by investment flows, monetary conditions, and safe-haven demand.
10.4 Economics
A valuation model has been developed for the purposes of supporting the Ore Reserves. All revenue and economic assumptions are as described within other sections of this table. Calculation of the net present value (NPV) was conducted using a discount rate, estimated inflation and tax rates adhering to BHP protocols.
Sensitivity analysis was conducted on the mine plan using a range of prices, exchange rates and costs, demonstrating a positive NPV across all sensitivities.
Inferred Mineral Resources were allowed to contribute to the mine schedule but are not included in the Ore Reserves estimate. Sensitivity analysis was also conducted on the mine plan by removing revenue attributable to Inferred Resources while retaining all associated costs. The analysis demonstrates that Inferred Resources make a minor contribution and that the NPV remains positive following its removal.
28
BHP | Operational review for the quarter ended 30 September 2026
11 Ore Reserve statement
There have been no changes to Ore Reserves since those reported in BHP’s FY26 Annual Report. The Ore Reserve estimate is supported by a Life of Mine plan, operating performance, modifying factors and assumptions previously disclosed.
11.1 Classification
The Ore Reserve classification is supported by the SLOS Mineral Resource classification. Measured Mineral Resources are converted to Proved Ore Reserves and Indicated Mineral Resources are converted to Probable Ore Reserves, except for low-grade development material, where Measured Mineral Resources are converted to Probable Ore Reserves. The low-grade material mined at a cut-off grade of 0.6% Cu will be stockpiled to process towards end of life of mine. Other than low-grade stockpiles, no Probable Ore Reserves have been derived from Measured Mineral Resources.
11.2 Discussion of relative accuracy/confidence
The relative accuracy and therefore confidence in the Ore Reserves estimate is deemed appropriate for its intended purpose of global Ore Reserves reporting. The application of modifying factors affecting the accuracy and confidence as stated in Section 9 Estimation and reporting of Ore Reserves are taken into consideration during classification of the model and are therefore addressed by the Competent Person in the attributed Reserve classification.
Confidence in the Ore Reserve estimate is supported by ongoing production reconciliation, operational performance and validation of modifying factors through established mining operations. In the Competent Person’s opinion, there is appropriate confidence in the modifying factors to support the Olympic Dam Ore Reserve estimate.
11.3 Ore Reserves declared
Table 2 presents the statement of Ore Reserves for Olympic Dam and is unchanged from that reported in BHP’s FY26 Annual Report (www.bhp.com).
12 Reconciliation
Confidence in the Ore Reserve is supported through reconciliation against production data. Annual reconciliation results are considered more representative than shorter reporting periods due to timing differences associated with ore movement through stockpiles and processing facilities. Reconciliation performance provides confidence in the modifying factors and assumptions applied in the Ore Reserve estimate.
13 Independent review
AMC Consultants conducted independent reviews of the 2019 and 2020 Ore Reserve processes and estimates, which informed the FY2021 Ore Reserves. All actions were closed in 2021, with no further findings for Olympic Dam. Since completion of external reviews, there have been no material changes to the ore reserve estimates that would warranted external independent review. BHP’s internal annual assurance program further ensures that any significant risks, assumptions and controls relevant to Ore Reserve estimate are adequately managed.
14 References
Joint Ore Reserves Committee of The Australasian Institute of Mining and Metallurgy, Australian Institute of Geoscientists and Minerals Council of Australia (JORC), 2012. Australasian Code for Reporting of Exploration Results, Mineral Resources and Ore Reserves.
BHP Quarterly Activities Report, 18th Jan 2024 “Operational review for the half year ended 31 December 2023”. Appendix 3, Project status update – Olympic Dam “Deeps” (OD Deeps). www.bhp.com
29
BHP | Operational review for the quarter ended 30 September 2026
Variance analysis relates to the relative performance of BHP and/or its operations during the three months ended September 2026 compared with the three months ended September 2025, unless otherwise noted. Production volumes, sales volumes and capital and exploration expenditure from subsidiaries are reported on a 100% basis; production and sales volumes from equity accounted investments and other operations are reported on a proportionate consolidation basis. Numbers presented may not add up precisely to the totals provided due to rounding. Medium term refers to a five-year time horizon, unless otherwise noted.
The following abbreviations may have been used throughout this release: silver (Ag); gold (Au); billion dollars (B/bn); billion troy ounces (Boz); billion tonnes (Bt); cost and freight (CFR); cost, insurance and freight (CIF); carbon dioxide equivalent (CO2-e); compound annual growth rate (CAGR); copper (Cu); copper equivalent (CuEq); dry metric tonne (dmt); final investment decision (FID); free on board (FOB); foreign exchange (FX); greenhouse gas (GHG); grams per tonne (g/t); high-potential injury (HPI); joint venture (JV); kilograms per tonne (kg/t); kilometre (km); megalitres/million litres (ML); Memorandum of Understanding (MOU); million troy ounces (Moz); million ounces per annum (Mozpa); million pounds (Mlb); million tonnes (Mt); million tonnes per annum (Mtpa); ounces (oz); pounds (lb); million dollars (M); thousand ounces (koz); thousand ounces per annum (kozpa); thousand tonnes (kt); thousand tonnes per annum (ktpa); thousand tonnes per day (ktpd); tonnes (t); total recordable injury frequency (TRIF); uranium (U); wet metric tonnes (wmt) and year-to-date (YTD).
In this release, the terms ‘BHP’, the ‘Group’, ‘BHP Group’, ‘we’, ‘us’, ‘our’ and ‘ourselves’ are used to refer to BHP Group Limited and, except where the context otherwise requires, our subsidiaries. Refer to Note 28 – Subsidiaries of the Financial Statements in the BHP Annual Report 2026 for a list of our significant subsidiaries. Those terms do not include non-operated assets. Notwithstanding that this release may include production, financial and other information from non-operated assets, non-operated assets are not included in the BHP Group and, as a result, statements regarding our operations, assets and values apply only to our operated assets unless stated otherwise. Our non-operated assets include Antamina, Resolution, Samarco and Vicuña. BHP Group cautions against undue reliance on any forward-looking statement or guidance in this release. These forward-looking statements are based on information available as at the date of this release and are not guarantees or predictions of future performance and involve known and unknown risks, uncertainties and other factors, many of which are beyond our control and which may cause actual results to differ materially from those expressed in the statements contained in this release.
Further information on BHP can be found at bhp.com
Authorised for lodgement by:
Stefanie Wilkinson
Group Company Secretary
| Media Relations | Investor Relations | |||
| Email: media.relations@bhp.com | Email: investor.relations@bhp.com | |||
| Australia and Asia | Australia and Asia | |||
| Gabrielle Notley +61 411 071 715 |
John-Paul Santamaria +61 499 006 018 | |||
| Europe, Middle East and Africa | Europe, Middle East and Africa | |||
| Sinead Keller +44 7816826 169 |
Adam Sanderson +44 7884 735 515 | |||
| Americas | Americas | |||
| Renata Fernandez +56 9 8229 5357 |
Li Hua +1 647 828 9830 | |||
BHP Group Limited ABN 49 004 028 077
LEI WZE1WSENV6JSZFK0JC28
Registered in Australia
Registered Office: Level 18, 171 Collins Street
Melbourne Victoria 3000 Australia
Tel +61 1300 55 4757 Fax +61 3 9609 3015
BHP Group is headquartered in Australia
Follow us on social media

30
SIGNATURES
Pursuant to the requirements of the Securities Exchange Act of 1934, the registrant has duly caused this report to be signed on its behalf by the undersigned, thereunto duly authorized.
| BHP Group Limited | ||||||
| Date: October 20, 2026 | By: |
/s/ Stefanie Wilkinson | ||||
| Name: |
Stefanie Wilkinson | |||||
| Title: |
Group General Counsel and Group Company Secretary | |||||