UNITED STATES
SECURITIES AND EXCHANGE COMMISSION
WASHINGTON, D.C. 20549
FORM 6-K
REPORT OF FOREIGN ISSUER
PURSUANT TO RULE 13a-16 OR 15b-16 OF
THE SECURITIES EXCHANGE ACT OF 1934
September 2026
Date of Report (Date of Earliest Event Reported)
Embotelladora Andina S.A.
(Exact name of registrant as specified in its charter)
Andina Bottling Company, Inc.
(Translation of Registrant´s name into English)
Avda. Miraflores 9153
Renca
Santiago, Chile
(Address of principal executive office)
Indicate by check mark whether the registrant files or will file annual reports under cover Form 20-F or Form 40-F.
Form 20-F x Form 40-F ¨
Indicate by check mark if the Registrant is submitting this Form 6-K in paper as permitted by Regulation S-T Rule 101(b)(1):
Yes ¨ No x
Indicate by check mark if the Registrant is submitting this Form 6-K in paper as permitted by Regulation S-T Rule 101(b)(7):
Yes ¨ No x
Indicate by check mark whether the registrant by furnishing the information contained in this Form 6-K is also thereby furnishing the information to the Commission pursuant to Rule 12g3-2(b) under the Securities Exchange Act of 1934
Yes ¨ No x

EXECUTIVE SUMMARY
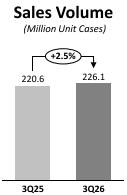
 | The quarter closed with a consolidated Sales Volume of 226.1 million unit cases*, increasing 2.5% compared to the same quarter of the previous year. Transactions* totaled 1,236.9 million for the quarter, representing a 2.0% increase compared to the same quarter of the previous year. Accumulated consolidated Sales Volume reached 691.4 million unit cases, representing a 1.8% increase compared to the previous year. Accumulated transactions totaled 3,785.7 million, representing a 2.2% increase. |
| The Company’s reported figures are as follows: |
| · | Consolidated Net Sales reached CLP 896,609 million for the quarter, an increase of 12.0% compared to the same quarter of the previous year. Accumulated consolidated Net Sales reached CLP 2,675,065 million, representing an increase of 11.8% compared to the previous year. |
| · | Consolidated Operating Income* reached CLP 100,490 million for the quarter, representing a 9.3% increase compared to the same quarter of the previous year. Accumulated consolidated Operating Income was CLP 346,640 million, a 15.5% increase compared to the previous year. |
| · | Consolidated Adjusted EBITDA* increased by 12.1% compared to the same quarter of the previous year, reaching CLP 149,289 million for the quarter. Adjusted EBITDA margin reached 16.7%, an expansion of 2 basis points compared to the same quarter of the previous year. Consolidated accumulated Adjusted EBITDA was CLP 488,932 million, representing a 16.9% increase compared to the previous year. Adjusted EBITDA margin for the period reached 18.3%, an expansion of 80 basis points compared to the previous year. |
| · | Net Income attributable to the owners of the parent for the quarter reached CLP 61,482 million, representing an increase of 7.5% compared to the same quarter of the previous year. Accumulated Net Income attributable to the owners of the parent was CLP 197,164 million, representing an increase of 17.1% compared to the previous year. |
SUMMARY OF RESULTS THIRD QUARTER 2026 AND ACCUMULATED AS OF THE THIRD QUARTER
| (Figures in million CLP) | 3Q25 | 3Q26 | Var % | 9M25 | 9M26 | Var % | ||||||||||||||||||
| Sales Volume (Million Unit Cases) | 220.6 | 226.1 | 2.5 | % | 679.2 | 691.4 | 1.8 | % | ||||||||||||||||
| Net Sales | 800,361 | 896,609 | 12.0 | % | 2,393,159 | 2,675,065 | 11.8 | % | ||||||||||||||||
| Operating Income* | 91,929 | 100,490 | 9.3 | % | 300,247 | 346,640 | 15.5 | % | ||||||||||||||||
| Adjusted EBITDA* | 133,130 | 149,289 | 12.1 | % | 418,239 | 488,932 | 16.9 | % | ||||||||||||||||
| Net income attributable to the owners of the parent | 57,178 | 61,482 | 7.5 | % | 168,384 | 197,164 | 17.1 | % | ||||||||||||||||
Comments of the Chief Executive Officer, Mr. Miguel Ángel Peirano
“In the third quarter of the year, we delivered solid financial performance, highlighted by 12.1% growth in Consolidated Adjusted EBITDA, which totaled CLP 149,289 million. This performance was driven by Adjusted EBITDA growth in local currency across Brazil, Chile, and Paraguay, as well as the impact of currency translation. On a currency-neutral* basis, Consolidated Adjusted EBITDA grew by 3.9%.
The strong performance of our operations was driven by volume growth of 2.5%—led by Brazil, with growth of 7.7%—as well as strict cost control, despite a challenging environment driven by rising oil prices, which negatively impacted our distribution costs and the cost of Pet resin.
During the period, we continued to make progress in modernizing our operational and technological capabilities with the successful implementation of the Regional SAP S/4HANA project, one of Andina’s most significant innovation and transformation initiatives in recent years. This new platform strengthens the integration of our processes, improves the availability and quality of information for decision-making, and establishes a solid foundation for delivering sustainable operational efficiencies. It also enables new digital capabilities in B2B, automation, advanced analytics, and artificial intelligence that enhance our agility and long-term competitiveness. This milestone reflects the Company’s commitment to operational excellence and innovation to further strengthen the capabilities that will support growth, productivity, and value creation for our shareholders in the coming years.
Finally, in August, we issued a green bond in the local market for 2.5 million Unidades de Fomento at an interest rate of 2.95% (“yield to maturity”), maturing on September 30, 2030. The spread on this issuance was 65 basis points over the
*The definitions used can be found in the Glossary on page 16 of this document
| COCA-COLA ANDINA | |
| 3Q26 EARNINGS RELEASE | |
| www.koandina.com | |
| - 2 - |
benchmark sovereign rate—the lowest since 2019 for an AA+ corporate issuer—which is a clear indication of market confidence in the Company’s strategy. The proceeds from the offering will be used to refinance or finance new or existing green projects that are eligible under the “Coca-Cola Andina Green Bond Framework / Sustainable Bond Framework.”
BASIS OF PRESENTATION
The figures in the following analysis are expressed in accordance with IFRS, in nominal Chilean pesos, both for consolidated results and for the results of each of our operations. All variations with respect to 2025 are nominal.
Since Argentina has been classified as a hyperinflationary economy, in accordance with IAS 29, translation of figures from local currency to the reporting currency was performed using the closing exchange rate for the translation to Chilean pesos. Local currency figures for both 2026 and 2025 referred to in the Argentina sections are all in September 2026 currency.
Finally, a devaluation of local currencies against the U.S. dollar has a negative impact on our dollarized costs, and a devaluation of local currencies against the Chilean peso has a negative impact on the consolidation of figures.
When we refer to "Argentina", it includes our subsidiaries Embotelladora del Atlántico S.A. and Empaques Argentina S.A. When we refer to "Chile", it includes the operation in Chile of Embotelladora Andina S.A., as well as its subsidiaries VJ S.A., Vital Aguas S.A., Envases Central S.A. and Re-Ciclar S.A.
CONSOLIDATED RESULTS: Third Quarter 2026 vs. Third Quarter 2025
| (Figures in million CLP) | 3Q25 | 3Q26 | Var % | |||||||||
| Net Sales | 800,361 | 896,609 | 12.0 | % | ||||||||
| Operating Income | 91,929 | 100,490 | 9.3 | % | ||||||||
| Adjusted EBITDA | 133,130 | 149,289 | 12.1 | % | ||||||||
| Net income attributable to the owners of the parent | 57,178 | 61,482 | 7.5 | % | ||||||||
During the quarter, consolidated Sales Volume reached 226.1 million unit cases, representing a 2.5% increase compared to the same period in 2025. This growth was driven by volume increases in Brazil and Chile, partially offset by declines in Argentina and Paraguay. The Non-Alcoholic Beverages segment accounted for 95.1% of consolidated Sales Volume and grew by 2.5%, driven by higher volumes in Brazil and Chile, partially offset by declines in Argentina and Paraguay. The Alcoholic Beverages segment accounted for 4.9% of consolidated Sales Volume and grew by 2.2%, supported by volume increases in Brazil, Argentina, and Paraguay, partially offset by a decline in Chile. Transactions totaled 1,236.9 million during the quarter, representing a 2.0% increase compared to the same period of the previous year.
Consolidated Net Sales totaled CLP 896,609 million, an increase of 12.0%, driven by the aforementioned volume growth in Brazil and Chile, higher revenue per unit sold, and the positive impact of currency translation from our operations in Paraguay, Brazil, and Argentina. During the third quarter, 84.2% of the Company’s total net revenue was generated through our digital platforms, an increase of 4.0 percentage points compared to the same period last year. Customer satisfaction, measured by the Net Promoter Score (NPS), reached 59.2%, up 1.6 percentage points year over year. These results reflect the progress of our customer experience initiatives and reinforce our commitment to better meeting our customers’ needs.
Consolidated Cost of Sales increased by 10.8% compared to the same period of the last year, primarily due to (i) higher concentrate costs in Brazil and Paraguay, (ii) higher Pet resin costs, (iii) the impact of currency translation from our subsidiaries in Argentina, Brazil, and Paraguay into the reporting currency, (iv) a shift in the product mix toward products with higher unit costs in Brazil and Paraguay, and (v) the impact of the depreciation of the Argentine peso on our U.S. dollar-denominated costs. These increases were partially offset by (i) lower sugar costs, (ii) lower concentrate costs in Chile, and (iii) the favorable impact of the appreciation of the Brazilian real, the Chilean peso, and the Paraguayan guaraní against the U.S. dollar on our dollar-denominated costs.
Consolidated Distribution Costs and Administrative Expenses increased by 16.1%, primarily driven by (i) higher marketing expenses, (ii) higher distribution costs in Brazil, Chile, and Paraguay, (iii) higher labor costs in Brazil, Chile, and Paraguay, (iv) lower other operating income in Argentina and Brazil, and (v) the impact of translating financial figures from our subsidiaries in Argentina, Brazil, and Paraguay into the reporting currency. These increases were partially offset by lower distribution and labor costs in Argentina.
| COCA-COLA ANDINA | |
| 3Q26 EARNINGS RELEASE | |
| www.koandina.com | |
| - 3 - |
The aforementioned effects resulted in consolidated Operating Income of CLP 100,490 million, an increase of 9.3%. Operating margin was 11.2%.
Consolidated Adjusted EBITDA reached CLP 149,289 million, an increase of 12.1%. Adjusted EBITDA Margin was 16.7%, an expansion of 2 basis points.
Net income attributable to the owners of the parent for the quarter was CLP 61,482 million, an increase of 7.5%, and net margin reached 6.9%, a contraction of 29 basis points.
ARGENTINA: Third Quarter 2026 vs. Third Quarter 2025
| 3Q25 | 3Q26 | % Var. | 3Q25 | 3Q26 | % Var. | |||||||||||||||||||
| (Figures in million CLP) | (Figures in million ARS as of September 2026) | |||||||||||||||||||||||
| Net Sales | 172,802 | 203,184 | 17.6 | % | 328,659 | 316,913 | -3.6 | % | ||||||||||||||||
| Operating Income | 13,900 | 16,630 | 19.6 | % | 26,437 | 25,938 | -1.9 | % | ||||||||||||||||
| Adjusted EBITDA | 25,555 | 30,036 | 17.5 | % | 48,604 | 46,848 | -3.6 | % | ||||||||||||||||
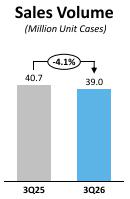
Sales Volume for the quarter decreased by 4.1%, reaching 39.0 million unit cases, driven by declines in the Soft Drinks, Water, Juices and Other Non-Alcoholic Beverages categories, partially offset by growth in the Beer and Other Alcoholic Beverages category. Transactions reached 184.9 million, representing a 5.8% decrease.
Net Sales totaled CLP 203,184 million, an increase of 17.6%. In local currency, they decreased by 3.6%, primarily due to the aforementioned decline in volume, partially offset by an increase in average revenue per unit case sold.
Cost of Sales increased by 16.7%, while in local currency it decreased by 4.3%, which is primarily explained by (i) lower sales volume, (ii) a lower cost of sweeteners, and (iii) a shift in the mix toward products with a lower unit cost. This was partially offset by the devaluation of the Argentine peso, which impacts our dollar-denominated costs and a higher cost of Pet resin.
Distribution Costs and Administrative Expenses increased by 18.5% in the reporting currency, while in local currency they decreased by 2.8%, primarily due to the effect of lower sales volumes on distribution and haulage expenses and lower labor costs. This was partially offset by lower other operating income classified under this item and higher marketing expenses.
The aforementioned effects led to an Operating Income of CLP 16,630 million, an increase of 19.6% compared to the same period last year. Operating Margin was 8.2%. In local currency, Operating Income decreased by 1.9%.
Adjusted EBITDA totaled CLP 30,036 million, an increase of 17.5%. Adjusted EBITDA Margin was 14.8%, a contraction of 1 basis point. Meanwhile, Adjusted EBITDA in local currency decreased by 3.6%.
BRAZIL: Third Quarter 2026 vs. Third Quarter 2025
| 3Q25 | 3Q26 | % Var. | 3Q25 | 3Q26 | % Var. | |||||||||||||||||||
| (Figures in million CLP) | (Figures in million BRL) | |||||||||||||||||||||||
| Net Sales | 241,122 | 283,108 | 17.4 | % | 1,368 | 1,559 | 14.0 | % | ||||||||||||||||
| Operating Income | 38,891 | 40,874 | 5.1 | % | 220 | 225 | 2.2 | % | ||||||||||||||||
| Adjusted EBITDA | 49,393 | 54,244 | 9.8 | % | 280 | 299 | 6.7 | % | ||||||||||||||||
| COCA-COLA ANDINA | |
| 3Q26 EARNINGS RELEASE | |
| www.koandina.com | |
| - 4 - |
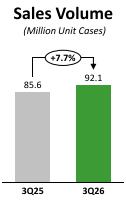
Sales Volume for the quarter reached 92.1 million unit cases, an increase of 7.7%, driven by growth across all categories. The Non-Alcoholic Beverages segment accounted for 98.6% of total sales volume and grew by 7.1%, driven by growth across all categories within the segment. The Alcoholic Beverages segment accounted for 1.4% of total sales volume and grew by 76.1%, driven primarily by growth in the Beer category, partially offset by a decline in the Other Alcoholic Beverages category. Transactions totaled 492.9 million, representing an increase of 8.4%.
Net Sales totaled CLP 283,108 million, an increase of 17.4%. In local currency, Net Sales increased by 14.0%, driven primarily by the aforementioned volume growth and by the increase in average revenue per unit case sold. Net Sales in the Non-Alcoholic Beverages segment increased by 14.0% in local currency, accounting for 97.3% of total sales. Net Sales in the Alcoholic Beverages segment increased by 11.2% in local currency, accounting for 2.7% of total sales.
Cost of Sales increased by 19.0%, while in local currency it increased by 15.5%, primarily due to (i) higher sales volume, (ii) higher concentrate costs, (iii) a shift in the mix toward higher unit cost products, and (iv) higher costs of Pet resin and aluminum. This was partially offset by lower sugar costs, as well as by the positive effect on our dollar-denominated costs resulting from the appreciation of the Brazilian real against the U.S. dollar.
Distribution Costs and Administrative Expenses increased by 21.9% in the reporting currency. In local currency, they increased by 18.3%, which is primarily explained by (i) lower other operating income classified under this item, (ii) higher marketing expenses, (iii) higher distribution expenses, and (iv) higher labor costs.
The aforementioned effects led to an Operating Income of CLP 40,874 million, an increase of 5.1%. Operating Margin was 14.4%. In local currency, Operating Income increased by 2.2%.
Adjusted EBITDA reached CLP 54,244 million, an increase of 9.8% compared to the previous year. Adjusted EBITDA Margin was 19.2%, a contraction of 132 basis points. In local currency, Adjusted EBITDA increased by 6.7%.
CHILE: Third Quarter 2026 vs. Third Quarter 2025
| 3Q25 | 3Q26 | % Var. | ||||||||||
| (Figures in million CLP) | ||||||||||||
| Net Sales | 313,615 | 320,647 | 2.2 | % | ||||||||
| Operating Income | 28,051 | 30,066 | 7.2 | % | ||||||||
| Adjusted EBITDA | 43,248 | 46,668 | 7.9 | % | ||||||||
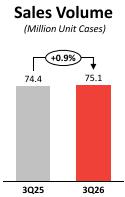
During the quarter, Sales Volume reached 75.1 million unit cases, representing a 0.9% increase, driven by growth in the Soft Drinks and Water categories, partially offset by declines in the Juices and Other Non-Alcoholic Beverages and the Beer and Other Alcoholic Beverages categories. The Non-Alcoholic Beverages segment accounted for 88.1% of total sales volume and grew by 1.8%, driven by growth in the Soft Drinks and Water categories, partially offset by a decline in the Juices and Other Non-Alcoholic Beverages category. The Alcoholic Beverages segment accounted for 11.9% of total sales volume and declined by 5.1%, driven by a decrease in all categories of the segment. Transactions totaled 422.8 million, representing a decrease of 1.3%.
Net Sales reached CLP 320,647 million, a 2.2% growth, primarily driven by the increase in average revenue per unit case sold, resulting from price increases, combined with the aforementioned volume growth. These effects were partially offset by a negative mix effect. Net sales in the Non-Alcoholic Beverages segment increased by 4.4%, accounting for 77.1% of total sales. Net Sales in the Alcoholic Beverages segment decreased by 4.3%, accounting for 22.9% of total sales.
Cost of Sales increased by 0.5%, primarily due to higher sales volume and higher costs of Pet resin. This was partially offset by (i) lower sugar costs, (ii) lower concentrate costs, and (iii) the positive effect of the appreciation of the Chilean peso on our dollar-denominated costs.
Distribution Costs and Administrative Expenses increased by 5.3%, primarily due to (i) higher labor costs, (ii) greater distribution costs, and (iii) higher marketing expenses.
The aforementioned effects led to an Operating Income of CLP 30,066 million, increasing 7.2% compared to the previous year. Operating Margin was 9.4%.
| COCA-COLA ANDINA | |
| 3Q26 EARNINGS RELEASE | |
| www.koandina.com | |
| - 5 - |
Adjusted EBITDA reached CLP 46,668 million, an increase of 7.9%. Adjusted EBITDA Margin was 14.6%, an expansion of 76 basis points.
PARAGUAY: Third Quarter 2026 vs. Third Quarter 2025
| 3Q25 | 3Q26 | % Var. | 3Q25 | 3Q26 | Var % | |||||||||||||||||||
| (Figures in million CLP) | (Figures in million PGY) | |||||||||||||||||||||||
| Net Sales | 75,606 | 92,833 | 22.8 | % | 577,771 | 595,294 | 3.0 | % | ||||||||||||||||
| Operating Income | 14,491 | 18,014 | 24.3 | % | 110,754 | 115,547 | 4.3 | % | ||||||||||||||||
| Adjusted EBITDA | 18,420 | 23,434 | 27.2 | % | 140,843 | 150,331 | 6.7 | % | ||||||||||||||||
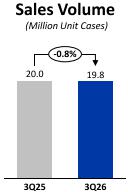
During the quarter, Sales Volume reached 19.8 million unit cases, a decrease of 0.8%, driven by a decline in the Soft Drinks category, partially offset by growth in the Water, Juices and Other Non-Alcoholic Beverages and the Beer and Other Alcoholic Beverages categories. The Non-Alcoholic Beverages segment accounted for 96.0% of total sales volume and declined by 1.6%, reflecting lower volumes in the Soft Drinks category, partially offset by growth in the Water, Juices and Other Non-Alcoholic Beverages categories. The Alcoholic Beverages segment accounted for 4.0% of total sales volume and grew by 22.8%, driven by higher volumes in the Beer category. Transactions totaled 136.3 million, representing a 2.0% increase.
Net Sales totaled CLP 92,833 million, an increase of 22.8%. In local currency, Net Sales grew by 3.0%, driven by higher average revenue per unit case sold as a result of price increases, partially offset by the aforementioned decline in volume. Net Sales in the Non-Alcoholic Beverages segment increased by 1.8% in local currency and accounted for 92.0% of total sales. Net Sales in the Alcoholic Beverages segment grew by 19.0% in local currency and accounted for 8.0% of total sales.
Cost of Sales increased by 19.7% in the reporting currency and by 0.4% in local currency, primarily due to (i) higher concentrate costs, (ii) a shift in the product mix toward products with higher unit costs, and (iii) higher Pet resin costs. These increases were partially offset by lower sweetener costs and the favorable impact of the appreciation of the Paraguayan guaraní against the U.S. dollar on our dollar-denominated costs.
Distribution Costs and Administrative Expenses increased by 30.3% in the reporting currency and by 9.4% in local currency, primarily driven by (i) higher distribution costs, (ii) higher marketing expenses, and (iii) higher labor costs.
The aforementioned effects led to an Operating Income of CLP 18,014 million, an increase of 24.3% compared to the same period last year.
Operating Margin reached 19.4%. In local currency, Operating Income grew by 4.3%.
Adjusted EBITDA reached CLP 23,434 million, an increase of 27.2%, and Adjusted EBITDA margin was 25.2%, an expansion of 88 basis points. In local currency, Adjusted EBITDA increased by 6.7%.
| COCA-COLA ANDINA | |
| 3Q26 EARNINGS RELEASE | |
| www.koandina.com | |
| - 6 - |
ACCUMULATED RESULTS: Nine Months 2026 vs. Nine Months 2025
Consolidated Results
| (Figures in million CLP) | 9M25 | 9M26 | % Var. | |||||||||
| Net Sales | 2,393,159 | 2,675,065 | 11.8 | % | ||||||||
| Operating Income | 300,247 | 346,640 | 15.5 | % | ||||||||
| Adjusted EBITDA | 418,239 | 488,932 | 16.9 | % | ||||||||
| Net income attributable to the owners of the parent | 168,384 | 197,164 | 17.1 | % | ||||||||
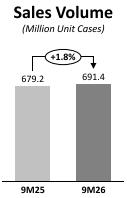
Consolidated Sales Volume was 691.4 million unit cases, representing a 1.8% increase compared to the same period in 2025, driven by volume growth in the operations in Brazil, Chile, and Paraguay, partially offset by a decline in volume in the Argentine operation. The Non-Alcoholic Beverages segment accounted for 95.3% of total sales volume and grew by 1.8%, driven by growth in the segment’s operations in Brazil and Chile, partially offset by a decline in volume in the Argentine and Paraguayan operations. The Alcoholic Beverages segment accounted for 4.7% of total sales volume and grew by 2.7%, driven primarily by increased volume in the segment’s operations in Brazil, Argentina and Paraguay, and was partially offset by a decline in the Chilean operation. Meanwhile, transactions totaled 3,785.7 million, representing an increase of 2.2%. Consolidated Net Sales reached CLP 2,675,065 million, an increase of 11.8%.
Consolidated Cost of Sales increased by 10.0% compared to the same period of the last year, primarily due to (i) higher concentrate costs in Brazil and Paraguay, (ii) the effect of a shift in the mix toward products with higher unit costs in Brazil and Paraguay, (iii) higher Pet resin costs in Chile, (iv) the effect of translating figures from our subsidiaries in Argentina, Brazil, and Paraguay to the reporting currency, and (v) the effect of the devaluation of Argentina’s local currency on our dollar-denominated costs. This was partially offset by (i) lower sugar costs, (ii) lower concentrate costs in Argentina and Chile, and (iii) the positive effect of the appreciation of the Brazilian real, the Chilean peso, and the Paraguayan guaraní against the U.S. dollar on our dollar-denominated costs.
Consolidated Distribution Costs and Administrative Expenses increased by 14.1%, primarily due to (i) higher distribution costs in Brazil, Chile, and Paraguay, (ii) higher marketing expenses, (iii) higher labor costs, (iv) lower other operating income in Argentina, Brazil, and Paraguay, and (v) the effect of translating financial figures from our subsidiaries in Argentina, Brazil, and Paraguay to the reporting currency. This was partially offset by lower labor and distribution costs in Argentina.
The aforementioned effects resulted in consolidated Operating Income of CLP 346,640 million, an increase of 15.5%. Operating margin was 13.0%.
Consolidated Adjusted EBITDA reached CLP 488,932 million, an increase of 16.9%. Adjusted EBITDA Margin was 18.3%, an expansion of 80 basis points.
Net income attributable to the owners of the parent was CLP 197,164 million, an increase of 17.1%, and Net Margin reached 7.4%.
Argentina
| 9M25 | 9M26 | Var % | 9M25 | 9M26 | % Var. | |||||||||||||||||||
| (Figures in million CLP) | (Figures in million ARS as of September 2026) | |||||||||||||||||||||||
| Net Sales | 545,310 | 632,692 | 16.0 | % | 1,037,145 | 986,833 | -4.9 | % | ||||||||||||||||
| Operating Income | 54,014 | 65,001 | 20.3 | % | 102,731 | 101,385 | -1.3 | % | ||||||||||||||||
| Adjusted EBITDA | 87,487 | 105,026 | 20.0 | % | 166,395 | 163,814 | -1.6 | % | ||||||||||||||||
| COCA-COLA ANDINA | |
| 3Q26 EARNINGS RELEASE | |
| www.koandina.com | |
| - 7 - |
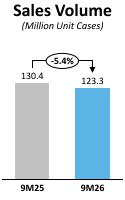
Sales Volume decreased by 5.4%, reaching 123.3 million unit cases, due to declines in the Soft Drinks and Water categories, which were partially offset by volume growth in the Juices and Other Non-Alcoholic Beverages and Beer and Other Alcoholic Beverages categories. Meanwhile, transactions reached 589.5 million, representing a 5.0% decrease.
Net Sales totaled CLP 632,692 million, an increase of 16.0%, while, in local currency, Net Sales decreased by 4.9%, primarily due to the aforementioned decline in volume, which was partially offset by an increase in average revenue per unit case sold.
Cost of Sales increased by 14.8%. In local currency, it decreased by 5.9%, primarily due to (i) lower sales volume, (ii) lower sweetener costs and (iii) lower concentrate costs. This was partially offset by (i) higher depreciation charges, (ii) higher labor costs, and (iii) the devaluation of the Argentine peso, which negatively impacts our dollar-denominated costs.
Distribution Costs and Administrative Expenses increased by 16.7% in the reporting currency. In local currency, these decreased by 4.3%, primarily due to the effect of lower sales volumes on distribution and haulage expenses, as well as lower labor costs. This was partially offset by lower other operating income classified under this item and higher marketing expenses.
The aforementioned effects led to an Operating Income of CLP 65,001 million, an increase of 20.3%. Operating Margin was 10.3%. In local currency, Operating Income decreased by 1.3%.
Adjusted EBITDA reached CLP 105,026 million, an increase of 20.0%. Adjusted EBITDA Margin was 16.6%, an expansion of 56 basis points. Meanwhile, Adjusted EBITDA in local currency decreased by 1.6%.
Brazil
| 9M25 | 9M26 | % Var. | 9M25 | 9M26 | % Var. | |||||||||||||||||||
| (Figures in million CLP) | (Figures in million BRL) | |||||||||||||||||||||||
| Net Sales | 697,096 | 808,860 | 16.0 | % | 4,118 | 4,592 | 11.5 | % | ||||||||||||||||
| Operating Income | 116,885 | 133,903 | 14.6 | % | 691 | 763 | 10.5 | % | ||||||||||||||||
| Adjusted EBITDA | 146,325 | 172,350 | 17.8 | % | 865 | 981 | 13.5 | % | ||||||||||||||||
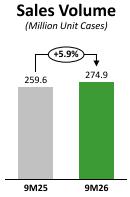
Sales Volume increased by 5.9%, reaching 274.9 million unit cases, driven by volume growth across all categories. The Non-Alcoholic Beverages segment accounted for 98.9% of total sales volume and grew by 5.5%, driven by growth in all categories within the segment. The Alcoholic Beverages segment accounted for 1.1% of total sales volume and grew by 57.4%, driven by growth in the Beer category, partially offset by a decline in the Other Alcoholic Beverages category. Meanwhile, transactions reached 1,479.7 million, representing a 7.5% increase.
Net Sales reached CLP 808,860 million, an increase of 16.0%. In local currency, Net Sales increased by 11.5%, due to the aforementioned volume growth and a higher average price resulting from the price increases we have implemented. Net Sales in the Non-Alcoholic Beverages segment increased by 11.5% in local currency, accounting for 97.5% of total sales. Net Sales in the Alcoholic Beverages segment increased by 12.4% in local currency, accounting for 2.5% of total sales.
Cost of Sales increased by 15.7%, while in local currency it increased by 11.2%, primarily due to (i) higher sales volume, (ii) higher concentrate costs, (iii) a shift in the mix toward products with higher unit costs, and (iv) higher depreciation charges. This was partially offset by lower sugar costs, as well as by the positive effect on our dollar-denominated costs of the appreciation of the Brazilian real against the U.S. dollar.
Distribution Costs and Administrative Expenses increased by 18.0% in the reporting currency and by 13.3% in local currency, primarily due to (i) higher marketing expenses, (ii) lower other operating income classified under this item, (iii) higher distribution expenses, and (iv) higher labor costs.
The aforementioned effects led to an Operating Income of CLP 133,903 million, an increase of 14.6%. Operating Margin was 16.6%. In local currency, Operating Income increased by 10.5%.
Adjusted EBITDA reached CLP 172,350 million, an increase of 17.8% compared to the previous year. Adjusted EBITDA Margin was 21.3%, an expansion of 32 basis points. In local currency, Adjusted EBITDA increased by 13.5%.
| COCA-COLA ANDINA | |
| 3Q26 EARNINGS RELEASE | |
| www.koandina.com | |
| - 8 - |
Chile
| 9M25 | 9M26 | % Var. | ||||||||||
| (Figures in million CLP) | ||||||||||||
| Net Sales | 942,319 | 975,173 | 3.5 | % | ||||||||
| Operating Income | 90,633 | 101,885 | 12.4 | % | ||||||||
| Adjusted EBITDA | 134,926 | 151,035 | 11.9 | % | ||||||||
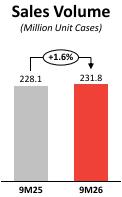
Sales Volume reached 231.8 million unit cases, representing a 1.6% increase, driven by growth in the Soft Drinks and Water categories, partially offset by declines in the Juices and Other Non-Alcoholic Beverages and Beer and Other Alcoholic Beverages categories. The Non-Alcoholic Beverages segment accounted for 88.3% of total sales volume and grew by 2.3%, driven by growth in the Soft Drinks and Water categories, partially offset by a decline in the Juices and Other Non-Alcoholic Beverages category. The Alcoholic Beverages segment accounted for 11.7% of total sales volume and declined by 3.3%, driven by decreases across all categories within the segment. Meanwhile, transactions reached 1,309.0 million, representing a 0.5% decrease.
Net Sales totaled CLP 975,173 million, an increase of 3.5%, driven by a higher average price during the period—due to price increases implemented—and the aforementioned volume growth. Net Sales in the Non-Alcoholic Beverages segment increased by 5.0%, accounting for 78.0% of total sales. Net Sales in the Alcoholic Beverages segment decreased by 1.4%, accounting for 22.0% of total sales.
Cost of Sales increased by 1.5%, primarily due to higher sales volume and higher Pet resin costs. This was partially offset by (i) lower sugar costs, (ii) lower concentrate costs, and (iii) the positive effect of the appreciation of the Chilean peso on our dollar-denominated costs.
Distribution Costs and Administrative Expenses increased by 5.4%, primarily due to (i) higher labor costs, (ii) higher distribution expenses, and (iii) higher marketing expenses.
The aforementioned effects led to an Operating Income of CLP 101,885 million, increasing 12.4% compared to the previous year. Operating Margin was 10.4%.
Adjusted EBITDA reached CLP 151,035 million, an increase of 11.9%. Adjusted EBITDA Margin was 15.5%, an expansion of 117 basis points.
Paraguay
| 9M25 | 9M26 | % Var. | 9M25 | 9M26 | % Var. | |||||||||||||||||||
| (Figures in million CLP) | (Figures in million PGY) | |||||||||||||||||||||||
| Net Sales | 214,954 | 265,849 | 23.7 | % | 1,737,085 | 1,836,101 | 5.7 | % | ||||||||||||||||
| Operating Income | 47,773 | 58,364 | 22.2 | % | 387,375 | 405,541 | 4.7 | % | ||||||||||||||||
| Adjusted EBITDA | 58,806 | 73,034 | 24.2 | % | 476,688 | 506,349 | 6.2 | % | ||||||||||||||||
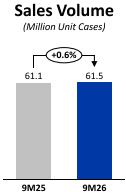
Sales Volume reached 61.5 million unit cases, representing a 0.6% increase, driven primarily by volume growth in the Water, Juices and Other Non-Alcoholic Beverages and the Beer and Other Alcoholic Beverages categories, partially offset by a decline in the Soft Drinks category. The Non-Alcoholic Beverages segment accounted for 96.2% of total sales volume and declined by 0.5%, explained by the decrease in the Soft Drinks category, partially offset by growth in the Water, Juices and Other Non-Alcoholic Beverages categories. The Alcoholic Beverages segment accounted for 3.8% of total sales volume and grew by 36.8%, driven by higher volumes in the Beer category. Transactions totaled 407.6 million, representing a 4.2% increase.
| COCA-COLA ANDINA | |
| 3Q26 EARNINGS RELEASE | |
| www.koandina.com | |
| - 9 - |
Net Sales totaled CLP 265,849 million, an increase of 23.7%. In local currency, Net Sales grew by 5.7%, driven by higher average revenue during the period, by the implementation of price increases and, to a lesser extent, by the aforementioned volume growth. Net Sales in the Non-Alcoholic Beverages segment increased by 3.9% in local currency and accounted for 92.5% of total sales. Net Sales in the Alcoholic Beverages segment grew by 34.2% in local currency and accounted for 7.5% of total sales.
Cost of Sales increased by 22.3% in the reporting currency and by 4.6% in local currency, primarily due to (i) higher concentrate costs, (ii) a shift in the product mix toward products with higher unit costs, and (iii) higher depreciation charges. These increases were partially offset by lower sweetener costs and the favorable impact of the appreciation of the Paraguayan guaraní against the U.S. dollar on our dollar-denominated costs.
Distribution Costs and Administrative Expenses increased by 29.3% in the reporting currency and by 10.1% in local currency, primarily explained by (i) higher distribution costs, (ii) higher labor costs, (iii) higher marketing expenses, and (iv) lower operating income recorded under this item.
The aforementioned effects led to an Operating Income of CLP 58,364 million, an increase of 22.2% compared to the same period last year. Operating Margin reached 22.0%. In local currency, Operating Income grew by 4.7%.
Adjusted EBITDA reached CLP 73,034 million, an increase of 24.2% compared to the same period last year, and Adjusted EBITDA Margin was 27.5%, an expansion of 11 basis points. In local currency, Adjusted EBITDA increased by 6.2%.
NON-OPERATING INCOME FOR THE QUARTER
Net Financial Income and Expense account recorded an expense of CLP 12,936 million, compared to an expense of CLP 13,064 million in the same quarter of the previous year; this difference is primarily due to higher financial income resulting from increased cash on hand.
Share of Profit or Loss from Investments Accounted for Using the Equity Method went from a loss of CLP 385 million to a profit of CLP 1,828 million, primarily due to higher results from subsidiaries in Chile and Brazil.
Other Income and Expenses account recorded a loss of CLP 6,873 million, compared to a profit of CLP 233 million in the same quarter of the previous year; this difference is primarily due to the fact that in the previous year, other income of CLP 5,298 million was recorded as a result of the recognition of a compensation payment in Brazil.
Results by Adjustment Units and Exchange Rate Differences recorded a profit of CLP 1,612 million, compared to a profit of CLP 4,164 million in the same period last year. This decrease was primarily attributable to lower monetary adjustment income at our Argentine subsidiary and the adverse impact of higher inflation in Chile on our UF-denominated debt.
Income Tax amounted to -CLP 22,657 million, compared to -CLP 25,296 million in the same period last year. This change was primarily attributable to the favorable impact of lower withholding taxes resulting from reduced dividend distributions by our Paraguayan subsidiary during the quarter.
| COCA-COLA ANDINA | |
| 3Q26 EARNINGS RELEASE | |
| www.koandina.com | |
| - 10 - |
CONSOLIDATED BALANCE SHEET
The balances of assets, liabilities and equity as of the closing dates of these financial statements are as follows:
| 12.31.2025 | 09.30.2026 | Variation | ||||||||||
| million CLP | million CLP | million CLP | ||||||||||
| Assets | ||||||||||||
| Current assets | 1,033,053 | 1,142,422 | 109,369 | |||||||||
| Non-current assets | 2,387,353 | 2,637,233 | 249,880 | |||||||||
| Total Assets | 3,420,405 | 3,779,655 | 359,250 | |||||||||
| 12.31.2025 | 09.30.2026 | Variation | ||||||||||
| million CLP | million CLP | million CLP | ||||||||||
| Liabilities | ||||||||||||
| Current liabilities | 730,413 | 708,210 | -22,202 | |||||||||
| Non-current liabilities | 1,493,439 | 1,652,600 | 159,161 | |||||||||
| Total Liabilities | 2,223,852 | 2,360,810 | 136,959 | |||||||||
| 12.31.2025 | 09.30.2026 | Variation | ||||||||||
| million CLP | million CLP | million CLP | ||||||||||
| Equity | ||||||||||||
| Non-controlling interests | 39,155 | 41,317 | 2,162 | |||||||||
| Equity attributable to the owners of the parent | 1,157,399 | 1,377,528 | 220,129 | |||||||||
| Total Equity | 1,196,554 | 1,418,844 | 222,291 | |||||||||
As of the end of September 2026, compared to year-end 2025, the Argentine peso, the Brazilian real and the Paraguayan guaraní appreciated against the Chilean peso by 2.8%, 13.9% and 20.9%, respectively, which led to an increase in assets, liabilities, and equity accounts due to the effect of translating figures to the reporting currency. Additionally, in accordance with IAS 29, the figures for Argentina, prior to translation, are adjusted for accumulated inflation from year-end 2025 through the closing date of this report, increasing the local currency figures by 23.7%.
Assets
Total assets increased by CLP 359,250 million, or 10.5%, compared to December 2025.
Current assets increased by CLP 109,369 million, or 10.6%, compared to December 2025, primarily driven by increases in Other current financial assets (CLP 82,082 million) and Inventories (CLP 51,581 million). These increases mainly reflected higher inventories of raw materials and finished goods in Argentina and Brazil, together with the favorable impact of currency translation from our foreign subsidiaries. This was partially offset by a decrease in trade and other current receivables (CLP -46,536 million), primarily due to seasonal factors, as December typically records the highest sales of the year and, consequently, higher accounts receivable balances compared to an average month.
Non-current assets increased by CLP 249,880 million, or 10.5%, compared to December 2025, primarily driven by an increase in property, plant, and equipment (CLP 146,026 million), reflecting investments in our operations, the impact of currency translation, and adjustments under IAS 29 in our Argentine operations. These increases were partially offset by depreciation, disposals, and other factors. Added to this is the increase in intangible assets other than goodwill (CLP 75,300 million), primarily attributable to the currency translation effect on the balances of Distribution Rights in Brazil and Paraguay.
Liabilities and Equity
Total liabilities increased by CLP 136,959 million, or 6.2%, compared to December 2025.
Current liabilities decreased by CLP 22,202 million, or 3.0%, compared to December 2025, primarily driven by a decrease in trade payables and other current payables (-CLP 46,277 million). This decline was mainly attributable to seasonal factors, as December typically records the highest sales of the year and, consequently, higher accounts payable balances to suppliers.
Non-current liabilities increased by CLP 159,161 million, or 10.7%, compared to December 2025, primarily driven by an increase in other non-current financial liabilities (CLP 121,110 million), resulting from the issuance of a green bond in August of this year for CLP 102,643 million. The increase also reflected higher deferred tax liabilities (CLP 24,933 million), primarily attributable to the favorable impact of currency translation on the deferred tax liability associated with distribution rights.
As for equity, it increased by CLP 222,291 million, or 18.6%, compared to December 2025, primarily attributable to higher retained earnings resulting from profits generated during the period (CLP 197,165 million) and the restatement of equity balances at our Argentine subsidiary in accordance with IAS 29 (CLP 70,381 million). These increases were partially offset by dividend distributions (-CLP 188,344 million). Furthermore, the “Other Reserves” account increased by CLP 140,927 million, mainly due to the positive effect of currency translation from our foreign subsidiaries.
| COCA-COLA ANDINA | |
| 3Q26 EARNINGS RELEASE | |
| www.koandina.com | |
| - 11 - |
| 09.30.2026 | ||||
| million CLP | ||||
| Assets by segment | ||||
| Argentina | 540,283 | |||
| Brazil | 1,188,512 | |||
| Chile | 1,539,963 | |||
| Paraguay | 510,897 | |||
| Total Assets | 3,779,655 | |||
| 09.30.2026 | ||||
| million CLP | ||||
| Liabilities by segment | ||||
| Argentina | 157,492 | |||
| Brazil | 815,955 | |||
| Chile | 1,299,180 | |||
| Paraguay | 88,183 | |||
| Total Liabilities | 2,360,810 | |||
FINANCIAL ASSETS AND LIABILITIES
| CONSOLIDATED NET FINANCIAL DEBT | (MUSD) | |||
| Total Financial Assets | 522 | |||
| Cash and cash equivalents (1) | 316 | |||
| Other current financial assets (1) | 127 | |||
| Net valuation of hedging derivatives (2) | 79 | |||
| Financial Debt | 1,324 | |||
| Bonds in the international market | 503 | |||
| Bonds in the local market (Chile) | 667 | |||
| Bank Debt and Other | 154 | |||
| Net financial debt | 802 | |||
(1) Financial assets Corresponding to cash and cash equivalents and other current financial assets are invested in low-risk instruments such as time deposits, short-term fixed-income mutual funds, and others.
(2) Considers net effect of valuations for and against hedge derivatives.
CURRENCY EXPOSURE (%)
| Financial
Assets (1) | Financial
Debt (3) | |||||||
| CLP (Chile) | 60 | % | 35 | % | ||||
Unidad de Fomento (Chilean pesos indexed to Inflation) | 20 | % | 50 | % | ||||
| BRL (Brazil) | 7 | % | 14 | % | ||||
| PGY (Paraguay) | 10 | % | 0 | % | ||||
| ARS (Argentina) | 2 | % | 0 | % | ||||
| USD (United States) | 1 | % | 1 | % | ||||
| CHF (Switzerland) | 0 | % | 0 | % | ||||
| Total | 100 | % | 100 | % | ||||
(3) Includes valuation of hedging derivatives.
RISK RATING
| Local rating agencies | Rating | |||
| Moody’s Local CL | AA+ | |||
| Fitch Chile | AA+ | |||
| International rating agencies | Rating | |||
| Moody’s Ratings | Baa1 | |||
| Fitch Ratings, Inc. | BBB+ | |||
DEBT AMORTIZATION PROFILE
| COCA-COLA ANDINA | |
| 3Q26 EARNINGS RELEASE | |
| www.koandina.com | |
| - 12 - |
CASH FLOW
| 09.30.2025 | 09.30.2026 | Variation | ||||||||||||||
| million CLP | million CLP | million CLP | % | |||||||||||||
| Cash Flow | ||||||||||||||||
| Operating | 246,706 | 313,347 | 66,641 | 27.0 | % | |||||||||||
| Investment | -121,075 | -233,591 | -112,517 | 92.9 | % | |||||||||||
| Financing | -96,599 | -80,608 | 15,991 | -16.6 | % | |||||||||||
| Net cash flow for the period | 29,032 | -852 | -29,884 | -102.9 | % | |||||||||||
During the current period, the Company generated a negative net cash flow of CLP 852 million, which is explained as follows:
Operating activities generated a positive net cash flow of CLP 313,347 million, higher than the CLP 246,706 million recorded in the same period of 2025, primarily due to higher revenue from increased product sales, partially offset by higher operating and supplier payments.
Investment activities generated a negative cash flow of CLP 233,591 million, representing a decrease of CLP 112,517 million compared to the previous period, primarily due to the purchase of financial assets, which resulted in a cash outflow of CLP 75,000 million, and the sale of financial assets in 2025, which generated cash inflows of CLP 72,786 million—transactions that did not occur in 2026—partially offset by lower capital expenditures (Capex).
Financing activities generated a negative cash flow of CLP 80,608 million, representing a positive change of CLP 15,991 million compared to the previous period, primarily due to lower loan repayments in 2026, partially offset by higher dividend payments and lower proceeds from loans.
KEY INDICATORS
| INDICATOR | Definition | Unit | Sep 26 | Dec 25 | Sep 25 | Sep
26 vs. Dec 25 | Sep
26 vs. Sep 25 | |||||||||||||||||
| LIQUIDITY | ||||||||||||||||||||||||
| Current liquidity | Current Asset | Times | 1.6 | 1.4 | 1.4 | 14.1 | % | 17.7 | % | |||||||||||||||
| Current Liability | ||||||||||||||||||||||||
| Acid ratio | Current Assets - Inventory | Times | 1.1 | 1.0 | 0.9 | 11.3 | % | 22.7 | % | |||||||||||||||
| Current Liability | ||||||||||||||||||||||||
| ACTIVITY | ||||||||||||||||||||||||
| Investment | CLP million | 154,362 | 279,347 | 188,819 | -44.7 | % | -18.2 | % | ||||||||||||||||
| Inventory turnover | Cost of Sales | Times | 4.9 | 6.7 | 4.7 | -27.4 | % | 4.2 | % | |||||||||||||||
| Average Inventory | ||||||||||||||||||||||||
| INDEBTEDNESS | ||||||||||||||||||||||||
| Indebtedness ratio | Net Financial Debt* | Times | 0.5 | 0.6 | 0.7 | -12.9 | % | -20.6 | % | |||||||||||||||
| Total Equity* | ||||||||||||||||||||||||
| Financial expense coverage | Adjusted EBITDA (12M) | Times | 15.7 | 12.1 | 11.0 | 29.3 | % | 42.9 | % | |||||||||||||||
| Financial Expenses* (12M) - Financial Income* (12M) | ||||||||||||||||||||||||
| Net Financial Debt / | Net Financial Debt | Times | 1.1 | 1.2 | 1.4 | -9.3 | % | -18.4 | % | |||||||||||||||
| Adjusted EBITDA | Adjusted EBITDA (12M) | |||||||||||||||||||||||
| PROFITABILITY | ||||||||||||||||||||||||
| On Equity | Net Income Fiscal Year (12M) | % | 23.5 | % | 25.2 | % | 25.4 | % | (1.7 pp | ) | (1.9 pp | ) | ||||||||||||
| Average Equity | ||||||||||||||||||||||||
| On Total Assets | Net Income Fiscal Year (12M) | % | 8.3 | % | 8.0 | % | 8.0 | % | 0.3 pp | 0.2 pp | ||||||||||||||
| Average Assets | ||||||||||||||||||||||||
*The definitions used can be found in the Glossary on page 16 of this document.
| COCA-COLA ANDINA | |
| 3Q26 EARNINGS RELEASE | |
| www.koandina.com | |
| - 13 - |
Liquidity
Current liquidity increased by 14.1% compared to December 2025, explained by the increase in current assets (10.6%) and the decrease in current liabilities (3.0%).
Acid Ratio increased by 11.3% compared to December 2025, reflecting the aforementioned factors. During the period, inventories increased by 16.9%, while current assets excluding inventories rose by 7.9% compared to December 2025.
Activity
As of the end of September 2026, investments totaled CLP 154,362 million, representing an 18.2% decrease compared to the same period in 2025, mainly explained by lower productive investments (mainly in Brazil).
Inventory turnover reached 4.9 times, an increase of 4.2% compared to the same period in 2025, primarily explained by the increase in cost of goods sold (10.0%), which exceeded the increase in average inventory (5.6%), when compared to the same period of 2025.
Indebtedness
The Debt-to-Equity Ratio stood at 0.5 times as of the end of September 2026, representing a 12.9% decrease compared to December 2025. This decline was primarily attributable to the increase in total equity (18.6%), which exceeded the increase in net financial debt (3.3%).
The Financial Expense Coverage Ratio increased by 29.3% compared to December 2025, reaching 15.7 times. This is explained by the increase in 12-month Adjusted EBITDA (13.9%) and the increase in 12-month Financial Income (54.3%).
The Net Financial Debt/Adjusted EBITDA Ratio stood at 1.1 times as of the end of September 2026, representing a 9.3% decrease compared to December 2025. This decline was primarily driven by the increase in 12-month Adjusted EBITDA (13.9%), which exceeded the increase in net financial debt (3.3%).
Profitability
Return on Equity reached 23.5%, a decrease of 1.7 percentage points compared to December 2025. This decline was primarily attributable to the increase in average equity (18.8%), which exceeded the increase in 12-month net income (10.7%).
Meanwhile, Return on Total Assets reached 8.3%, an increase of 0.3 percentage points compared to December 2025, driven by the increase in 12-month net income (10.7%), which exceeded the increase in average assets (7.3%).
MACROECONOMIC INFORMATION
| INFLATION | Accumulated 9M26 | L12M | ||||||
| Argentina* | 23.66 | % | 33.29 | % | ||||
| Brazil | 3.95 | % | 4.58 | % | ||||
| Chile | 4.06 | % | 4.10 | % | ||||
| Paraguay | 1.94 | % | 1.51 | % | ||||
*Official inflation published by the Argentine National Institute of Statistics and Census (INDEC). It should be noted that the inflation rate used to restate Argentina's figures in accordance with IAS 29 corresponds to the inflation rate estimated by the Central Bank of Argentina (in its Market Expectations Survey report), which is also adjusted for the difference between the estimate (by the Central Bank) and the actual inflation rate for the previous month (INDEC).
| Local currency/USD | CLP/local currency | |||||||||||||||||||||||
| (Average exchange rate*) | (Average exchange rate*) | |||||||||||||||||||||||
| EXCHANGE RATES USED | 3Q25 | 3Q26 | % Var. | 3Q25 | 3Q26 | % Var. | ||||||||||||||||||
| Argentina | 1,380.0 | 1,517.0 | 9.9 | % | 0.7 | 0.6 | -8.1 | % | ||||||||||||||||
| Brazil | 5.45 | 5.14 | -5.7 | % | 176.19 | 181.57 | 3.1 | % | ||||||||||||||||
| Chile | 960 | 933 | -2.8 | % | N.A | N.A | N.A | |||||||||||||||||
| Paraguay | 7,347 | 5,985 | -18.5 | % | 0.13 | 0.16 | 19.3 | % | ||||||||||||||||
*Except for Argentina, where the closing exchange rate is used, in accordance with IAS 29.
| Local currency/USD | CLP/local currency | |||||||||||||||||||||||
| (Average exchange rate*) | (Average exchange rate*) | |||||||||||||||||||||||
| EXCHANGE RATES USED | 9M25 | 9M26 | % Var. | 9M25 | 9M26 | Var % | ||||||||||||||||||
| Argentina | 1,380.0 | 1,517.0 | 9.9 | % | 0.7 | 0.6 | -8.1 | % | ||||||||||||||||
| Brazil | 5.65 | 5.15 | -8.9 | % | 169.18 | 176.00 | 4.0 | % | ||||||||||||||||
| Chile | 956 | 906 | -5.3 | % | N.A | N.A | N.A | |||||||||||||||||
| Paraguay | 7,752 | 6,253 | -19.3 | % | 0.12 | 0.14 | 17.4 | % | ||||||||||||||||
*Except for Argentina, where the closing exchange rate is used, in accordance with IAS 29.
| COCA-COLA ANDINA | |
| 3Q26 EARNINGS RELEASE | |
| www.koandina.com | |
| - 14 - |
MARKET RISK ANALYSIS
The Company’s risk management is the responsibility of the office of the Chief Executive Officer (through the areas of Corporate Management Control, Sustainability and Risks, which report to the office of the Chief Financial Officer), as well as each of the management areas of Coca-Cola Andina. The main risks that the Company has identified and that could possibly affect the business are as follows:
Relationship with The Coca-Cola Company
A large part of the Company’s sales derives from the sale of products whose trademarks are owned by The Coca-Cola Company, which has the ability to exert an important influence on the business through its rights under the Licensing or Bottling Agreements. In addition, we depend on The Coca-Cola Company to renew these Bottling Agreements.
Non-alcoholic beverage business environment
Consumers, public health officials, and government officials in our markets are increasingly concerned about the public health consequences associated with obesity, which can affect demand for our products, especially those containing sugar.
The Company has developed a large portfolio of sugar-free products and has also made reformulations to some of its sugary products, significantly reducing the sugar content of its products.
Raw material prices and exchange rates
Many raw materials are used in the production of beverages and packaging, including sugar and Pet resin, the prices of which may present great volatility. In the case of sugar, the Company sets the price of a part of the volume that it consumes with some anticipation, in order to avoid having large fluctuations of cost that cannot be anticipated.
In addition, these raw materials are traded in dollars; the Company has a policy of hedging in the futures market a portion of the dollars it uses to buy raw materials.
Instability in the supply of utilities and raw materials
In the countries in which we operate, our operations depend on a stable supply of utilities, fuel and raw materials. Power outages or water shutoffs, as well as the lack of raw materials, may result in interruptions of our production. The Company has mitigation plans to reduce the effects of eventual interruptions in the supply of utilities and raw materials.
Economic conditions of the countries where we operate
The Company maintains operations in Argentina, Brazil, Chile and Paraguay. The demand for our products largely depends on the economic situation of these countries. Moreover, economic instability can cause depreciation of the currencies of these countries, as well as inflation, which may eventually affect the Company’s financial situation.
New tax laws or modifications to tax incentives
We cannot ensure that any government authority in any of the countries in which we operate will not impose new taxes or increase existing taxes on our raw materials, products or containers. Likewise, we cannot assure that these authorities are going to uphold and/or renew tax incentives that currently benefit some of our operations.
A devaluation of the currencies of the countries where we have our operations, regarding the Chilean peso, can negatively affect the results reported by the Company in Chilean pesos
The Company reports its results in Chilean pesos, while a large part of its revenues and Adjusted EBITDA comes from countries that use other currencies. Should currencies devaluate regarding the Chilean peso, this would have a negative effect on the results of the Company, upon the translation of results into Chilean pesos.
The imposition of exchange controls could restrict the entry and exit of funds to and from the countries in which we operate, which could significantly limit our financial capacity
The imposition of exchange controls in the countries in which we operate could affect our ability to repatriate profits, which could significantly limit our ability to pay dividends to our shareholders. Additionally, it may limit the ability of our foreign subsidiaries to finance payments of U.S. dollar denominated liabilities required by foreign creditors.
Protests and demonstrations in the countries in which we operate could potentially have a negative effect on the economy and on our business and financial condition
We cannot predict whether protests and demonstrations, which have sometimes been violent in the past, will significantly affect the economies of the countries in which we operate, nor whether the public policies implemented by the government in response to these demonstrations will have a negative impact on the economy and our business. Nor can we guarantee that demonstrations and vandalism will not cause damage to our logistics and production infrastructure.
| COCA-COLA ANDINA | |
| 3Q26 EARNINGS RELEASE | |
| www.koandina.com | |
| - 15 - |
Our business is subject to risks from pandemics such as COVID-19.
Pandemics pose the risk that we or our employees, contractors, suppliers and other partners may be limited or prevented from conducting business for an indefinite period of time, including due to shutdowns that may be requested or ordered by government authorities. In addition, we may experience disruptions in the supply of raw materials.
Pandemics and related governmental actions could adversely affect our business and results of operations, potentially in a material way.
A more detailed analysis of business risks is available in the Company’s 20-F and Annual Report, available on our website.
RECENT EVENTS
Dividend 238
On August 27, 2026, the Company paid Dividend 238: CLP 51.0 per Series A share and CLP 56.1 per Series B share.
Green Bond Issuance
In August, we issued a green bond in the local market for 2.5 million Unidades de Fomento at an interest rate of 2.95% (“yield to maturity”), maturing on September 30, 2030. The spread on this issuance was 65 basis points over the benchmark sovereign rate—the lowest since 2019 for an AA+ corporate issuer—which is a clear indication of market confidence in the Company’s strategy. The proceeds from the offering will be used to refinance or finance new or existing green projects that are eligible under the “Coca-Cola Andina Green Bond Framework / Sustainable Bond Framework.”
Tax Reform
On October 17, 2026, the Law for National Reconstruction and Economic and Social Development was published in Chile, applicable to entities subject to the Chilean tax regime.
Among the measures contemplated in the law is a gradual reduction in the First-Category Income Tax rate, from the current 27% to 23% starting in commercial year 2029, with transitional rates of 25.5% for commercial year 2027 and 24% for commercial year 2028.
In accordance with IAS 12, “Income Taxes,” deferred tax assets and liabilities are measured using the tax rates expected to apply in the period in which such assets are realized or liabilities are settled, provided that such rates have been enacted or substantively enacted as of the financial statements’ reporting date.
As of September 30, 2026, the Chilean companies included in the consolidated financial statements have net deferred tax liabilities of CLP 97,625 million, composed of deferred tax assets of CLP 34,528 million and deferred tax liabilities of CLP 132,153 million. Deferred tax assets and liabilities of companies from other countries included in the consolidation are not affected by this legal amendment, as they correspond to tax jurisdictions other than Chile.
As a result of the changes described above, the measurement of deferred tax assets and liabilities of the Chilean companies will be affected. Quantifying this effect requires estimating the periods in which the temporary differences will reverse, in order to apply the corresponding tax rates to each reversal period. Based on estimates made by Management, the effect of this change would result in a reduction of approximately CLP 14,808 million in net deferred tax liabilities.
Dividend 239
On October 29, 2026, the Company will pay Dividend 239: CLP 36.5 per Series A share and CLP 40.15 per Series B share.
GLOSSARY
Adjusted EBITDA: includes Revenue, Costs of Sales, Distribution Costs and Administrative Expenses, included in the Financial Statements submitted to Chile’s Financial Market Commission and determined in accordance with IFRS, plus Depreciation.
Currency-neutral of a quarter q for a Q year is calculated using the same ratio of local currencies to the Chilean peso as the q quarter of the Q-1 year. In the case of Argentina, given that it is a hyperinflationary economy, the result of the q quarter is also deflated by inflation of the last 12 months.
Financial Expenses: correspond to interest generated by the Company’s financial debt.
Financial Income: corresponds to the interest generated by the Company's cash.
Net Financial Debt: considers the consolidated financial liability that accrues interest, i.e.: (i) other current financial liabilities, plus (ii) other non-current financial liabilities, less (iii) the sum of cash and cash equivalent; plus other current financial assets; plus other non-current financial assets (to the extent that they correspond to the balances of assets for derivative financial instruments, taken to cover exchange rate risk and/or interest rate of financial liabilities).
| COCA-COLA ANDINA | |
| 3Q26 EARNINGS RELEASE | |
| www.koandina.com | |
| - 16 - |
Operating Income: includes Revenue, Costs of Sales, Distribution Costs and Administrative Expenses, included in the Financial Statements submitted to Chile Financial Market Commission and determined in accordance with IFRS.
Total Equity: corresponds to the equity attributable to the owners of the parent plus non-controlling interests.
Transactions: refers to the number of units sold, regardless of size.
Volume: is expressed in Unit Cases (UCs), the conventional unit of measurement used to measure sales volume throughout the Coca-Cola System worldwide, equivalent to 5.678 liters.
ADDITIONAL INFORMATION
| STOCK EXCHANGES ON WHICH WE TRADE | |||
|
ANDINA-A ANDINA-B |
AKO/A AKO/B |
||
| ESG INDICES IN WHICH WE PARTICIPATE | |||
|
Dow Jones Sustainability Index Chile Dow Jones Sustainability MILA Pacific Alliance Index. |
|
|
|
 |
 |
 |
 |
 |
|||
| NUMBER OF SHARES | |||
| TOTAL: 946,570,604 | SERIES A: 473,289,301 | SERIES B: 473,281,303 | SHARES PER ADR: 6 |





ABOUT COCA-COLA ANDINA
Coca-Cola Andina is among the three largest Coca-Cola bottlers in Latin America, servicing franchised territories with almost 58.0 million people, delivering 945.8 million unit cases —or 5,370 million liters—of soft drinks, juices, bottled water, beer and other alcoholic beverages during 2025. Coca-Cola Andina has the franchise to produce and commercialize Coca-Cola products in certain territories in Argentina (through Embotelladora del Atlántico), in Brazil (through Rio de Janeiro Refrescos), in Chile, (through Embotelladora Andina) and in all of Paraguay (through Paraguay Refrescos). The Chadwick Claro, Garcés Silva, Said Handal and Said Somavía families control Coca-Cola Andina in equal parts. The Company's value generation proposal is to become a Total Beverage Company, using existing resources efficiently and sustainably, developing a relationship of excellence with consumers of its products, as well as with its collaborators, customers, suppliers, the community in which it operates and with its strategic partner The Coca-Cola Company, in order to increase ROIC for shareholders in the long term. For additional company information visit www.koandina.com.
| COCA-COLA ANDINA | |
| 3Q26 EARNINGS RELEASE | |
| www.koandina.com | |
| - 17 - |
This document may contain forward-looking statements that reflect a good faith expectation by Coca-Cola Andina and are based on currently available information. However, the results ultimately obtained are subject to a number of variables, many of which are beyond the Company's control, and which could materially impact actual performance. Among the factors that could cause a shift in performance are: political and economic conditions on mass consumption, price pressures resulting from competitive discounts from other bottlers, weather conditions in the Southern Cone and other risk factors that would be applicable from time to time and that are periodically disclosed in reports to the relevant regulatory authorities and are available on our website.
| COCA-COLA ANDINA | |
| 3Q26 EARNINGS RELEASE | |
| www.koandina.com | |
| - 18 - |
Consolidated Income Statement
(In million Chilean pesos)
| Third Quarter 2026 | Third Quarter 2025 | |||||||||||||||||||||||||||||||||||||||||||
| Argentina | Brazil | Chile | Paraguay | Total (1) | Argentina | Brazil | Chile | Paraguay | Total (1) | % Ch. | ||||||||||||||||||||||||||||||||||
| Volume total beverages (Million UC) | 39.0 | 92.1 | 75.1 | 19.8 | 226.1 | 40.7 | 85.6 | 74.4 | 20.0 | 220.6 | 2.5 | % | ||||||||||||||||||||||||||||||||
| Transactions (Million) | 184.9 | 492.9 | 422.8 | 136.3 | 1,236.9 | 196.3 | 454.8 | 428.3 | 133.6 | 1,213.0 | 2.0 | % | ||||||||||||||||||||||||||||||||
| Net sales | 203,184 | 283,108 | 320,647 | 92,833 | 896,609 | 172,802 | 241,122 | 313,615 | 75,606 | 800,361 | 12.0 | % | ||||||||||||||||||||||||||||||||
| Cost of sales | -111,598 | -177,456 | -212,318 | -54,191 | -552,402 | -95,668 | -149,097 | -211,270 | -45,282 | -498,443 | 10.8 | % | ||||||||||||||||||||||||||||||||
| Gross profit | 91,586 | 105,651 | 108,328 | 38,641 | 344,207 | 77,135 | 92,025 | 102,344 | 30,324 | 301,918 | 14.0 | % | ||||||||||||||||||||||||||||||||
| Gross margin | 45.1 | % | 37.3 | % | 33.8 | % | 41.6 | % | 38.4 | % | 44.6 | % | 38.2 | % | 32.6 | % | 40.1 | % | 37.7 | % | ||||||||||||||||||||||||
| Distribution and administrative expenses | -74,956 | -64,778 | -78,262 | -20,628 | -238,623 | -63,234 | -53,134 | -74,293 | -15,833 | -206,494 | 15.6 | % | ||||||||||||||||||||||||||||||||
| Corporate expenses (2) | -5,093 | -3,496 | 45.7 | % | ||||||||||||||||||||||||||||||||||||||||
| Operating income (3) | 16,630 | 40,874 | 30,066 | 18,014 | 100,490 | 13,900 | 38,891 | 28,051 | 14,491 | 91,929 | 9.3 | % | ||||||||||||||||||||||||||||||||
| Operating margin | 8.2 | % | 14.4 | % | 9.4 | % | 19.4 | % | 11.2 | % | 8.0 | % | 16.1 | % | 8.9 | % | 19.2 | % | 11.5 | % | ||||||||||||||||||||||||
| Adjusted EBITDA (4) | 30,036 | 54,244 | 46,668 | 23,434 | 149,289 | 25,555 | 49,393 | 43,248 | 18,420 | 133,130 | 12.1 | % | ||||||||||||||||||||||||||||||||
| Adjusted EBITDA margin | 14.8 | % | 19.2 | % | 14.6 | % | 25.2 | % | 16.7 | % | 14.8 | % | 20.5 | % | 13.8 | % | 24.4 | % | 16.6 | % | ||||||||||||||||||||||||
| Financial (expenses) income (net) | -12,936 | -13,064 | -1.0 | % | ||||||||||||||||||||||||||||||||||||||||
| Share of (loss) profit of investments accounted for using the equity method | 1,828 | -385 | -575.1 | % | ||||||||||||||||||||||||||||||||||||||||
| Other income (expenses) (5) | -6,873 | 233 | -3053.4 | % | ||||||||||||||||||||||||||||||||||||||||
| Results by readjustement unit and exchange rate difference | 1,612 | 4,164 | -61.3 | % | ||||||||||||||||||||||||||||||||||||||||
| Net income before income taxes | 84,122 | 82,876 | 1.5 | % | ||||||||||||||||||||||||||||||||||||||||
| Income tax expense | -22,657 | -25,296 | -10.4 | % | ||||||||||||||||||||||||||||||||||||||||
| Net income | 61,464 | 57,580 | 6.7 | % | ||||||||||||||||||||||||||||||||||||||||
| Net income attributable to non-controlling interests | 18 | -402 | -104.4 | % | ||||||||||||||||||||||||||||||||||||||||
| Net income attributable to equity holders of the parent | 61,482 | 57,178 | 7.5 | % | ||||||||||||||||||||||||||||||||||||||||
| Net margin | 6.9 | % | 7.1 | % | ||||||||||||||||||||||||||||||||||||||||
| WEIGHTED AVERAGE SHARES OUTSTANDING | 947 | 947 | ||||||||||||||||||||||||||||||||||||||||||
| Earnings per share | 65 | 60 | ||||||||||||||||||||||||||||||||||||||||||
| Earnings per ADS | 390 | 362 | 7.5 | % | ||||||||||||||||||||||||||||||||||||||||
(1) Total may be different from the addition of the four countries because of intercountry eliminations.
(2) Corporate expenses partially reclassified to the operations.
(3) Operating Income considers Net Sales, Cost of Sales, Distribution Costs, and Administrative Expenses included in the Financial Statements filed with the Chilean Financial Market Comission and determined in accordance to IFRS.
(4) Adjusted EBITDA considers Net Sales, Cost of Sales, Distribution Costs, and Administrative Expenses included in the Financial Statements filed with the Chilean Financial Market Comission and determined in accordance to IFRS, plus Depreciation.
(5) Other income (expenses) includes the following lines of the income statement by function included in the published financial statements in the Financial Market Comission: "Other income", "Other expenses" and "Other (loss) gains".
| COCA-COLA ANDINA | |
| 3Q26 EARNINGS RELEASE | |
| www.koandina.com | |
| - 19 - |
Consolidated Income Statement
(In million Chilean pesos)
| Nine Months 2026 | Nine Months 2025 | |||||||||||||||||||||||||||||||||||||||||||
| Argentina | Brazil | Chile | Paraguay | Total (1) | Argentina | Brazil | Chile | Paraguay | Total (1) | % Ch. | ||||||||||||||||||||||||||||||||||
| Volume total beverages (Million UC) | 123.3 | 274.9 | 231.8 | 61.5 | 691.4 | 130.4 | 259.6 | 228.1 | 61.1 | 679.2 | 1.8 | % | ||||||||||||||||||||||||||||||||
| Transactions (Million) | 589.5 | 1,479.7 | 1,309.0 | 407.6 | 3,785.7 | 620.8 | 1,376.1 | 1,315.0 | 391.3 | 3,703.3 | 2.2 | % | ||||||||||||||||||||||||||||||||
| Net sales | 632,692 | 808,860 | 975,173 | 265,849 | 2,675,065 | 545,310 | 697,096 | 942,319 | 214,954 | 2,393,159 | 11.8 | % | ||||||||||||||||||||||||||||||||
| Cost of sales | -341,924 | -491,201 | -638,688 | -152,338 | -1,616,641 | -297,836 | -424,428 | -629,151 | -124,536 | -1,469,183 | 10.0 | % | ||||||||||||||||||||||||||||||||
| Gross profit | 290,768 | 317,659 | 336,485 | 113,512 | 1,058,424 | 247,474 | 272,668 | 313,168 | 90,418 | 923,975 | 14.6 | % | ||||||||||||||||||||||||||||||||
| Gross margin | 46.0 | % | 39.3 | % | 34.5 | % | 42.7 | % | 39.6 | % | 45.4 | % | 39.1 | % | 33.2 | % | 42.1 | % | 38.6 | % | ||||||||||||||||||||||||
| Distribution and administrative expenses | -225,767 | -183,756 | -234,599 | -55,148 | -699,270 | -193,460 | -155,783 | -222,534 | -42,645 | -614,423 | 13.8 | % | ||||||||||||||||||||||||||||||||
| Corporate expenses (2) | -12,513 | -9,306 | 34.5 | % | ||||||||||||||||||||||||||||||||||||||||
| Operating income (3) | 65,001 | 133,903 | 101,885 | 58,364 | 346,640 | 54,014 | 116,885 | 90,633 | 47,773 | 300,247 | 15.5 | % | ||||||||||||||||||||||||||||||||
| Operating margin | 10.3 | % | 16.6 | % | 10.4 | % | 22.0 | % | 13.0 | % | 9.9 | % | 16.8 | % | 9.6 | % | 22.2 | % | 12.5 | % | ||||||||||||||||||||||||
| Adjusted EBITDA (4) | 105,026 | 172,350 | 151,035 | 73,034 | 488,932 | 87,487 | 146,325 | 134,926 | 58,806 | 418,239 | 16.9 | % | ||||||||||||||||||||||||||||||||
| Adjusted EBITDA margin | 16.6 | % | 21.3 | % | 15.5 | % | 27.5 | % | 18.3 | % | 16.0 | % | 21.0 | % | 14.3 | % | 27.4 | % | 17.5 | % | ||||||||||||||||||||||||
| Financial (expenses) income (net) | -35,708 | -39,320 | -9.2 | % | ||||||||||||||||||||||||||||||||||||||||
| Share of (loss) profit of investments accounted for using the equity method | 3,656 | 1,135 | 222.2 | % | ||||||||||||||||||||||||||||||||||||||||
| Other income (expenses) (5) | -21,428 | -8,163 | 162.5 | % | ||||||||||||||||||||||||||||||||||||||||
| Results by readjustement unit and exchange rate difference | -5,262 | -3,362 | 56.5 | % | ||||||||||||||||||||||||||||||||||||||||
| Net income before income taxes | 287,897 | 250,537 | 14.9 | % | ||||||||||||||||||||||||||||||||||||||||
| Income tax expense | -89,469 | -81,791 | 9.4 | % | ||||||||||||||||||||||||||||||||||||||||
| Net income | 198,428 | 168,747 | 17.6 | % | ||||||||||||||||||||||||||||||||||||||||
| Net income attributable to non-controlling interests | -1,263 | -362 | 248.6 | % | ||||||||||||||||||||||||||||||||||||||||
| Net income attributable to equity holders of the parent | 197,164 | 168,384 | 17.1 | % | ||||||||||||||||||||||||||||||||||||||||
| Net margin | 7.4 | % | 7.0 | % | ||||||||||||||||||||||||||||||||||||||||
| WEIGHTED AVERAGE SHARES OUTSTANDING | 947 | 947 | ||||||||||||||||||||||||||||||||||||||||||
| Earnings per share | 208 | 178 | ||||||||||||||||||||||||||||||||||||||||||
| Earnings per ADS | 1,250 | 1,067 | 17.1 | % | ||||||||||||||||||||||||||||||||||||||||
(1) Total may be different from the addition of the four countries because of intercountry eliminations.
(2) Corporate expenses partially reclassified to the operations.
(3) Operating Income considers Net Sales, Cost of Sales, Distribution Costs, and Administrative Expenses included in the Financial Statements filed with the Chilean Financial Market Comission and determined in accordance to IFRS.
(4) Adjusted EBITDA considers Net Sales, Cost of Sales, Distribution Costs, and Administrative Expenses included in the Financial Statements filed with the Chilean Financial Market Comission and determined in accordance to IFRS, plus Depreciation.
(5) Other income (expenses) includes the following lines of the income statement by function included in the published financial statements in the Financial Market Comission: "Other income", "Other expenses" and "Other (loss) gains".
| COCA-COLA ANDINA | |
| 3Q26 EARNINGS RELEASE | |
| www.koandina.com | |
| - 20 - |
Consolidated Income Statement
(In million Local currency)
| Third Quarter 2026 | Third Quarter 2025 | |||||||||||||||||||||||||||||||
| Argentina (3) | Brazil | Chile | Paraguay | Argentina (3) | Brazil | Chile | Paraguay | |||||||||||||||||||||||||
| IAS 29 | Nominal | Nominal | Nominal | IAS 29 | Nominal | Nominal | Nominal | |||||||||||||||||||||||||
| Total beverages volume (Million UC) | 39.0 | 92.1 | 75.1 | 19.8 | 40.7 | 85.6 | 74.4 | 20.0 | ||||||||||||||||||||||||
| Transactions (Million) | 184.9 | 492.9 | 422.8 | 136.3 | 196.3 | 454.8 | 428.3 | 133.6 | ||||||||||||||||||||||||
| Net sales | 316,913 | 1,559.0 | 320,647 | 595,294 | 328,659 | 1,368.0 | 313,615 | 577,771 | ||||||||||||||||||||||||
| Cost of sales | -174,064 | -977.3 | -212,318 | -347,438 | -181,954 | -846.0 | -211,270 | -346,091 | ||||||||||||||||||||||||
| Gross profit | 142,849 | 581.8 | 108,328 | 247,855 | 146,705 | 522.0 | 102,344 | 231,680 | ||||||||||||||||||||||||
| Gross margin | 45.1 | % | 37.3 | % | 33.8 | % | 41.6 | % | 44.6 | % | 38.2 | % | 32.6 | % | 40.1 | % | ||||||||||||||||
| Distribution and administrative expenses | -116,911 | -356.7 | -78,262 | -132,309 | -120,268 | -301.7 | -74,293 | -120,926 | ||||||||||||||||||||||||
| Operating income (1) | 25,938 | 225.0 | 30,066 | 115,547 | 26,437 | 220.3 | 28,051 | 110,754 | ||||||||||||||||||||||||
| Operating margin | 8.2 | % | 14.4 | % | 9.4 | % | 19.4 | % | 8.0 | % | 16.1 | % | 8.9 | % | 19.2 | % | ||||||||||||||||
| Adjusted EBITDA (2) | 46,848 | 298.7 | 46,668 | 150,331 | 48,604 | 279.9 | 43,248 | 140,843 | ||||||||||||||||||||||||
| Adjusted EBITDA margin | 14.8 | % | 19.2 | % | 14.6 | % | 25.3 | % | 14.8 | % | 20.5 | % | 13.8 | % | 24.4 | % | ||||||||||||||||
(1) Operating Income considers Net Sales, Cost of Sales, Distribution Costs, and Administrative Expenses included in the Financial Statements filed with the Chilean Financial Market Comission and determined in accordance to IFRS.
(2) Adjusted EBITDA considers Net Sales, Cost of Sales, Distribution Costs, and Administrative Expenses included in the Financial Statements filed with the Chilean Financial Market Comission and determined in accordance to IFRS, plus Depreciation.
(3) Argentina 2026 figures are presented in accordance to IAS 29, in September 2026 currency. 2025 figures are also presented in accordance to IAS 29, in September 2026 currency.
| COCA-COLA ANDINA | |
| 3Q26 EARNINGS RELEASE | |
| www.koandina.com | |
| - 21 - |
Consolidated Income Statement
(In million Local currency)
| Nine Months 2026 | Nine Months 2025 | |||||||||||||||||||||||||||||||
| Argentina (3) | Brazil | Chile | Paraguay | Argentina (3) | Brazil | Chile | Paraguay | |||||||||||||||||||||||||
| IAS 29 | Nominal | Nominal | Nominal | IAS 29 | Nominal | Nominal | Nominal | |||||||||||||||||||||||||
| Total beverages volume (Million UC) | 123.3 | 274.9 | 231.8 | 61.5 | 130.4 | 259.6 | 228.1 | 61.1 | ||||||||||||||||||||||||
| Transactions (Million) | 589.5 | 1,479.7 | 1,309.0 | 407.6 | 620.8 | 1,376.1 | 1,315.0 | 391.3 | ||||||||||||||||||||||||
| Net sales | 986,833 | 4,592.2 | 975,173 | 1,836,101 | 1,037,145 | 4,117.9 | 942,319 | 1,737,085 | ||||||||||||||||||||||||
| Cost of sales | -533,311 | -2,786.2 | -638,688 | -1,051,524 | -566,465 | -2,506.3 | -629,151 | -1,005,568 | ||||||||||||||||||||||||
| Gross profit | 453,522 | 1,806.0 | 336,485 | 784,577 | 470,680 | 1,611.6 | 313,168 | 731,517 | ||||||||||||||||||||||||
| Gross margin | 46.0 | % | 39.3 | % | 34.5 | % | 42.7 | % | 45.4 | % | 39.1 | % | 33.2 | % | 42.1 | % | ||||||||||||||||
| Distribution and administrative expenses | -352,137 | -1,043.0 | -234,599 | -379,036 | -367,949 | -920.8 | -222,534 | -344,142 | ||||||||||||||||||||||||
| Operating income (1) | 101,385 | 763.0 | 101,885 | 405,541 | 102,731 | 690.8 | 90,633 | 387,375 | ||||||||||||||||||||||||
| Operating margin | 10.3 | % | 16.6 | % | 10.4 | % | 22.1 | % | 9.9 | % | 16.8 | % | 9.6 | % | 22.3 | % | ||||||||||||||||
| Adjusted EBITDA (2) | 163,814 | 981.3 | 151,035 | 506,349 | 166,395 | 864.5 | 134,926 | 476,688 | ||||||||||||||||||||||||
| Adjusted EBITDA margin | 16.6 | % | 21.4 | % | 15.5 | % | 27.6 | % | 16.0 | % | 21.0 | % | 14.3 | % | 27.4 | % | ||||||||||||||||
(1) Operating Income considers Net Sales, Cost of Sales, Distribution Costs, and Administrative Expenses included in the Financial Statements filed with the Chilean Financial Market Comission and determined in accordance to IFRS.
(2) Adjusted EBITDA considers Net Sales, Cost of Sales, Distribution Costs, and Administrative Expenses included in the Financial Statements filed with the Chilean Financial Market Comission and determined in accordance to IFRS, plus Depreciation.
(3) Argentina 2026 figures are presented in accordance to IAS 29, in September 2026 currency. 2025 figures are also presented in accordance to IAS 29, in September 2026 currency.
| COCA-COLA ANDINA | |
| 3Q26 EARNINGS RELEASE | |
| www.koandina.com | |
| - 22 - |
Consolidated Balance Sheet
(In million Chilean pesos)
| Variation % | ||||||||||||||||||||
| ASSETS | 09-30-2026 | 12-31-2025 | 09-30-2025 | 12-31-2025 | 09-30-2025 | |||||||||||||||
| Cash + Time deposits + market. Securit. | 435,775 | 342,514 | 284,485 | 27.2 | % | 53.2 | % | |||||||||||||
| Account receivables (net) | 304,703 | 355,078 | 282,806 | -14.2 | % | 7.7 | % | |||||||||||||
| Inventories | 356,132 | 304,551 | 325,785 | 16.9 | % | 9.3 | % | |||||||||||||
| Other current assets | 45,813 | 30,910 | 65,805 | 48.2 | % | -30.4 | % | |||||||||||||
| Total Current Assets | 1,142,422 | 1,033,053 | 958,882 | 10.6 | % | 19.1 | % | |||||||||||||
| Property, plant and equipment | 2,961,309 | 2,536,914 | 2,567,164 | 16.7 | % | 15.4 | % | |||||||||||||
| Depreciation | -1,635,898 | -1,357,529 | -1,384,117 | 20.5 | % | 18.2 | % | |||||||||||||
| Total Property, Plant, and Equipment | 1,325,411 | 1,179,385 | 1,183,047 | 12.4 | % | 12.0 | % | |||||||||||||
| Investment in related companies | 96,646 | 87,088 | 89,389 | 11.0 | % | 8.1 | % | |||||||||||||
| Goodwill | 162,367 | 137,128 | 145,761 | 18.4 | % | 11.4 | % | |||||||||||||
| Other long term assets | 1,052,809 | 983,751 | 1,007,407 | 7.0 | % | 4.5 | % | |||||||||||||
| Total Other Assets | 1,311,822 | 1,207,967 | 1,242,557 | 8.6 | % | 5.6 | % | |||||||||||||
| TOTAL ASSETS | 3,779,655 | 3,420,405 | 3,384,486 | 10.5 | % | 11.7 | % | |||||||||||||
| Variation % | ||||||||||||||||||||
| LIABILITIES & SHAREHOLDERS' EQUITY | 09-30-2026 | 12-31-2025 | 09-30-2025 | 12-31-2025 | 09-30-2025 | |||||||||||||||
| Short term bank liabilities | 10,723 | 11,820 | 14,385 | -9.3 | % | -25.5 | % | |||||||||||||
| Current portion of bonds payable | 8,712 | 23,808 | 22,175 | -63.4 | % | -60.7 | % | |||||||||||||
| Other financial liabilities | 29,094 | 26,791 | 27,783 | 8.6 | % | 4.7 | % | |||||||||||||
| Trade accounts payable and notes payable | 548,919 | 582,499 | 498,200 | -5.8 | % | 10.2 | % | |||||||||||||
| Other liabilities | 110,762 | 85,495 | 136,931 | 29.6 | % | -19.1 | % | |||||||||||||
| Total Current Liabilities | 708,210 | 730,413 | 699,475 | -3.0 | % | 1.2 | % | |||||||||||||
| Long term bank liabilities | 108,288 | 104,961 | 104,326 | 3.2 | % | 3.8 | % | |||||||||||||
| Bonds payable | 1,129,041 | 991,601 | 1,015,338 | 13.9 | % | 11.2 | % | |||||||||||||
| Other financial liabilities | 75,577 | 95,234 | 76,978 | -20.6 | % | -1.8 | % | |||||||||||||
| Other long term liabilities | 339,694 | 301,643 | 314,714 | 12.6 | % | 7.9 | % | |||||||||||||
| Total Long Term Liabilities | 1,652,600 | 1,493,439 | 1,511,356 | 10.7 | % | 9.3 | % | |||||||||||||
| Minority interest | 41,317 | 39,155 | 38,136 | 5.5 | % | 8.3 | % | |||||||||||||
| Stockholders' Equity | 1,377,528 | 1,157,399 | 1,135,519 | 19.0 | % | 21.3 | % | |||||||||||||
| TOTAL LIABILITIES & SHAREHOLDERS' EQUITY | 3,779,655 | 3,420,405 | 3,384,486 | 10.5 | % | 11.7 | % | |||||||||||||
Financial Highlights
(In million Chilean pesos)
| Accumulated | Accumulated | Accumulated | ||||||||||
| 09-30-2026 | 12-31-2025 | 09-30-2025 | ||||||||||
| CAPEX (1) | ||||||||||||
| Chile | 44,530 | 78,059 | 47,543 | |||||||||
| Brazil | 62,777 | 116,342 | 85,676 | |||||||||
| Argentina | 34,815 | 42,702 | 28,448 | |||||||||
| Paraguay | 12,240 | 42,244 | 27,152 | |||||||||
| Total | 154,362 | 279,347 | 188,819 | |||||||||
| (1) Includes investments in fixed assets and software. |
| COCA-COLA ANDINA | |
| 3Q26 EARNINGS RELEASE | |
| www.koandina.com | |
| - 23 - |
SIGNATURES
Pursuant to the requirements of the Securities Exchange Act of 1934, the registrant has duly caused this report to be signed on its behalf by the undersigned, thereunto duly authorized, in the city of Santiago, Chile.
| EMBOTELLADORA ANDINA S.A. | ||
| By: | /s/ Andrés Wainer | |
| Name: | Andrés Wainer | |
| Title: | Chief Financial Officer | |
Santiago, October 27, 2026