As filed with the Securities and Exchange Commission on October 7, 2026.
Registration No. 333-
UNITED STATES
SECURITIES AND EXCHANGE COMMISSION
SECURITIES AND EXCHANGE COMMISSION
Washington, D.C. 20549
FORM S-1
REGISTRATION STATEMENT
UNDER
THE SECURITIES ACT OF 1933
THE SECURITIES ACT OF 1933
Centinel Spine Holdco, Inc.
(Exact name of registrant as specified in its charter)
| |
Delaware
|
| |
3841
|
| |
42-2132038
|
|
| |
(State or other jurisdiction of
incorporation or organization) |
| |
(Primary Standard Industrial
Classification Code Number) |
| |
(I.R.S. Employer
Identification Number) |
|
900 Airport Road, Suite 3B
West Chester, PA 19380
(484) 887-8810
West Chester, PA 19380
(484) 887-8810
(Address, including zip code, and telephone number, including area code, of registrant’s principal executive offices)
Steven Murray
Chief Executive Officer
Centinel Spine Holdco, Inc.
900 Airport Road, Suite 3B
West Chester, PA 19380
(484) 887-8810
Chief Executive Officer
Centinel Spine Holdco, Inc.
900 Airport Road, Suite 3B
West Chester, PA 19380
(484) 887-8810
(Name, address, including zip code, and telephone number, including area code, of agent for service)
Copies to:
| |
Yelena Barychev
Melissa Murawsky Shaun Snitman Leslie Marlow Blank Rome LLP One Logan Square Philadelphia, PA 19103 (215) 569-5500 |
| |
B. Shayne Kennedy
Ross McAloon Latham & Watkins LLP 650 Town Center Drive 20th Floor Costa Mesa, California 92626 (714) 540-1235 |
|
Approximate date of commencement of proposed sale to the public: As soon as practicable after this Registration Statement is declared effective.
If any of the securities being registered on this Form are to be offered on a delayed or continuous basis pursuant to Rule 415 under the Securities Act of 1933, check the following box. ☐
If this Form is filed to register additional securities for an offering pursuant to Rule 462(b) under the Securities Act, please check the following box and list the Securities Act registration statement number of the earlier effective registration statement for the same offering. ☐
If this Form is a post-effective amendment filed pursuant to Rule 462(c) under the Securities Act, check the following box and list the Securities Act registration statement number of the earlier effective registration statement for the same offering. ☐
If this Form is a post-effective amendment filed pursuant to Rule 462(d) under the Securities Act, check the following box and list the Securities Act registration statement number of the earlier effective registration statement for the same offering. ☐
Indicate by check mark whether the registrant is a large accelerated filer, an accelerated filer, a non-accelerated filer, smaller reporting company, or an emerging growth company. See the definitions of “large accelerated filer,” “accelerated filer,” “smaller reporting company,” and “emerging growth company” in Rule 12b-2 of the Exchange Act.
| |
Large accelerated filer
|
| | ☐ | | | | | Accelerated filer | | | ☐ | | |
| |
Non-accelerated filer
|
| | ☒ | | | | | |
Smaller reporting company
|
| | ☒ | |
| | | | | | | | | | |
Emerging growth company
|
| | ☒ | |
If an emerging growth company, indicate by check mark if the registrant has elected not to use the extended transition period for complying with any new or revised financial accounting standards provided pursuant to Section 7(a)(2)(B) of the Securities Act. ☐
The registrant hereby amends this registration statement on such date or dates as may be necessary to delay its effective date until the registrant shall file a further amendment which specifically states that this registration statement shall thereafter become effective in accordance with Section 8(a) of the Securities Act of 1933, as amended, or until the registration statement shall become effective on such date as the Securities and Exchange Commission, acting pursuant to said Section 8(a), may determine.
The information in this preliminary prospectus is not complete and may be changed. We may not sell these securities until the registration statement filed with the Securities and Exchange Commission is effective. This preliminary prospectus is not an offer to sell these securities and it is not soliciting an offer to buy these securities in any jurisdiction where the offer or sale is not permitted.
SUBJECT TO COMPLETION, DATED OCTOBER 7, 2026
Preliminary Prospectus
Shares

Class A Common Stock
This is the initial public offering of shares of Class A common stock, par value $0.0001 per share (“Class A Common Stock”), of Centinel Spine Holdco, Inc. (“Centinel Holdco”).
We are offering shares of our Class A Common Stock. Prior to this offering, there has been no public market for our Class A Common Stock. We anticipate that the initial public offering price will be between $ and $ per share. We intend to apply to list our Class A Common Stock on the New York Stock Exchange (“NYSE”) under the symbol “CNTL,” and this offering is contingent upon obtaining approval of such listing.
This offering is being conducted through what is commonly referred to as an umbrella partnership-C corporation (“Up-C”) structure, which is often used by partnerships and limited liability companies undertaking an initial public offering. The Up-C structure will allow certain existing owners (the “Continuing Equity Owners”) of Centinel Spine, LLC (“Centinel LLC”) to continue to own their equity ownership in Centinel LLC, in the form of Series B Common Units (as defined below), and to continue to realize tax benefits associated with owning interests in an entity that is treated as a partnership, or “flow-through” entity, for U.S. federal income tax purposes following the offering. We will issue to each Continuing Equity Owner such number of shares of our Class B common stock, par value $0.0001 per share (“Class B Common Stock”), which is equal to the number of Series B Common Units held by such Continuing Equity Owner. As a result, the Continuing Equity Owners will hold economic nonvoting units in Centinel LLC and noneconomic voting equity interests in the form of the Class B Common Stock in Centinel Holdco. Investors in this offering will, by contrast, hold their equity ownership in Centinel Holdco, which is a domestic corporation for U.S. federal income tax purposes, in the form of shares of Class A Common Stock. The Up-C structure provides potential future tax benefits for Centinel Holdco when the Continuing Equity Owners exchange their interests in Centinel LLC for, at our election, cash or Class A Common Stock of Centinel Holdco, since such exchange is expected to result in tax basis adjustments in the assets of Centinel LLC and produce favorable tax attributes for us.
In connection with this offering, we will enter into a Tax Receivable Agreement (as defined herein), which will require us to make cash payments to the Continuing Equity Owners and Blocker Stockholders (as defined herein) in respect of certain tax benefits to which we may become entitled, including as a result of exchanges by the Continuing Equity Owners of their interests in Centinel LLC, as described above. The Tax Receivable Agreement would confer significant economic benefits to the Continuing Equity Owners and Blocker Stockholders. We expect that the payments we will be required to make under the Tax Receivable Agreement will be substantial and could materially affect our liquidity. See “Organizational Structure,” “Risk Factors—Risks Related to Our Organizational Structure” and “Certain Relationships and Related Party Transactions—Tax Receivable Agreement.”
Following the completion of this offering, we will have two authorized classes of Common Stock: Class A and Class B (together, the “Common Stock”). Holders of the Class A Common Stock and Class B Common Stock will be entitled to one vote per share on all matters presented to our stockholders for their vote. All holders of Class A Common Stock and Class B Common Stock will vote together as a single class, except as otherwise required by applicable law. Holders of Class B Common Stock will not have any right to receive dividends or distributions upon the liquidation or winding up of Centinel Holdco.
We will use the net proceeds from this offering to purchase newly-issued Series A common units in Centinel LLC (the “Series A Common Units”). The purchase price for the Series A Common Units will be equal to the initial public offering price of the shares of Class A Common Stock, less the underwriting discounts and commissions referred to below. Centinel LLC will use the net proceeds it receives from us in connection with this offering as described under “Use of Proceeds.” Upon completion of this offering, we will hold Series A Common Units, representing approximately % of the economic interest in Centinel LLC (or Series A Common Units, representing approximately % of the economic interests in Centinel LLC, if the underwriters exercise in full their option to purchase additional shares of Class A Common Stock), and we will be the sole managing member of Centinel LLC and will operate and control its business. The Continuing Equity Owners will hold Series B common units in Centinel LLC (the “Series B Common Units” and, together with the Series A Common Units, the “LLC Units”), representing approximately % of the economic interests in Centinel LLC (or Series B Common Units, representing approximately % of the economic interests in Centinel LLC if the underwriters exercise in full their option to purchase additional shares of Class A Common Stock). Upon consummation of this offering, each Series B Common Unit will be, from time to time, exchangeable for, at our election, one share of Class A Common Stock or cash, as set forth in the Exchange Agreement. The holders of Series B Common Units will be required to deliver to us an equivalent number of shares of Class B Common Stock to effectuate an exchange. Any Series B Common Units and shares of Class B Common Stock so delivered to us will be cancelled, and Centinel LLC will issue us a number of Series A Common Units equal to the number of cancelled Series B Common Units.
We will be a holding company, and upon consummation of this offering and the application of the net proceeds therefrom, our sole asset will consist of direct or indirect ownership of Series A Common Units of Centinel LLC. Immediately following this offering, the holders of Class A Common Stock will collectively own 100% of the economic interests in Centinel Holdco and have % of the combined voting power of our outstanding shares of Class A Common Stock and Class B Common Stock (or % if the underwriters’ option to purchase additional shares is exercised in full). The Continuing Equity Owners, through ownership of our Class B Common Stock, will have no economic interests in Centinel Holdco and will have the remaining % of the combined voting power of our outstanding shares of Class A Common Stock and Class B Common Stock (or % if the underwriters’ option to purchase additional shares is exercised in full).
Immediately following the consummation of this offering, our principal stockholders and management will beneficially own approximately % of the combined voting power of our outstanding shares of Common Stock (or approximately % if the underwriters’ option to purchase additional shares is exercised in full), which will allow our principal stockholders and management to exercise significant control over matters subject to stockholder approval.
We are an “emerging growth company” and a “smaller reporting company,” as defined under the federal securities laws and, as such, have elected to comply with certain reduced public company reporting requirements in this prospectus and may elect to do so in future filings. See the section titled “Prospectus Summary—Implications of Being an Emerging Growth Company and a Smaller Reporting Company.”
Investing in shares of our Class A Common Stock involves a high degree of risk. See the section titled “Risk Factors” beginning on page 24.
| | | |
Per share
|
| |
Total
|
| ||||||
|
Initial public offering price
|
| | | $ | | | | | $ | | | ||
|
Underwriting discounts and commissions(1)
|
| | | $ | | | | | $ | | | ||
|
Proceeds, before expenses, to us
|
| | | $ | | | | | $ | | | | |
(1)
See the section titled “Underwriting” for additional disclosure regarding the estimated underwriting discounts and commissions and estimated offering expenses.
We have granted the underwriters an option for a period of 30 days to purchase up to an additional shares of Class A Common Stock from us at the initial public offering price, less the underwriting discounts and commissions.
The underwriters expect to deliver the shares of Class A Common Stock to purchasers on or about , 2026.
Neither the Securities and Exchange Commission nor any state securities commission has approved or disapproved of these securities or determined if this prospectus is truthful or complete. Any representation to the contrary is a criminal offense.
| |
Morgan Stanley
|
| |
Goldman Sachs & Co. LLC
|
| |
Piper Sandler
|
|
| |
Canaccord Genuity
|
| |
BTIG
|
|
The date of this prospectus is , 2026.
TABLE OF CONTENTS
| | | |
Page
|
| |||
| | | | | ii | | | |
| | | | | 1 | | | |
| | | | | 24 | | | |
| | | | | 97 | | | |
| | | | | 99 | | | |
| | | | | 101 | | | |
| | | | | 102 | | | |
| | | | | 110 | | | |
| | | | | 113 | | | |
| | | | | 115 | | | |
| | | | | 123 | | | |
We have not, and the underwriters have not, authorized anyone to provide you any information or to make any representations other than those contained in this prospectus or in any free writing prospectus prepared by or on behalf of us or to which we have referred you. Neither we nor the underwriters take responsibility for, or provide any assurance as to the reliability of, any other information others may give you. This prospectus is an offer to sell only the shares of Class A Common Stock offered hereby, and only under circumstances and in jurisdictions where it is lawful to do so. We are not, and the underwriters are not, making an offer to sell these securities in any jurisdiction where the offer or sale is not permitted. The information contained in this prospectus is accurate only as of the date of this prospectus, regardless of the time of delivery of this prospectus or any sale of the shares of our Class A Common Stock. Our business, financial condition, and results of operations may have changed since that date.
For investors outside the United States: We have not, and the underwriters have not, done anything that would permit this offering or the possession or distribution of this prospectus or any free writing prospectus in connection with this offering in any jurisdiction where action for that purpose is required, other than in the United States. Persons outside the United States who come into possession of this prospectus must inform themselves about, and observe any restrictions relating to, the offering of the shares of Class A Common Stock and the distribution of this prospectus outside the United States. See the section titled “Underwriting.”
i
ABOUT THIS PROSPECTUS
Basis of Presentation
In connection with the consummation of this offering, we will effect certain organizational transactions. Unless otherwise stated or the context otherwise requires, all information in this prospectus reflects the consummation of the organizational transactions and the offering of shares of our Class A Common Stock pursuant to this prospectus, which we refer to collectively as the “Organizational Transactions.” See the section titled “Organizational Structure” for a description of the Organizational Transactions and a diagram depicting our anticipated structure after giving effect to the Organizational Transactions, including this offering.
Unless the context otherwise requires, references in this prospectus to the “Company,” “Centinel,” “we,” “us,” “our,” and similar references refer: (i) following the consummation of the Organizational Transactions, including this offering, to Centinel Holdco, and, unless otherwise stated, all of its direct and indirect subsidiaries, including Centinel LLC, and (ii) prior to the completion of the Organizational Transactions, including this offering, to Centinel LLC and, unless otherwise stated, all of its direct and indirect subsidiaries.
Immediately following this offering and the application of net proceeds therefrom, we will be a holding company and the sole managing member of Centinel LLC, and our sole asset will consist of direct or indirect ownership of Series A Common Units of Centinel LLC. We will operate and control all the business and affairs of Centinel LLC and conduct our business through Centinel LLC and its subsidiaries. Centinel LLC will be the predecessor of the issuer, Centinel Holdco, for financial reporting purposes. Centinel Holdco will be the reporting entity following this offering.
The audited consolidated financial statements for the years ended December 31, 2025 and 2024 and the notes thereto, as well as the unaudited condensed consolidated financial statements for the three and six months ended June 30, 2026 and 2025 and the notes thereto, included in this prospectus represent the operations of Centinel LLC and its consolidated subsidiaries. In addition, except as disclosed in the accompanying prospectus, information related to the compensation of directors and named executive officers, and other information included in this registration statement are those of Centinel LLC and do not give effect to the Organizational Transactions.
The unaudited pro forma financial information of Centinel Holdco presented in this prospectus has been derived from the application of pro forma adjustments to the historical consolidated financial statements of Centinel LLC and its subsidiaries included elsewhere in this prospectus. These pro forma adjustments give effect to the Organizational Transactions, as described in the section titled “Organizational Structure,” including the consummation of this offering and other related transactions. The unaudited pro forma consolidated balance sheet as of June 30, 2026 gives effect to the Organizational Transactions as if they occurred on that date. The unaudited pro forma consolidated statements of operations for the year ended December 31, 2025 and for the six months ended June 30, 2026 have been prepared to illustrate the effects of the Organizational Transactions as if they occurred on January 1, 2025. See the section titled “Unaudited Pro Forma Consolidated Financial Information” for a complete description of the adjustments and assumptions underlying the unaudited consolidated pro forma financial information included in this prospectus.
Certain monetary amounts, percentages and other figures included in this prospectus have been subject to rounding adjustments. Percentage amounts included in this prospectus have not in all cases been calculated on the basis of such rounded figures, but on the basis of such amounts prior to rounding. For this reason, percentage amounts in this prospectus may vary from those obtained by performing the same calculations using the figures in our financial statements included elsewhere in this prospectus. Certain other amounts that appear in this prospectus may not sum due to rounding.
Trademarks, Trade Names and Service Marks
We own or have the rights to use various trademarks, service marks and trade names that we use in connection with the operation of our business. This prospectus may also contain trademarks, service marks and trade names of third parties, which are the property of their respective owners. Our use or display of third parties’ trademarks, service marks, trade names or products in this prospectus is not intended to, and does not, imply a relationship with, or endorsement or sponsorship by, us. Solely for convenience, the trademarks, service
ii
marks and trade names presented in this prospectus may appear without the ®, TM or SM symbols, but such references are not intended to indicate, in any way, that we will not assert, to the fullest extent under applicable law, our rights or the rights of the applicable licensor to these trademarks, service marks and trade names.
Market, Industry and Other Data
This prospectus contains estimates, statistical data and other information concerning our industry, market and competitive position from our own internal estimates and research, as well as from independent market research, industry and general publications and surveys, governmental agencies and publicly available information in addition to research, surveys and studies conducted by third parties. Internal estimates are derived from publicly available information released by industry analysts and third-party sources, our internal research and our industry experience, and are based on assumptions made by us based on such data and our knowledge of our industry and market, which we believe to be reasonable. In some cases, we do not expressly refer to the sources from which this data is derived. In that regard, when we refer to one or more sources of this type of data in any paragraph, you should assume that other data of this type appearing in the same paragraph is derived from the same sources, unless otherwise expressly stated or the context otherwise requires.
Industry data and other third-party information have been obtained from sources believed to be reliable, but we have not independently verified any third-party information. Any such third-party information, except to the extent specifically set forth in this prospectus, does not constitute a portion of this prospectus and is not incorporated herein. In addition, while we believe the industry, market and competitive position data included in this prospectus is reliable and based on reasonable assumptions, such data involve risks and uncertainties and are subject to change based on various factors, including those discussed in the section titled “Risk Factors.” These and other factors could cause results to differ materially from those expressed in the estimates made by the independent parties or by us.
The estimated market opportunities included in this prospectus represent the total overall revenue opportunity that we believe is available for our systems if 100% market share is achieved by us, and are not a representation that we will achieve any such market share. See “Risk Factors—Risks Related to Our Business and Industry—Our business plan relies on certain assumptions about the market for our implant systems, however, the size and expected growth of our addressable market has not been established with precision and may be smaller than we estimate, and even if the addressable market is as large as we have estimated, we may not be able to capture additional market share.”
Certain Definitions
As used in this prospectus, unless the context otherwise requires, the following capitalized terms have the meanings set forth below:
•
“Amended and Restated Centinel LLC Agreement” means the Ninth Amended and Restated Operating Agreement of Centinel Spine, LLC, to be effective immediately prior to the consummation of this offering.
•
“Assumed Centinel LLC Options” means all outstanding options to purchase incentive units of Centinel LLC that were issued pursuant to the Centinel LLC Incentive Plan and that are outstanding immediately prior to completion of the Organizational Transactions.
•
“Blocker Companies” means certain of the owners of limited liability company interests in Centinel LLC prior to the Organizational Transactions that are taxable as corporations for U.S. federal income tax purposes, consisting of Centinel Spine Holdings, Inc. and Delac Spine, Inc.
•
“Blocker Stockholders” means the owners of the Blocker Companies prior to the Organizational Transactions, who will exchange their interests in the Blocker Companies for shares of our Class A Common Stock in connection with the consummation of the Organizational Transactions.
•
“Centinel Holdco” means Centinel Spine Holdco, Inc.
•
“Centinel LLC” means Centinel Spine, LLC.
•
“Centinel LLC Agreement” means the Eighth Amended and Restated Limited Liability Company Agreement of Centinel Spine, LLC, as amended, which governs Centinel LLC prior to this offering.
iii
•
“Centinel LLC Incentive Plan” means the Centinel Spine, LLC Unit Incentive Plan, as amended.
•
“Class A Common Stock” means the Class A Common Stock, par value $0.0001 per share, of Centinel Holdco.
•
“Class B Common Stock” means the Class B Common Stock, par value $0.0001 per share, of Centinel Holdco.
•
“Class A Preferred Units” means the Class A Preferred Units of Centinel LLC prior to the Organizational Transactions.
•
“Class B Preferred Units” means the Class B Preferred Units of Centinel LLC prior to the Organizational Transactions.
•
“Class A Warrants” means the warrants to purchase 3,227,300 Class A Preferred Units of Centinel LLC, which warrants have an exercise price of $1.39435 per Class A preferred unit and expire on December 19, 2027.
•
“Class B Warrants” means the warrants to purchase 564,779 Class B Preferred Units of Centinel LLC, which warrants have an exercise price of $0.01 per Class B preferred unit and expire on dates varying between April 2033 through August 2033 (depending upon the issuance date of the particular Class B Warrant).
•
“Class A Warrant Holders” means the holders of the Class A Warrants.
•
“Class B Warrant Holders” means the holders of the Class B Warrants.
•
“Common Stock” means the Class A Common Stock and Class B Common Stock.
•
“Continuing Equity Owners” means, collectively, the owners of limited liability company interests in Centinel LLC immediately prior to or in connection with the consummation of the Organizational Transactions (excluding the Blocker Companies), which will also be holders of Series B Common Units and shares of our Class B Common Stock immediately following consummation of the Organizational Transactions, who may, following the consummation of this offering, exchange at each of their respective option, in whole or in part from time to time, their Series B Common Units for, at our election, cash or newly-issued shares of our Class A Common Stock. The holders of Series B Common Units will be required to deliver to us an equivalent number of shares of Class B Common Stock to effectuate an exchange, and any shares of Class B Common Stock and Series B Common Units so delivered will be canceled. See the section titled “Certain Relationships and Related Party Transactions—Amended and Restated Operating Agreement of Centinel LLC.”
•
“Convertible Debt Holders” means the holders of Convertible Notes.
•
“Convertible Notes” means Centinel LLC’s (i) subordinated convertible promissory notes in the aggregate principal amount of $46.0 million, with the maturity date ranging from November 2030 to May 2033 and current interest rate of 4.42% per annum (the “4.42% Convertible Notes”); and (ii) the subordinated convertible promissory note in the principal amount of $10.0 million, which is due on September 1, 2030 and has an interest rate of 6.0% per annum (the “6% Convertible Note”).
•
“Holdco Omnibus Plan” means the Centinel Spine Holdco, Inc. 2026 Omnibus Incentive Plan, to be effective upon the consummation of the Organizational Transactions.
•
“LLC Units” means the Series A Common Units and Series B Common Units following the consummation of the Organizational Transactions.
•
“LLC Unitholders” means the holders of LLC Units.
•
“Series A Common Units” means the Series A common units of Centinel LLC following the consummation of the Organizational Transactions.
•
“Series B Common Units” means the Series B common units of Centinel LLC following the consummation of the Organizational Transactions.
•
“Tax Receivable Agreement” means the tax receivable agreement entered into among Centinel Holdco, Centinel LLC and the TRA Parties.
•
“TRA Parties” means the Continuing Equity Owners and the Blocker Stockholders.
iv
PROSPECTUS SUMMARY
This summary highlights selected information contained in greater detail elsewhere in this prospectus and does not contain all of the information that you should consider in making your investment decision. Before investing in our Class A Common Stock, you should read the entire prospectus carefully, including the sections titled “Risk Factors,” “Special Note Regarding Forward-Looking Statements,” “Business,” and “Management’s Discussion and Analysis of Financial Condition and Results of Operations” and our consolidated financial statements and the related notes included elsewhere in this prospectus. Prior to the completion of this offering, we will effect certain organizational transactions. Unless otherwise stated or the context otherwise requires, all information in this prospectus reflects the consummation of the Organizational Transactions. See the section titled “Organizational Structure” for a description of the Organizational Transactions and a diagram depicting our anticipated structure after giving effect to the Organizational Transactions, including this offering.
Overview
We are a commercial-stage medical technology company with a singular mission to transform spine surgery by advancing motion-preserving solutions for the cervical and lumbar spine. We are exclusively focused on Total Disc Replacement (TDR), which we believe represents a fundamentally different and increasingly important approach to spine surgery compared to traditional fusion techniques that permanently eliminate motion. Our prodisc platform is designed to improve the long-term quality of life for patients suffering from chronic neck and back pain while preserving the spine’s natural movement. As a pure-play company dedicated solely to TDR, we believe our depth of experience, exclusive focus, and long history of clinical success uniquely position us to lead the continued evolution of spine surgery toward solutions designed to preserve motion.
Spine disorders are among the most common medical conditions in the United States, with chronic neck and back pain affecting approximately 100 million people each year. Individuals living with degenerative disc disease (DDD) represent a significant subset of this population. Surgical intervention, including spinal fusion and total disc replacement, are commonly performed for patients with DDD. Despite its widespread use, spinal fusion has inherent clinical limitations that we believe can contribute to less favorable outcomes for many patients. Fusion permanently eliminates movement at the treated level or levels of the cervical or lumbar spine, which can reduce patient flexibility and impact their ability to perform certain routine activities. By eliminating movement across one or more levels of the spine, the forces and stresses that would normally be distributed across the entire spinal column are instead concentrated on the adjacent, unfused segments of the spine. This altered motion and increased mechanical load on the adjacent discs may accelerate degeneration at these adjacent levels of the spine, a condition known as adjacent segment disease (ASD). Spinal lumbar fusion procedures are associated with higher rates of postoperative complications compared to TDR (Bai et. Al, Medicine, 2019). In addition, spinal fusion procedures can require longer recovery periods (Perez Albela et al, Spine, 2025), as the bone graft must fully incorporate and solidify to achieve structural stability, which can result in significant time away from work and daily activities and place a considerable burden on patients while contributing to higher indirect healthcare costs.
While TDR offers advantages over spinal fusion, some TDR offerings on the market may have drawbacks associated with their design or permitted applications. For example, some TDR implants employ a mobile core, where free translation (or disc movement) may occur upon the application of shear forces, potentially leading to instability. Some TDR implant offerings also utilize materials that may be susceptible to accelerated wear, particle generation, and long-term implant degradation. Other cervical TDR offerings include a narrow range of implant sizes and configurations, and other lumbar TDR offerings include a narrow range of indications (notably lacking FDA-approved two-level lumbar TDR implants), which may limit applicability across patient populations. In addition, we believe that certain surgical instrumentation used by other TDR offerings lacks ease of use, which may result in inconsistent surgical technique, steeper learning curves for adopting surgeons, longer operative times, and an increased risk of inadequate implant positioning.
From its inception, we developed the prodisc platform using a first-principles design approach intended to preserve spinal motion in a controlled and durable manner, avoiding both the permanent rigidity of spinal fusion and potential for excessive mobility of discs. The prodisc platform has four core advantages that we believe are essential for durable adoption of TDR: advanced kinematics, durable materials, a broad and configurable implant portfolio, and streamlined instrumentation.
1
The prodisc platform has been developed over more than 35 years as a comprehensive set of systems designed to give surgeons flexibility in addressing patient-specific anatomy, disease severity, and procedural objectives. Our portfolio includes four cervical TDR systems and one lumbar TDR system, all derived from a common motion-preserving design philosophy and supported by streamlined instrumentation. In the United States, our portfolio of five Class III devices is supported by two pre-market approval (PMA) approvals and two Panel-track PMA supplements supported by investigational device exemption (IDE) clinical studies, along with 49 additional PMA supplements, reflecting a long history of successful regulatory execution and continuous product innovation. PMA-designated products require successful human trials and long-term follow-up as opposed to the majority of orthopedic devices, which are approved through the 510(k) pathway. prodisc has received FDA approval for both one-level and two-level procedures across cervical and lumbar indications, making it the only TDR platform with FDA-approved multi-level indications in both regions of the spine. Across the platform, surgeons can select from close to 100 distinct implant configurations spanning fixation methods, endplate geometries, footprint shapes, disc heights, and surgical techniques. We refer to this as our Match-the-Disc philosophy, which we believe supports optimized patient fit, broader surgeon adoption, repeat utilization, and expansion from single-region use to both cervical and lumbar applications within the same clinical practice.
Underlying the prodisc platform is our proprietary prodisc CORE Technology, a fixed-core design that is engineered to deliver stable, predictable spinal kinematics while preserving motion at the treated level. This design incorporates a fixed center of rotation and an optimized curvature that is intended to maintain natural movement while avoiding unrestricted or uncontrolled motion that can place excess stress on nearby anatomy. By balancing stability with controlled movement, we believe CORE Technology supports normal spinal biomechanics and consistent implant performance over time. This foundational technology is deployed across our cervical and lumbar systems and is complemented by time-tested implant materials, including cobalt-chromium endplates, ultra-high molecular weight polyethylene inlays, and titanium surface coatings that have been used successfully for decades in spine and large-joint arthroplasty applications.
The prodisc platform is supported by what we believe is the most extensive body of peer-reviewed clinical evidence in TDR. More than 300,000 prodisc implantations have been performed worldwide, generating real-world clinical data published in over 590 peer-reviewed clinical papers evaluating outcomes, biomechanics, and long-term performance. This evidence base spans more than 35 years and includes over 60 studies reporting extended long-term follow-up outcomes. Published data demonstrate revision rates of less than 1% for prodiscL TDR over 7 to 21 year follow-up period (Marnay et al., JBJS, 2025), radiographic motion maintenance within a normal functional range in approximately 94% of patients following prodiscL TDR (Zigler JE et al., Spine, 2007), and, in a head-to-head study against spinal fusion, approximately four-fold fewer adjacent-level surgical interventions at seven years following prodiscC TDR compared to spinal fusion (Janssen et al., JBJS, 2015). In addition, TDR studies comparing prodiscL TDR with lumbar fusion demonstrate higher (91% versus 81%) neurological success rates (Zigler JE et al., Spine, 2007) and greater long-term improvement (73% versus 60%) in disability scores (Delamarter et al., JBJS, 2011), and a TDR study comparing multiple lumbar TDR solutions with lumbar fusion showed a 48% relative reduction in the risk of reoperations (Zigler JE et al., Global Spine Journal, 2018). Robust long-term clinical success of prodiscL TDR has also been demonstrated with maintained reductions in disability and pain scores observed through up to 21 years of postoperative follow-up of 1,187 patients with chronic lumbar DDD who underwent lumbar total disc arthroplasty (Marnay et al., JBJS, 2025). We believe the breadth, duration, and consistency of this evidence support physician confidence, payor engagement, and broader adoption of TDR.
We believe the evolution of spine surgery toward motion preserving solutions mirrors historical adoption patterns observed in other large orthopedic markets, including knee, hip, and shoulder, where treatment approaches have evolved over time from fusion- or fixation-based procedures to joint-preserving or joint-replacing solutions that restore or preserve motion. In each of these markets, motion-preserving solutions ultimately became the standard of care as patient preference, clinical evidence, surgeon familiarity, and the reimbursement landscape all matured. We believe the spine market is undergoing a similar transition, with increasing acceptance of TDR as a durable, motion-preserving alternative to fusion.
We have established a scaled commercial organization dedicated exclusively to TDR, with broad reach across the United States and selected international markets. In the United States, our commercial organization includes 48 sales management and clinical support professionals as of June 30, 2026, supported by more than
2
400 distributors, enabling engagement with the over 1,500 surgeons that performed a TDR procedure with prodisc in 2025. Internationally, we operate in 35 countries as of June 30, 2026, supported by 11 direct commercial employees and a network of stocking and non-stocking distributors. Our commercial infrastructure is complemented by structured surgeon education programs and targeted direct-to-patient initiatives designed to reduce adoption barriers, expand appropriate patient selection, and support increased utilization across both cervical and lumbar applications.
We believe the success of our commercial organization is reflected in the growing number of surgeons who perform TDR with prodisc, as well as the increasing utilization of prodisc among these surgeons. The chart below shows the number of surgeons in the United States who performed at least one TDR procedure with prodisc in the preceding four quarters, as well as high-volume users of prodisc. We define high-volume users as surgeons who performed twelve or more TDR procedures with prodisc over the prior four quarters, which we believe is indicative of deeper platform adoption within a surgeon’s clinical practice.
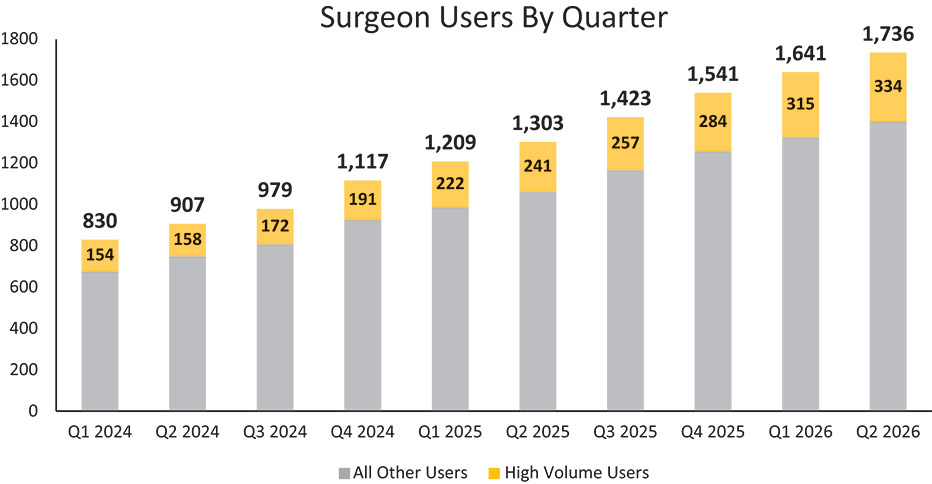
We have experienced significant growth in recent years as adoption and utilization of prodisc has accelerated. For the six months ended June 30, 2026, we generated net revenue of $85.2 million, representing an increase of 42% compared to the six months ended June 30, 2025. We recognized gross margin of 82% for the six months ended June 30, 2026, compared to a gross margin of 80% for the six months ended June 30, 2025. We had net income of $10.2 million for the six months ended June 30, 2026 compared to net loss of $0.5 million for the six months ended June 30, 2025. We also achieved Adjusted EBITDA of $15.5 million for the six months ended June 30, 2026, representing an increase of 137% compared to $6.6 million for the six months ended June 30, 2025. As of June 30, 2026, we had an accumulated deficit of approximately $188.4 million. For the year ended December 31, 2025, we generated net revenue of $132.2 million, representing growth of 39% compared to 2024. We recognized gross margin of 80% for the year ended December 31, 2025, compared to a gross margin of 77% for the year ended December 31, 2024. We had net loss of $4.3 million for the year ended December 31, 2025 compared to net loss of $12.1 million for the year ended December 31, 2024. We also achieved Adjusted EBITDA of $20.2 million for the year ended December 31, 2025, representing an increase of 241% compared to $5.9 million for the year ended December 31, 2024. Adjusted EBITDA is not a financial measure under GAAP. See the section titled “Management’s Discussion and Analysis of Financial Condition and Results of Operations—Non-GAAP Financial Measures” for an explanation of how we compute this non-GAAP financial measure and for the reconciliation to the most directly comparable GAAP financial measure.
Market Opportunity
DDD is a condition that can result when the intervertebral discs break down due to age, injury or wear and tear. DDD can result from the normal aging process and as the inner cores of intervertebral discs dehydrate,
3
lose elasticity and shrink. Over time, this disc dehydration can cause the discs to lose their normal height, leading to nerve root compression, which in turn leads to pain and reduced flexibility. The continued progression of DDD often results in worsening symptoms as disc degeneration can initiate a negative reinforcement cycle by damaging vertebral endplates, compressing nerve roots and impairing nutrient supply, leading to accelerated disc deterioration. DDD can cause debilitating pain, physical and psychological disability, and a reduced ability to work, significantly impacting quality of life for people with the condition.
Treatments for DDD
Treatment alternatives for DDD range from conservative, non-surgical therapies to surgical interventions, each addressing different phases of disease progression and patient needs. DDD is typically first managed with non-surgical and minimally invasive treatments. These methods usually involve a combination of physical therapy, medications for pain relief, injected therapeutics, spinal cord stimulators, and changes in daily habits and lifestyle modifications, all aimed at slowing progression of the disease and managing symptoms before resorting to more invasive treatments. However, these conservative approaches primarily focus on relieving pain and other symptoms rather than addressing or correcting the underlying structural damage to the disc. As the condition of the disc worsens, the loss of disc height and the resulting instability in the affected joint can become permanent, leading to increased damage and pain that may ultimately necessitate surgical treatment.
The most common instrumented treatments for DDD include: (i) spinal fusion, a procedure in which two or more adjacent vertebrae are connected together with implants to restore disc height, relieve nerve root compression, and provide stability, and (ii) total disc replacement (TDR), a procedure in which the damaged disc is replaced with a motion-preserving implant to restore disc height, relieve nerve root compression, provide stability as well as preserve motion.
Spinal Fusion
Spinal fusion involves permanently fusing together two or more levels of the spine to eliminate motion between the vertebrae or to realign them. Spinal fusions are typically performed on the cervical or lumbar regions of the spine, and implants may include devices such as plates, pedicle screw and rod systems and interbody spacers. We believe cervical and lumbar spinal fusion procedures are clinically limited compared to TDR in several ways, including:
•
Reduced range of motion
•
Longer recovery time
•
Increased reoperation rates
•
Higher complication rates
Total Disc Replacement (TDR)
Total disc replacement is the replacement of the damaged disc with a motion-preserving implant. TDR is a form of motion preservation surgery used in a variety of disease states for degenerative discs. It is currently more commonly performed as an alternative to spinal fusion, especially in the cervical region of the spine where the correction of multiple levels is sometimes required. TDR is becoming increasingly common in treating cervical and lumbar degenerative diseases, as it can preserve more natural biomechanics and maintain mobility. In contrast to cervical spinal fusion, which has been shown to result in increased pressure in adjacent disc spaces, TDR has not been shown to produce similar adjacent-level disc pressure (Delamarter et al., Spine, 2013). The implant in TDR usually consists of a middle synthetic material, acting as an artificial disc. This artificial disc is inserted between two metal components anchored into the vertebral bodies, securing the assembly between vertebrae.
We believe that TDR has many advantages over spinal fusion that in many cases can help to deliver more optimal treatment for patients suffering from DDD and a more cost-effective solution for the healthcare system:
•
Preservation of motion
4
•
Superior patient outcomes
•
Lower reoperation rates
•
Faster recovery times
•
High patient satisfaction
•
Superior procedure economics
We believe that while TDR offers many advantages over spinal fusion in the treatment of DDD, other TDR offerings on the market may have drawbacks. These include:
•
Unconstrained mobile core
•
Inadequate materials
•
Limited breadth of implant portfolio
•
Limited lumbar indications
•
Complex instrumentation process
Large, Underpenetrated, Fast-Growing Market Opportunity for TDR
The surgical treatment of degenerative disc disease (DDD) presents a significant and expanding opportunity within the global spine market. Based on data from the Orthopedic Network News 2025 Spinal Surgery Update, approximately 750,000 instrumented cervical and lumbar fusion procedures were performed in the United States in 2025. We believe this large procedural base represents a significant opportunity for TDR. Our initial market focus is on patients who we believe can be most effectively treated by our TDR technologies. Most targeted fusion procedures are for patients eligible for motion-preserving technology through an anterior surgical approach. Fusion procedures generally considered ineligible for TDR include, among others, cases involving trauma, severe facet joint disease or degeneration, osteoporosis or elevated risk of osteoporosis (defined as a DEXA T-score of -1.5 or lower), and certain types of cancer. Based on our analysis of the subset of spinal fusion procedures performed with an anterior approach as well as the clinical profile of patients eligible for TDR, we estimate that approximately 275,000 of these 750,000 annual instrumented cervical and lumbar fusion procedures could be addressable by TDR. In addition to these fusion procedures that we believe can be addressed by TDR, according to data from the Orthopedic Network News 2025 Spinal Surgery Update, approximately 58,000 TDR procedures were performed in the United States in 2025, which we believe highlights the significant current under penetration of TDR. Based on these combined procedure volumes, average selling price of approximately $5,500 per implant and approximately 1.34 levels treated per procedure, we estimate our total addressable market opportunity for TDR in cervical and lumbar spine in the United States to be approximately $2.5 billion, of which approximately two-thirds is in cervical spine and approximately one-third is in lumbar spine. Based on data provided by Grand View Research for the TDR market and data provided by iData Research for fusion market, the TDR and fusion markets grew at an estimated compound annual growth rate (“CAGR”) of approximately 7.7% and 0.6%, respectively, from 2022 to 2025. Based on this data and our analysis and knowledge of our industry, we believe this growth trend will continue over the near to medium term.
Additionally, we believe there also exists an opportunity outside of the United States to address the unmet need in the surgical treatment of DDD. We have a developing commercial presence internationally, selectively operating across 34 markets with sales channels spanning direct, hybrid agent, and indirect distributor models in regions including EMEA, Asia-Pacific, and Latin America.
Our Technology Platform and Products
The prodisc platform is the most comprehensive TDR platform and is supported by two pre-market approval (PMA) approvals and two Panel-track PMA supplements supported by IDE clinical studies, along with 49 additional PMA supplements spanning cervical and lumbar solutions for patients suffering from degenerative disc disease. The prodisc platform is organized to achieve defined treatment objectives: eliminating pain, providing stability, restoring function, and preserving motion across the entire spinal column. The prodisc platform achieves this through:
5
•
Advanced kinematics—The foundation of the prodisc platform is prodisc CORE, a novel application of the ball-and-socket design with a fixed center of rotation and an optimized curvature radius. Together, these two critical design features uniquely provide stability, resist shear forces, and facilitate controlled motion to protect the facet complex at the treated level. The fixed nature of the core, as opposed to a mobile or floating core, ensures the center of rotation remains stable throughout the life of the implant.
•
Durable materials—prodisc systems are constructed from time-tested, trusted materials with a proven track record in spine TDR and decades of success in large joint replacements.
•
Broad portfolio offering—Our portfolio features four distinct cervical systems and a lumbar system with multiple anatomical variations. Notably, prodisc is the only TDR platform to achieve FDA approval for both single- and two-level indications in the cervical and lumbar spine. Engineered with multiple size and height variations and endplate designs to precisely match the targeted vertebral level, the platform provides surgical optionality. The multi-level capabilities and device variations enable surgeons to Match-the-Disc to address diverse patient anatomies, varying degrees of disease severity, and individual surgeon preferences.
•
Streamlined instrumentation—The prodisc platform is supported by simplified, streamlined instrumentation, with just one instrument set supporting all configurations for the majority of our cervical portfolio, and one set supporting all configurations for our lumbar portfolio. This instrumentation model is designed to reduce procedural complexity and support reproducible workflows across hospital and ambulatory surgery center settings.
prodisc Cervical TDR Systems
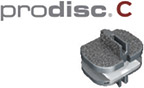
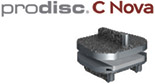
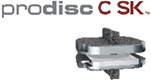
We offer four Cervical TDR systems: prodisc C, prodisc C Vivo, prodisc C SK, and prodisc C Nova. The following table summarizes our prodisc Cervical TDR portfolio as of June 30, 2026:
| |
Products
|
| |
Description
|
| |
Regulatory Overview of Primary Markets
|
|
| |
|
| |
•
Original cervical design
•
Flat endplate design
•
Large midline keel
|
| |
FDA PMA approved (single-level)
CE mark
|
|
| |

|
| |
•
Anatomically-designed domed endplate
•
Keel-less design with lateral spikes
•
One-step insertion
|
| |
FDA PMA approved (single-level and two-level)
CE mark
|
|
| |
|
| |
•
Flat endplate design
•
Low-profile tri-keel design
•
Optimized, simplified keel preparation
|
| |
FDA PMA approved (single-level and two-level)
CE mark
|
|
| |
|
| |
•
Flat endplate design
•
Low-profile “small” central keel
•
Optimized, simplified keel preparation
|
| |
FDA PMA approved (single-level and two-level)
|
|
prodisc Lumbar TDR Systems
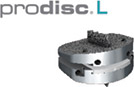
We offer one Lumbar TDR system: the prodisc L. The prodisc L platform includes the prodisc L Anatomic Endplates, which provides angulation in the inferior endplate, enabling the surgeon to better fit the disc to the patient’s anatomy. The following table summarizes our Lumbar TDR system portfolio as of June 30, 2026:
6
| |
Products
|
| |
Description
|
| |
Regulatory Overview of Primary Markets
|
|
| |
|
| |
•
Flat endplate design
•
Large central keel
•
Two-step insertion (endplates + inlay)
|
| |
FDA PMA approved (single-level and two-level)
CE mark
|
|
| |

|
| |
•
Four endplate constructs
•
Designed to provide the majority of angulation in the inferior endplate, reducing sacral slope
|
| |
FDA PMA approved (single-level and two-level)
CE mark
|
|
The prodisc lumbar TDR portfolio is the only PMA approved device for both single- and two-level indications, a regulatory distinction that we believe is a critical differentiator in the lumbar TDR market, where two-level payor coverage is growing and surgeon demand for multi-level TDR options is increasing.
Outside of the United States and countries accepting CE marked medical devices, our primary markets are Australia, South Korea, Switzerland and Taiwan, in which we have registrations for the following devices:
•
Australia: prodiscC Vivo, prodiscC Nova and prodiscL;
•
South Korea: prodiscC Vivo and prodiscL;
•
Switzerland: prodiscC Vivo, prodiscC Nova and prodiscL; and
•
Taiwan: prodiscC Vivo and prodiscL.
Our Success Factors
We believe that several key factors will lead to our success in improving spine care as the leading TDR company:
•
Large and Growing Market Opportunity with Significant Unmet Need for Motion Preserving Spine Surgery
•
Broad and Deep Portfolio of Disruptive TDR Solutions to Address the Limitations of Spine Surgery
•
Proprietary prodisc CORE Technology Platform Underpins Portfolio Differentiation
•
Substantial Body of Peer Reviewed Clinical Evidence Prove Benefits for Patients
•
Significant Regulatory Barriers to Entry Supported by PMA and PMA Supplement Approvals, and Robust IP
•
Established Commercial Organization with Broad Customer Reach
•
Established Reimbursement with Favorable Site-of-Care Economics
•
Experienced Management Team with Track Record of Value Creation
Our Growth Strategies
We intend to pursue the following growth strategies to expand our leadership as a pure-play TDR platform:
•
Expand Surgeon Education and Training on prodisc TDR
•
Increase Utilization and Broaden Use Among our Existing Surgeon Base
•
Expand and Scale Our U.S. Commercial Organization
•
Continue to Invest in Product Portfolio Expansion and Evidence Generation
•
Increase Patient Awareness Through Targeted Direct-to-Patient Education Initiatives
7
•
Pursue Disciplined International Expansion in Selected Markets
Recent Developments
Preliminary Estimated Selected Financial Results for the Three Months and Nine Months Ended September 30, 2026
Our financial results for the three months and nine months ended September 30, 2026 are not yet complete and will not be available until after the completion of this offering. Accordingly, set forth below are certain preliminary estimated selected unaudited financial results for the three months and nine months ended September 30, 2026 and the corresponding periods of the prior fiscal year. We have provided ranges, rather than specific amounts, for the three months and nine months ended September 30, 2026, because our closing procedures for the quarter-end financial closing process are not yet complete, these results are preliminary and subject to change, and there is a possibility that our actual results may differ materially from these preliminary estimates. These ranges are based on the information available to us as of the date of this prospectus.
These preliminary estimated results for the three months and nine months ended September 30, 2026 are derived from our preliminary internal financial records and are subject to revisions based on our procedures and controls associated with the completion of our financial reporting, including all the customary reviews and approvals, and completion by our independent registered public accounting firm of its review of such financial statements for the quarter ended September 30, 2026. These preliminary estimated results should not be viewed as a substitute for financial statements prepared in accordance with U.S. GAAP. Our independent registered public accounting firm, Ernst & Young LLP, has not audited, reviewed, compiled or performed any procedures with respect to this preliminary financial information and, accordingly, Ernst & Young LLP does not express an opinion or any other form of assurance with respect thereto. It is possible that we or our independent registered public accounting firm may identify items that would require us to make adjustments to the preliminary estimates set forth below as we complete our financial statements and that our actual results may differ materially from these preliminary estimates. Accordingly, undue reliance should not be placed on these preliminary estimates. These preliminary estimates are not necessarily indicative of any future period and should be read together with “Risk Factors,” “Special Note Regarding Forward-Looking Statements,” “Management’s Discussion and Analysis of Financial Condition and Results of Operations” and our financial statements and related notes included elsewhere in this prospectus.
| | | |
Three Months Ended September 30,
|
| |
Nine Months Ended September 30,
|
| | | | | ||||||||||||||||||||||||||||||||||||||
| | | |
2026
(estimated low) |
| |
2026
(estimated high) |
| |
2025 (actual)
|
| |
2026
(estimated low) |
| |
2026
(estimated high) |
| |
2025
(actual) |
| | | | | ||||||||||||||||||||||||||
| | | |
(unaudited)
(in thousands) |
| | | | | |||||||||||||||||||||||||||||||||||||||||
|
Preliminary estimated financial results:
|
| | | | | | | | | | | | | | | | | | | | | | | | | | | | | | | | | | | | | | | | | ||||||||
|
Net revenue
|
| | | $ | | | | | $ | | | | | $ | 31,935 | | | | | $ | | | | | $ | | | | | $ | 91,993 | | | | | | | ||||||||||||
|
Cost of sales
|
| | | | | | | | | | | | | | | | 6,292 | | | | | | | | | | | | | | | | | | 18,375 | | | | | | | | | | | | | | |
|
Gross profit
|
| | | | | | | | | | | | | | | | 25,643 | | | | | | | | | | | | | | | | | | 73,618 | | | | | | | | | | | | | | |
|
Total operating expenses
|
| | | | | | | | | | | | | | | | 22,272 | | | | | | | | | | | | | | | | | | 65,776 | | | | | | | | | | | | | | |
|
Operating income (loss)
|
| | | | | | | | | | | | | | | | 3,371 | | | | | | | | | | | | | | | | | | 7,842 | | | | | | | | | | | | | | |
For the three months ended September 30, 2026, we expect net revenue to be between $ million and $ million, compared to $31.9 million for the three months ended September 30, 2025. The expected increase in net revenue is primarily due to . For the nine months ended September 30, 2026, we expect net revenue to be between $ million and $ million, compared to $92.0 million for the nine months ended September 30, 2025. The expected increase in net revenue is primarily due to .
For the three months ended September 30, 2026, we expect cost of sales to be between $ million and $ million, compared to $6.3 million for the three months ended September 30, 2025. The expected increase in cost of sales is primarily due to . For the nine months ended September 30, 2026, we expect
8
cost of sales to be between $ million and $ million, compared to $18.4 million for the nine months ended September 30, 2025. The expected increase in cost of sales is primarily due to .
For the three months ended September 30, 2026, we expect gross profit to be between $ million and $ million, compared to $25.6 million for the three months ended September 30, 2025. The expected increase in gross profit is primarily due to . For the nine months ended September 30, 2026, we expect gross profit to be between $ million and $ million, compared to $73.6 million for the nine months ended September 30, 2025. The expected increase in gross profit is primarily due to .
For the three months ended September 30, 2026, we expect total operating expenses to be between $ million and $ million, compared to $22.3 million for the three months ended September 30, 2025. The expected increase in total operating expenses is primarily due to . For the nine months ended September 30, 2026, we expect total operating expenses to be between $ million and $ million, compared to $65.8 million for the nine months ended September 30, 2025. The expected increase in total operating expenses is primarily due to .
For the three months ended September 30, 2026, we expect operating income (loss) to be between $ million and $ million, compared to $3.4 million for the three months ended September 30, 2025. The expected change in operarting income (loss) is primarily due to . For the nine months ended September 30, 2026, we expect operating income (loss) to be between $ million and $ million, compared to $7.8 million for the nine months ended September 30, 2025. The expected change in operating income (loss) is primarily due to .
As of September 30, 2026, our cash and cash equivalents balance is expected to be $ million as compared to $20.0 million as of September 30, 2025.
Ownership and Organizational Structure
Centinel Holdco is a Delaware corporation formed on April 24, 2026 to serve as a holding company that will hold an interest in Centinel LLC. Prior to this offering and the Organizational Transactions, all of our business operations have been conducted through Centinel LLC and its direct and indirect subsidiaries. Centinel Holdco has not engaged in any business or other activities other than in connection with its formation and this offering. We will consummate the Organizational Transactions, excluding this offering, substantially concurrently with or prior to the consummation of this offering. Upon consummation of this offering and the application of the net proceeds therefrom, we will be a holding company and the sole managing member of Centinel LLC, and upon consummation of the Organizational Transactions, our sole asset will be the direct or indirect ownership of Series A Common Units and we will operate and control all of the business and affairs and consolidate the financial results of Centinel LLC.
In connection with the Organizational Transactions:
•
We will issue Class B Preferred Units of Centinel LLC to the Convertible Debt Holders of Centinel LLC’s outstanding 6% Convertible Note upon the conversion of the outstanding principal amount (plus accrued interest, if any) of the 6% Convertible Note at a conversion price of $1.39435 per unit;
•
We will issue Class B Preferred Units of Centinel LLC to the Convertible Debt Holders of Centinel LLC’s outstanding 4.42% Convertible Notes upon the conversion of the outstanding principal amount (plus accrued interest) of the 4.42% Convertible Notes at a conversion price of $1.39435 per unit, if and to the extent such Convertible Debt Holders convert their 4.42% Convertible Notes;
•
We will issue Class A Preferred Units of Centinel LLC to the Class A Warrant Holders, if and to the extent such Class A Warrant Holders exercise their Class A Warrants on a cashless basis;
•
We will issue Class B Preferred Units of Centinel LLC to the Class B Warrant Holders, if and to the extent such Class B Warrant Holders exercise their Class B Warrants on a cashless basis;
•
All outstanding Class A Preferred Units and Class B Preferred Units, including those that are issued upon conversion or exercise, as applicable, of the Convertible Notes, Class A Warrants and Class B Warrants will be converted into common units of Centinel LLC;
9
•
We will amend and restate the existing Centinel LLC Agreement, effective immediately prior to the consummation of this offering, to, among other things, (i) modify the capital structure of Centinel LLC by replacing the then current common units with two new series of common membership interests consisting of the Series A Common Units and the Series B Common Units and (ii) appoint Centinel Holdco as the sole managing member of Centinel LLC. See “—Amended and Restated Operating Agreement of Centinel LLC.”
•
In accordance with the terms of the Class A Warrants and Class B Warrants, Centinel LLC will issue replacement warrants to purchase Series B Common Units to the Class A Warrant Holders and Class B Warrant Holders that did not exercise their Class A Warrants and Class B Warrants, and the Class A Warrants and Class B Warrants will be terminated. The replacement warrants issued to each such Class A Warrant Holder will be exercisable into an equivalent number of Series B Common Units of Centinel LLC on a -to- basis (i.e., for each Class A Preferred Unit into which a Class A Warrant was exercisable, the replacement warrant shall be exercisable into Series B Common Units). The replacement warrants issued to each such Class B Warrant Holder will be exercisable into an equivalent number of Series B Common Units of Centinel LLC on a -to- basis (i.e., for each Class B Preferred Unit into which a Class B Warrant was exercisable, the replacement warrant shall be exercisable into Series B Common Units). In addition, upon the exercise of either replacement Class A Warrant or replacement Class B Warrant, the holder will also receive shares of Class B Common Stock, which will be equal to the number of Series B Common Units received upon such exercise.
•
We will amend and restate the certificate of incorporation of Centinel Holdco to, among other things, provide (i) for Class A Common Stock, with each share of our Class A Common Stock entitling its holder to one vote per share on all matters presented to our stockholders generally, (ii) for Class B Common Stock, with each share of our Class B Common Stock entitling its holder to one vote per share on all matters presented to our stockholders generally, (iii) that shares of our Class B Common Stock may only be held by the Continuing Equity Owners and their respective permitted transferees as described in “Description of Capital Stock—Common Stock—Class B Common Stock,” and (iv) for undesignated preferred stock, the rights, preferences and privileges of which may be designated from time to time by our Board, and which can be issued by our Board from time to time in one or more series without stockholder approval;
•
Centinel Holdco will acquire, by means of a series of sequential two-step mergers, the Blocker Companies as follows: (i) Centinel Holdco will form two new corporations: “CSH Merger Sub 1, Inc.” and “DS Merger Sub 2, Inc.,” and also form two limited liability companies: “CSH Legacy Blocker I, LLC” and “DS Legacy Blocker II, LLC”; (ii) CSH Merger Sub 1, Inc. will merge with and into Centinel Spine Holdings, Inc., with Centinel Spine Holdings, Inc. surviving, and each stockholder of Centinel Spine Holdings, Inc. exchanging its shares in Centinel Spine Holdings, Inc. for shares of Class A Common Stock in Centinel Holdco and the right to receive payments under the Tax Receivable Agreement. Centinel Spine Holdings, Inc., as the surviving corporation, would then merge into CSH Legacy Blocker I, LLC, with CSH Legacy Blocker I, LLC surviving. The Series B Common Units owned by CSH Legacy Blocker I, LLC through the mergers will be automatically cancelled and an equivalent number of Series A Common Units will be issued to CSH Legacy Blocker I, LLC. This process will be repeated for Delac Spine, Inc. with DS Merger Sub 2, Inc. and DS Legacy Blocker II, LLC;
•
We will issue shares of our Class B Common Stock to the Continuing Equity Owners, which will be equal to the number of Series B Common Units held by such Continuing Equity Owners, for nominal consideration;
•
We will assume all outstanding Centinel LLC Options issued pursuant to, and granted under, the Centinel LLC Incentive Plan, which Centinel LLC Options will become exercisable for shares of Class A Common Stock on a -for- basis;
•
We will sell and issue shares of our Class A Common Stock to the investors in this offering (or shares if the underwriters exercise in full their option to purchase additional shares of Class A Common Stock) in exchange for net proceeds of approximately $ million (or
10
approximately $ million if the underwriters exercise in full their option to purchase additional shares of Class A Common Stock) based upon an assumed initial public offering price of $ per share (the midpoint of the estimated price range set forth on the cover page of this prospectus), less the estimated underwriting discounts and commissions and estimated offering expenses payable by us;
•
We will use the net proceeds from this offering to purchase newly-issued Series A Common Units directly from Centinel LLC for approximately $ million, at a purchase price per Series A Common Unit equal to the initial public offering price per share of Class A Common Stock in this offering, less the underwriting discounts and commissions;
•
In accordance with the terms of the 4.42% Convertible Notes, the 4.42% Convertible Notes that did not convert into Class B Preferred Units of Centinel LLC as described above will be automatically converted into newly issued shares of Class A Common Stock (with the unpaid principal being converted at a conversion price equal to a 30% discount to the initial public offering price per share of Class A Common Stock);
•
Centinel LLC will issue to us a number of Series A Common Units equal to the number of shares of Class A Common Stock into which the 4.42% Convertible Notes were automatically converted as described in the previous paragraph;
•
Centinel Holdco will enter into (i) the Exchange Agreement with Centinel LLC and the Continuing Equity Owners, and (ii) the Tax Receivable Agreement with Centinel LLC, the Continuing Equity Owners and the Blocker Stockholders. For a description of the terms of the Exchange Agreement and the Tax Receivable Agreement, see “Certain Relationships and Related Party Transactions.”
Following the consummation of the Organizational Transactions:
•
Centinel Holdco will be a holding company and our principal asset will consist of Series A Common Units;
•
Centinel Holdco will be the sole managing member of Centinel LLC and will control the business and affairs of Centinel LLC;
•
Centinel Holdco will own, directly or indirectly, Series A Common Units, representing approximately % of the economic interest in Centinel LLC (or approximately % of the economic interest in Centinel LLC if the underwriters exercise in full their option to purchase additional shares of Class A Common Stock);
•
The Continuing Equity Owners will own (i) Series B Common Units, representing approximately % of the economic interest in Centinel LLC (or approximately % of the economic interest in Centinel LLC if the underwriters exercise in full their option to purchase additional shares of Class A Common Stock), and (ii) shares of Class B Common Stock, representing approximately % of the combined voting power of all of Centinel Holdco’s Common Stock (or shares of Class B Common Stock, representing approximately % of the combined voting power of all of Centinel Holdco’s Common Stock if the underwriters exercise in full their option to purchase additional shares of Class A Common Stock);
•
The Blocker Stockholders will own (i) shares of Class A Common Stock, representing approximately % of the combined voting power of all of Centinel Holdco’s Common Stock and approximately % of the economic interest in Centinel Holdco (or approximately % of the combined voting power and approximately % of the economic interest if the underwriters exercise in full their option to purchase additional shares of Class A Common Stock), and (ii) through Centinel Holdco’s ownership of Series A Common Units, indirectly will hold approximately % of the economic interest in Centinel LLC (or approximately % of the economic interest in Centinel LLC if the underwriters exercise in full their option to purchase additional shares of Class A Common Stock); and
•
The investors in this offering will own (i) shares of Class A Common Stock (or shares of Class A Common Stock if the underwriters exercise in full their option to purchase additional shares of Class A Common Stock), representing approximately % of the combined voting power of all of Centinel Holdco’s Common Stock and approximately % of the economic interest in
11
Centinel Holdco (or approximately % of the combined voting power and approximately % of the economic interest if the underwriters exercise in full their option to purchase additional shares of Class A Common Stock), and (ii) through Centinel Holdco’s ownership of Series A Common Units, indirectly will hold approximately % of the economic interest in Centinel LLC (or approximately % of the economic interest in Centinel LLC if the underwriters exercise in full their option to purchase additional shares of Class A Common Stock).
Our corporate structure following this offering, as described below, is commonly referred to as an Up-C structure, which is often used by partnerships and limited liability companies when they undertake an initial public offering of their business. The Up-C structure will allow the Continuing Equity Owners to retain their equity ownership in Centinel LLC and to continue to realize tax benefits associated with owning interests in an entity that is treated as a partnership, or “flow-through” entity, for U.S. federal income tax purposes following the offering. Investors in this offering will, by contrast, hold their equity ownership in Centinel Holdco, a Delaware corporation that is a domestic corporation for U.S. federal income tax purposes, in the form of shares of Class A Common Stock.
We believe that the Continuing Equity Owners generally will find it advantageous to hold their equity interests in an entity that is not taxable as a corporation for United States federal income tax purposes. The Continuing Equity Owners will be allocated their proportionate share of any taxable income of Centinel LLC. The Continuing Equity Owners will also hold shares of our Class B Common Stock. When the Continuing Equity Owners exchange Series B Common Units for, at our election, shares of our Class A Common Stock or cash, pursuant to the Exchange Agreement described below, they will also be required to deliver an equivalent number of shares of Class B Common Stock. Any Series B Common Units and shares of Class B Common Stock so delivered will be cancelled, and Centinel LLC will issue us a number of Series A Common Units equal to the number of cancelled Series B Common Units.
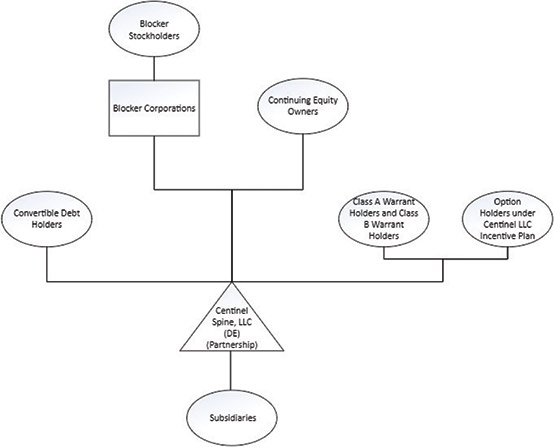
The diagram below depicts our historical organizational structure prior to the completion of the Organizational Transactions. This diagram is provided for illustrative purposes only and does not purport to represent all legal entities owned or controlled by us, or owning a beneficial interest in us.
12
The diagram below depicts our expected organizational structure immediately following completion of the Organizational Transactions. This diagram is provided for illustrative purposes only and does not purport to represent all legal entities owned or controlled by us, or owning a beneficial interest in us.
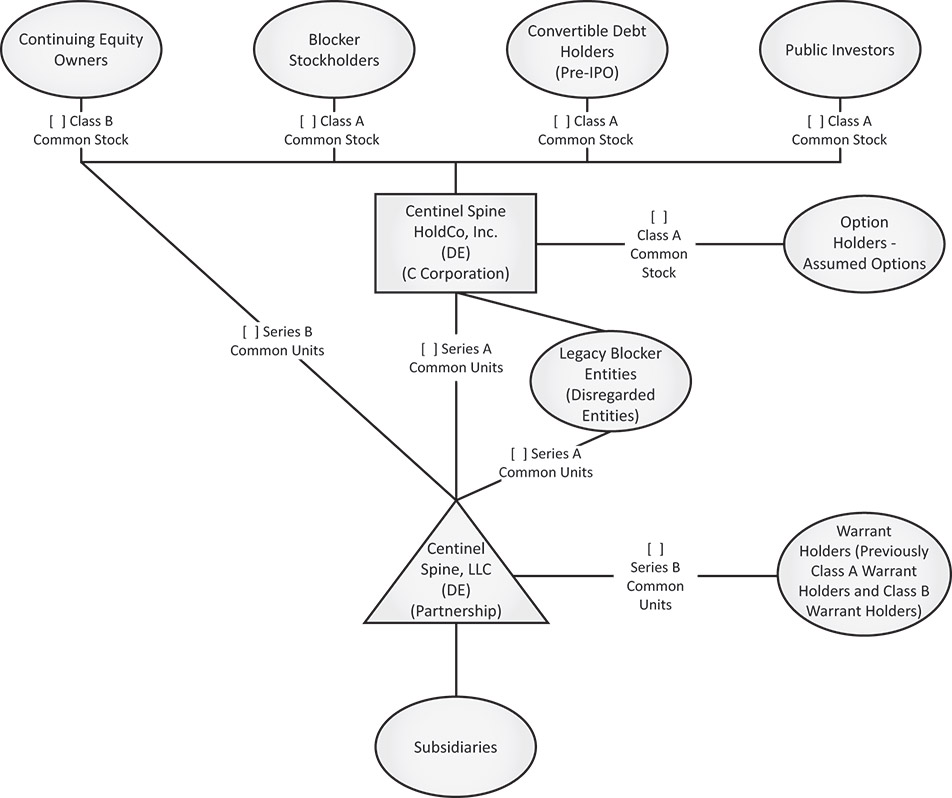
Prior to the completion of this offering, Centinel Holdco will also enter into the Exchange Agreement with Centinel LLC and the Continuing Equity Owners. Under the Exchange Agreement, the Continuing Equity Owners (and certain permitted transferees thereof) may (subject to the terms of the Exchange Agreement) exchange their Series B Common Units for, at our election, shares of our Class A Common Stock on a one-for-one basis or cash, as set forth in the Exchange Agreement. The holders of Series B Common Units will also be required to deliver to us an equivalent number of shares of Class B Common Stock to effectuate an exchange. Any shares of Class B Common Stock and Series B Common Units so delivered will be cancelled, and Centinel LLC will issue us a number of Series A Common Units equal to the number of cancelled Series B Common Units. As a holder exchanges its Series B Common Units of Centinel LLC, our interest in Centinel LLC will be correspondingly increased.
Prior to the completion of this offering, Centinel Holdco will enter into the Tax Receivable Agreement with Centinel LLC, the Continuing Equity Owners and Blocker Stockholders that provides for the payment by Centinel Holdco to such Continuing Equity Owners and Blocker Stockholders of 85% of certain tax benefits, if any, that Centinel Holdco actually realizes, or is deemed to realize (calculated using certain assumptions), as a result of (i) Centinel Holdco’s allocable share of existing tax basis in Centinel LLC’s assets acquired in this offering, (ii) increases in Centinel Holdco’s allocable share of existing tax basis and tax basis adjustments to the tangible and intangible assets of Centinel LLC as a result of sales or exchanges of LLC Units in connection with or after this offering, (iii) Centinel Holdco’s utilization of certain tax attributes (including any existing tax basis) of the Blocker Companies, which Centinel Holdco acquires in connection with this offering, and (iv) certain other tax benefits related to our entering into the Tax Receivable Agreement, including tax benefits
13
attributable to payments under the Tax Receivable Agreement. Sales or exchanges of LLC Units are expected to result in increases in the tax basis of the assets of Centinel LLC. The existing tax basis, increases in existing tax basis, and the tax basis adjustments generated over time may increase (for tax purposes) depreciation and amortization deductions available to Centinel Holdco and, therefore, may reduce the amount of U.S. federal, state, and local tax that Centinel Holdco would otherwise be required to pay in the future. Actual tax benefits realized by Centinel Holdco may differ from tax benefits calculated under the Tax Receivable Agreement as a result of the use of certain assumptions in the Tax Receivable Agreement, including the use of an assumed blended state and local income tax rate of % (as adjusted to take into account the U.S. federal tax benefit of such taxes) to calculate tax benefits. This payment obligation is an obligation of Centinel Holdco and not of Centinel LLC. See “Certain Relationships and Related Party Transactions—Tax Receivable Agreement.”
Summary of Risks Associated with Our Business
Our business is subject to a number of risks, of which you should be aware before making a decision to invest in our Class A Common Stock. These risks are more fully described in the section titled “Risk Factors” immediately following this prospectus summary. These risks include, among others, the following:
•
We depend entirely on sales of our prodisc products for our revenue. If we are unable to successfully achieve substantial market acceptance and adoption of our prodisc products, or any of our future products, or if confidence in our products is diminished, our business, financial condition, results of operations, and prospects would be harmed.
•
We have a limited history of commercializing certain of our products and have experienced periods of significant business changes in a short time, making it difficult for you to evaluate our business and future prospects. If we are unable to manage our business and any fluctuations in our business effectively, our business and growth prospects could be materially and adversely affected.
•
We have a history of net losses, we anticipate increasing expenses in the future, and we may not be able to maintain profitability.
•
Our business plan relies on certain assumptions about the market for our implant systems, however, the size and expected growth of our addressable market has not been established with precision and may be smaller than we estimate, and even if the addressable market is as large as we have estimated, we may not be able to capture additional market share.
•
We operate in a highly competitive business environment, and if we are unable to compete successfully against our existing or potential competitors, it could have a material adverse effect on our business, financial condition, results of operations, and prospects.
•
Our long-term growth depends on our ability to market, sell and improve our existing products and technologies, commercialize our existing products and products in development and develop new products and technologies through our research and development efforts, and if we fail to do so, we may not be able to increase our market share in the spine surgery market.
•
We may not be able to successfully demonstrate to surgeons the benefits of total disc replacement surgical approach compared to the traditional fusion procedures.
•
We may not be able to strengthen our brand and the brands associated with our products among patients.
•
If we are unable to educate hospitals, ambulatory surgery centers and other healthcare facilities on the benefits of using our products, our sales may decrease.
•
Pricing pressure from our competitors or hospitals may affect our ability to sell our products at prices necessary to support our current business strategies.
•
The proliferation of physician-owned distributorships could result in increased downward pricing pressure on our products or harm our ability to sell our products to surgeons who own or are affiliated with those distributorships.
•
If we fail to successfully enter into purchasing contracts for our products or engage in contract bidding processes internationally, we may not be able to receive access to certain hospital facilities and our sales may decrease.
14
•
If coverage or adequate levels of reimbursement from third-party payors for procedures using our products, or any future products we may seek to commercialize, are not obtained or maintained, surgeons and patients may be reluctant to use our systems and our business will suffer.
•
We face the risk of product liability claims that could be expensive, divert management’s attention and harm our reputation and business. We may not be able to maintain adequate product liability insurance.
•
Our results of operations will be materially harmed if we are unable to accurately forecast demand for our implant systems and maintain adequate levels of inventory.
•
We depend on third-party contract manufacturers, some of which are single source, to produce and package our products, and if these manufacturers fail to supply us with our products in sufficient quantities or at all, or in accordance with applicable regulatory requirements and our specifications, it will have a material adverse effect on our business, financial condition, and results of operations.
•
The loss of any member on our senior management or our inability to attract and retain highly skilled members of our sales management and marketing teams and engineers could have a material adverse effect on our business, financial condition and results of operations.
•
Protection of our intellectual property rights may be difficult and costly, and our inability to protect our intellectual property could adversely affect our competitive position.
•
We, our suppliers, and our third-party manufacturers are subject to extensive governmental regulation both in the U.S. and abroad.
•
Our principal asset after the completion of this offering will be our direct or indirect interest in Centinel LLC, and, as a result, we will depend on distributions from Centinel LLC to pay our taxes and expenses (including payments under the Tax Receivable Agreement) and pay dividends (if any). Centinel LLC’s ability to make such distributions may be subject to various limitations and restrictions.
Corporate Information
Centinel Holdco was incorporated in Delaware on April 24, 2026. Our principal executive offices are located at 900 Airport Road, Suite 3B, West Chester, Pennsylvania 19380, and our telephone number is (484) 887-8810. Our website address is https://www.centinelspine.com. The information contained on, or accessible through, our website is not incorporated by reference into this prospectus, and you should not consider any information contained in, or that can be accessed through, our website as part of this prospectus or in deciding whether to purchase our Class A Common Stock. We are a holding company and all of our business operations are conducted through, and substantially all of our assets are held by, our subsidiaries, including Centinel LLC.
Implications of Being an Emerging Growth Company and a Smaller Reporting Company
We are an emerging growth company as defined in the Jumpstart Our Business Startups Act of 2012 (the “JOBS Act”). We will remain an emerging growth company until the earliest of: (i) the last day of the fiscal year following the fifth anniversary of the consummation of this offering; (ii) the last day of the fiscal year in which we have total annual gross revenue of at least $1.235 billion; (iii) the last day of the fiscal year in which we are deemed to be a “large accelerated filer” as defined in Rule 12b-2 under the Securities Exchange Act of 1934, as amended (the “Exchange Act”), which would occur if the market value of our Class A Common Stock held by non-affiliates exceeded $700.0 million as of the last business day of the second fiscal quarter of such year; or (iv) the date on which we have issued more than $1.0 billion in non-convertible debt securities during the prior three-year period. An emerging growth company may take advantage of specified reduced reporting requirements and is relieved of certain other significant requirements that are otherwise generally applicable to public companies. As a result, the information that we provide to our stockholders may be different than you might receive from other public reporting companies in which you hold equity interests.
As an emerging growth company, we have elected to take advantage of certain reduced disclosure obligations in the registration statement that this prospectus is a part of, and may elect to take advantage of other reduced reporting requirements in future filings. In particular:
•
we will present in this prospectus only two years of audited financial statements, plus any required unaudited financial statements, and related section titled “Management’s Discussion and Analysis of Financial Condition and Results of Operations”;
15
•
we will avail ourselves of the exemption from the requirement to obtain an attestation and report from our independent registered public accounting firm on the assessment of our internal control over financial reporting pursuant to the Sarbanes-Oxley Act of 2002, as amended (the “Sarbanes-Oxley Act”);
•
we will avail ourselves of relief from compliance with the requirements of the Public Company Accounting Oversight Board regarding the communication of critical audit matters in the auditor’s report on the financial statements;
•
we will provide less extensive disclosure about our executive compensation arrangements; and
•
we will not be required to hold stockholder non-binding advisory votes on executive compensation or golden parachute arrangements.
In addition, the JOBS Act provides that an emerging growth company can take advantage of an extended transition period for complying with new or revised accounting standards. This provision allows an emerging growth company to delay the adoption of some accounting standards until those standards would otherwise apply to private companies. We have elected to use the extended transition period for any other new or revised accounting standards during the period in which we remain an emerging growth company; however, we may adopt certain new or revised accounting standards early.
We are also a “smaller reporting company” as defined in the Exchange Act. We may continue to be a smaller reporting company even after we are no longer an emerging growth company. We may take advantage of certain of the scaled disclosures available to smaller reporting companies and will be able to take advantage of these scaled disclosures for so long as the market value of our Class A Common Stock held by non-affiliates is less than $250.0 million measured on the last business day of our second fiscal quarter, or our annual revenue is less than $100.0 million during the most recently completed fiscal year and the market value of our Class A Common Stock held by non-affiliates is less than $700.0 million measured on the last business day of our second fiscal quarter.
16
The Offering
Class A Common Stock offered by us
shares
Underwriters’ option to purchase additional shares of Class A Common Stock
shares
Class A Common Stock to be outstanding immediately after the offering
shares (or shares if the underwriters exercise their option to purchase additional shares in full). If all outstanding Series B Common Units and shares of Class B Common Stock held by the Continuing Equity Owners were exchanged for newly-issued shares of Class A Common Stock on a one-for-one basis, then shares of Class A Common Stock would be outstanding.
Class B Common Stock to be outstanding immediately after the offering
shares. Immediately after this offering, the Continuing Equity Owners will own 100% of the outstanding shares of our Class B Common Stock.
Ratio of shares of Class A and Class B Common Stock to LLC Units
The amended and restated operating agreement of Centinel LLC will require that we and Centinel LLC at all times maintain a one-to-one ratio between the number of shares of Class A Common Stock and Class B Common Stock issued by us and the number of Series A Common Units and Series B Common Units owned by us and the Continuing Equity Owners, respectively (subject to certain exceptions for treasury shares and shares underlying certain convertible or exchangeable securities).
Voting
Each share of our Class A Common Stock entitles its holder to one vote on all matters to be voted on by stockholders generally.
Each share of our Class B Common Stock entitles its holder to one vote on all matters to be voted on by stockholders generally.
After this offering, each Continuing Equity Owner will hold a number of shares of Class B Common Stock equal to the number of Series B Common Units it owns. See “Description of Capital Stock—Class B Common Stock.”
Holders of our Class A Common Stock and Class B Common Stock will vote together as a single class on all matters presented to our stockholders for their vote or approval, except as otherwise required by applicable law.
Voting power held by holders of Class A Common Stock
% (or 100% if all outstanding shares of Class B Common Stock and Series B Common Units were exchanged for newly-issued shares of Class A Common Stock on a one-for-one basis).
Voting power held by holders of Class B Common Stock
% (or 0% if all outstanding shares of Class B Common Stock and Series B Common Units were exchanged for newly-issued shares of Class A Common Stock on a one-for-one basis).
17
Use of proceeds
We estimate that the net proceeds from the sale of our Class A Common Stock in this offering will be approximately $ million (or approximately $ million if the underwriters exercise their option to purchase additional shares in full), based on the assumed initial public offering price of $ per share, which is the midpoint of the price range set forth on the cover page of this prospectus, after deducting the underwriting discounts and commissions and estimated offering expenses payable by us.
We currently intend to use such net proceeds to purchase newly-issued Series A Common Units in Centinel LLC from Centinel LLC, as described under the section titled “Organizational Structure—Organizational Transactions.” The Series A Common Units will be purchased by us at a purchase price per unit equal to the initial public offering price per share of Class A Common Stock in this offering, less underwriting discounts and commissions.
In turn, Centinel LLC currently intends to use the proceeds received in respect of the newly-issued Series A Common Units to pay expenses incurred in connection with this offering and the Organizational Transactions; to repay the 2023 Credit Agreement; to pay down the Loan Agreement and the 2025 Credit Agreement, including the exit fee; to fund sales and marketing, including expanding the sales infrastructure, patient awareness platform and our medical education programs; to fund our research and development expenses, including our clinical trial expenses; to fund capital expenditures, including more instrument sets and implant inventory; and to use the remainder for general corporate purposes, including working capital and operating expenses. See the section titled “Use of Proceeds” for additional information.
Exchange rights of holders of the Series B Common Units
Prior to this offering, we will enter into the Exchange Agreement with Centinel LLC and the Continuing Equity Owners, so that the Continuing Equity Owners (and any permitted transferee thereof) may exchange Series B Common Units for, at our election, shares of Class A Common Stock on a one-for-one basis or cash, as set forth in the Exchange Agreement. The holders of Series B Common Units will be required to deliver to us an equivalent number of shares of Class B Common Stock to effectuate an exchange. Any Series B Common Units and shares of Class B Common Stock so delivered will be cancelled, and Centinel LLC will issue us a number of Series A Common Units equal to the number of cancelled Series B Common Units. See “Organizational Structure—Exchange Agreement.”
Tax Receivable Agreement
We will enter into the Tax Receivable Agreement with Centinel LLC, the Continuing Equity Owners and the Blocker Stockholders that will provide for the payment by us to such persons of 85% of the amount of certain tax benefits, if any, that Centinel Holdco actually realizes, or in some circumstances is deemed to realize (calculated using certain assumptions), as a result of (i) our allocable share of existing tax basis in Centinel LLC’s assets acquired in this offering, (ii) increases in our allocable share of existing tax basis and tax basis adjustments to the tangible and intangible assets of Centinel LLC as a result of sales or exchanges of LLC Units in connection with or after this offering, (iii) our utilization of certain tax attributes (including any existing tax basis) of the Blocker Companies, which we acquire in connection with
18
this offering, and (iv) certain other tax benefits related to our entering into the Tax Receivable Agreement, including tax benefits attributable to payments under the Tax Receivable Agreement. See “Organizational Structure—Tax Receivable Agreement” and “Certain Relationships and Related Party Transactions—Tax Receivable Agreement.”
Lock-Up Agreements
We, along with our directors, executive officers and substantially all of our other stockholders, have agreed with the underwriters that for a period of 180 days (the restricted period), after the date of this prospectus, subject to specified exceptions, we or they will not offer, pledge, sell or otherwise transfer or dispose of, directly or indirectly, any shares of Class A Common Stock or any securities convertible into or exercisable or exchangeable for shares of Class A Common Stock, or enter into any swap or other arrangement that transfers to another, in whole or in part, any of the economic consequences of ownership of the Class A Common Stock. See the section titled “Underwriting.”
Risk factors
You should carefully read “Risk Factors” on page 23 of this prospectus for a discussion of factors that you should consider before deciding to invest in our Class A Common Stock.
Proposed New York Stock Exchange symbol
“CNTL”
The number of shares of our Class A Common Stock that will be outstanding after this offering assumes the effectiveness of the Organizational Transactions and is based on (i) an assumed initial public offering price of $ per share, the midpoint of the price range set forth on the cover page of this prospectus, and (ii) shares of our Class A Common Stock and shares of our Class B Common Stock outstanding as of , 2026, assuming the sale and issuance of an aggregate of shares of our Class A Common Stock to investors in this offering and the issuance of shares of our Class B Common Stock to Continuing Equity Owners in connection with the Organizational Transactions. See the section titled “Organizational Structure.”
The number of shares of our Class A Common Stock to be outstanding immediately following the completion of this offering excludes:
•
shares of Class A Common Stock issuable upon exercise of the underwriters’ option to purchase additional shares of Class A Common Stock in the offering;
•
shares of Class A Common Stock that may be issuable to the Continuing Equity Owners upon exchange of Series B Common Units that will be held by the Continuing Equity Owners immediately following this offering;
•
shares of Class A Common Stock reserved for issuance upon the exercise of the outstanding Assumed Centinel LLC Options granted under the Centinel LLC Incentive Plan, which options we will assume in connection with the Organizational Transactions and which will become exercisable for shares of Class A Common Stock on a -for- basis; and
•
shares of Class A Common Stock that will be reserved for issuance under the Holdco Omnibus Plan, which will become effective in connection with this offering, as well as any future automatic increases in the number of shares of our Class A Common Stock reserved for issuance thereunder.
In addition, unless otherwise indicated in this prospectus or the context otherwise requires, the number of shares of Class A Common Stock outstanding and the other information based thereon reflects and assumes the following:
19
•
the filing and effectiveness of our amended and restated certificate of incorporation and the effectiveness of our amended and restated bylaws, each of which will occur immediately prior to the completion of this offering;
•
assumes an initial public offering price of $ per share of Class A Common Stock, which is the midpoint of the price range set forth on the cover page of this prospectus;
•
assumes no exercise by the underwriters of their option to purchase additional shares of Class A Common Stock from us; and
•
the effectiveness of the Organizational Transactions described in the section titled “Organizational Structure,” including without limitation the amendment and restatement of the Centinel LLC Agreement and the reclassification of all outstanding equity of Centinel LLC into Series A and Series B Common Units, which will occur immediately prior to the completion of this offering.
20
Summary Historical and Pro Forma Consolidated Financial Data
The following table shows summary historical and pro forma financial data for each of the periods indicated. The summary historical consolidated statements of operations data and summary historical consolidated statements of cash flow data presented below for the years ended December 31, 2025 and 2024 and the consolidated balance sheet data as of December 31, 2025 have been derived from, and should be read together with, our audited consolidated historical financial statements and the accompanying notes included elsewhere in this prospectus. The statement of operations data for the six months ended June 30, 2026 and 2025 and the balance sheet data as of June 30, 2026 have been derived from our unaudited condensed consolidated financial statements included elsewhere in this prospectus and are not necessarily indicative of results to be expected for the full year. The unaudited condensed consolidated financial statements have been prepared on the same basis as the audited financial statements and, in the opinion of management, reflect all adjustments, which include only normal recurring adjustments, necessary to present fairly our financial position as of June 30, 2026 and the results of operations for the six months ended June 30, 2026 and 2025. Our historical results are not necessarily indicative of results to be expected in future periods. The summary historical consolidated financial information of Centinel Holdco has not been presented. Centinel Holdco is a newly incorporated entity, has had no business transactions or activities to date and had no material assets or liabilities during the periods presented in this section.
The unaudited pro forma consolidated financial information of Centinel Holdco presented below as of and for the year ended December 31, 2025 has been derived by the application of pro forma adjustments to the historical consolidated financial statements of Centinel LLC and its subsidiaries included elsewhere in this prospectus. The unaudited pro forma condensed financial information is presented for illustrative purposes only and does not purport to represent the results of operations or the financial position that would actually have occurred had the pro forma events been consummated on the dates assumed or to project our results of operations or financial position for any future date or period. These pro forma adjustments give effect to the Organizational Transactions, as described in the section titled “Organizational Structure,” including the completion of this offering.
The summary unaudited consolidated pro forma financial information of Centinel Holdco presented below has been derived from the unaudited consolidated pro forma financial statements and notes included elsewhere in this prospectus. The summary unaudited consolidated pro forma financial information as of June 30, 2026 gives effect to the Organizational Transactions, as described in “Organizational Structure,” excluding, and the summary unaudited consolidated pro forma as adjusted financial information as of June 30, 2026 gives effect to these Organizational Transactions including, the consummation of this offering, the use of the net proceeds therefrom and related transactions, as described in “Use of Proceeds” and “Unaudited Pro Forma Consolidated Financial Information,” as if all such transactions had occurred on that date. The summary unaudited pro forma statements of operations for the year ended December 31, 2025 and the six months ended June 30, 2026 give effect to the Organizational Transactions, as described in “Organizational Structure,” including the consummation of this offering, the use of the net proceeds therefrom and related transactions, as described in “Use of Proceeds” and “Unaudited Pro Forma Consolidated Financial Information,” as if all such transactions had occurred on January 1, 2025. The pro forma adjustments are based on available information and upon assumptions that management believes are reasonable in order to reflect, on a pro forma basis, the effect of the pro forma events on our historical financial information. The adjustments are described in the notes to the unaudited pro forma condensed balance sheet and the unaudited pro forma condensed statements of operations. See the section titled “Unaudited Pro Forma Consolidated Financial Information” for a complete description of the adjustments and assumptions underlying the pro forma financial information included in this prospectus.
The summary information in the following tables should be read in conjunction with “About this Prospectus—Basis of Presentation,” “Risk Factors,” “Capitalization,” “Dilution,” “Management’s Discussion and Analysis of Financial Condition and Results of Operations of Centinel LLC,” “Unaudited Pro Forma Consolidated Financial Information” and our audited consolidated financial statements and accompanying notes included elsewhere in this prospectus.
21
| | | |
Centinel LLC Historical
|
| |
Pro Forma Centinel
Holdco |
| ||||||||||||||||||||||||||||||
| | | |
Six Months
Ended June 30, |
| |
Years Ended
December 31, |
| |
Six Months
Ended June 30, 2026 |
| |
Year Ended
December 31, |
| ||||||||||||||||||||||||
| | | |
2026
|
| |
2025
|
| |
2025
|
| |
2024
|
| |
2025
|
| |||||||||||||||||||||
| | | |
(in thousands, except share, unit, per share and per unit data)
|
| |||||||||||||||||||||||||||||||||
|
Consolidated Statements of Operations Data:
|
| | | | | | | | | | | | | | | | | | | | | | |||||||||||||||
|
Net Revenue
|
| | | $ | 85,244 | | | | | $ | 60,058 | | | | | $ | 132,163 | | | | | $ | 95,056 | | | | | $ | | | | | | $ | | | |
|
Cost of sales
|
| | | | 15,159 | | | | | | 12,083 | | | | | | 26,143 | | | | | | 22,232 | | | | | | | | | | | | | | |
|
Gross profit
|
| | | | 70,085 | | | | | | 47,975 | | | | | | 106,020 | | | | | | 72,824 | | | | | | | | | | | | | | |
| Operating expenses: | | | | | | | | | | | | | | | | | | | | | | | | | | | | ||||||||||
|
Selling and marketing
|
| | | | 42,151 | | | | | | 31,801 | | | | | | 67,497 | | | | | | 49,370 | | | | | | | | | | | | | | |
|
General and administrative
|
| | | | 12,092 | | | | | | 9,234 | | | | | | 19,157 | | | | | | 16,749 | | | | | | | | | | | | | | |
|
Research and development
|
| | | | 2,818 | | | | | | 2,469 | | | | | | 3,660 | | | | | | 4,954 | | | | | | | | | | | | | | |
|
Total operating expenses
|
| | | | 57,061 | | | | | | 43,504 | | | | | | 90,314 | | | | | | 71,073 | | | | | | | | | | | | | | |
|
Operating income
|
| | | | 13,024 | | | | | | 4,471 | | | | | | 15,706 | | | | | | 1,751 | | | | | | | | | | | | | | |
| Other income (expense): | | | | | | | | | | | | | | | | | | | | | | | | | | | | | | | | | | | | | |
|
Other income (expense), net
|
| | | | 3,885 | | | | | | 34 | | | | | | (9,359) | | | | | | (5) | | | | | | | | | | | | | | |
|
Foreign currency gain (loss)
|
| | | | (1,058) | | | | | | 4,089 | | | | | | 4,089 | | | | | | (1,830) | | | | | | | | | | | | | | |
|
Interest expense
|
| | | | (5,507) | | | | | | (5,489) | | | | | | (11,070) | | | | | | (12,141) | | | | | | | | | | | | | | |
|
Loss on extinguishment of debt
|
| | | | — | | | | | | (3,458) | | | | | | (3,458) | | | | | | — | | | | | | | | | | | | | | |
|
Total other expense, net
|
| | | | (2,680) | | | | | | (4,824) | | | | | | (19,798) | | | | | | (13,976) | | | | | | | | | | | | | | |
|
Net income (loss) before taxes
|
| | | | 10,344 | | | | | | (353) | | | | | | (4,092) | | | | | | (12,225) | | | | | | | | | | | | | | |
|
Income tax expense (benefit)
|
| | | | 108 | | | | | | 150 | | | | | | 229 | | | | | | (102) | | | | | | | | | | | | | | |
|
Net income (loss)
|
| | | | 10,236 | | | | | | (503) | | | | | | (4,321) | | | | | | (12,123) | | | | | | | | | | | | | | |
| Other comprehensive income (loss): | | | | | | | | | | | | | | | | | | | | | | | | | | | | | | | | | | | | | |
|
Foreign currency translation
|
| | | | 396 | | | | | | (1,434) | | | | | | (1,474) | | | | | | 473 | | | | | | | | | | | | | | |
|
Comprehensive income (loss)
|
| | | $ | 10,632 | | | | | $ | (1,937) | | | | | $ | (5,795) | | | | | $ | (11,650) | | | | | $ | | | | | | $ | | | |
|
Pro forma net loss attributable to noncontrolling interest
|
| | | | | | | | | | | | | | | | | | | | | | | | | | | | | | | | | | | | |
|
Pro forma net loss attributable to Centinel
Holdco |
| | | | | | | | | | | | | | | | | | | | | | | | | | | | | | | | | | | | |
|
Basic and diluted net loss per share
|
| | | | | | | | | | | | | | | | | | | | | | | | | | | | | | | | | | | | |
|
Shares used in basic and diluted per share
calculations |
| | | | | | | | | | | | | | | | | | | | | | | | | | | | | | | | | | | | |
22
| | | |
As of June 30, 2026
|
| |||||||||||||||
| | | |
Actual
|
| |
Pro Forma(1)
|
| |
Pro Forma
As Adjusted(2) |
| |||||||||
| | | |
(in thousands)
|
| |||||||||||||||
| Consolidated Balance Sheet Data: | | | | | | | | | | | | | | | | | | | |
|
Cash and cash equivalents
|
| | | $ | 25,106 | | | | | $ | | | | | | $ | | | |
|
Working capital(3)
|
| | | | 53,407 | | | | | | | | | | | | | | |
|
Total assets
|
| | | | 115,229 | | | | | | | | | | | | | | |
|
Warrant and derivative liabilities
|
| | | | 6,523 | | | | | | | | | | | | | | |
|
Convertible note payable
|
| | | | 62,139 | | | | | | | | | | | | | | |
|
Term notes payable
|
| | | | 12,498 | | | | | | | | | | | | | | |
|
Total liabilities
|
| | | | 168,933 | | | | | | | | | | | | | | |
|
Redeemable convertible Class A Preferred Units
|
| | | | 83,019 | | | | | | | | | | | | | | |
|
Redeemable convertible Class B Preferred Units
|
| | | | 50,406 | | | | | | | | | | | | | | |
|
Redeemable convertible Special Member Unit
|
| | | | — | | | | | | | | | | | | | | |
|
Common Units
|
| | | | — | | | | | | | | | | | | | | |
|
Incentive Units
|
| | | | — | | | | | | | | | | | | | | |
|
Total members’ deficit, actual; Stockholders’ equity, pro forma and pro forma as adjusted
|
| | | | (187,129) | | | | | | | | | | | | | | |
(1)
The consolidated pro forma balance sheet data give effect to the Organizational Transactions, excluding the consummation of this offering, the use of the net proceeds therefrom and related transactions.
(2)
The pro forma as adjusted consolidated balance sheet data give effect to the Organizational Transactions and further effect to our issuance and sale of shares of our Class A Common Stock offered in this offering at an assumed initial public offering price of $ per share, which is the midpoint of the price range set forth on the cover page of this prospectus, after deducting the underwriting discounts and commissions and estimated offering expenses payable by us. Each $1.00 increase (decrease) in the assumed initial public offering price of $ per share, the midpoint of the price range set forth on the cover page of this prospectus, would increase (decrease) each of our pro forma as adjusted cash and cash equivalents, working capital, total assets and total stockholders’ equity by approximately $ million, assuming that the number of shares offered by us, as set forth on the cover page of this prospectus, remains the same, and after deducting the underwriting discounts and commissions and estimated offering expenses payable by us. We may also increase or decrease the number of shares we are offering. Each increase (decrease) of 1,000,000 shares in the number of shares offered by us would increase (decrease) each of our pro forma as adjusted cash and cash equivalents, working capital, total assets and total stockholders’ equity by approximately $ million, assuming that the assumed initial offering price to the public remains the same, and after deducting the estimated underwriting discounts and commissions and estimated offering expenses payable by us.
(3)
We define working capital as current assets less current liabilities. See our consolidated financial statements and related notes thereto included elsewhere in this prospectus for further details regarding our current assets and current liabilities.
Non-GAAP Financial Measures
In addition to our results and measures of performance determined in accordance with U.S. GAAP, we believe that non-GAAP financial measures can be useful in evaluating and comparing our financial and operational performance over multiple periods, identifying trends affecting our business, formulating business plans and making strategic decisions. We utilize and present Adjusted EBITDA for these purposes. We define Adjusted EBITDA as net income (loss) before interest expense, income tax expense (benefit), depreciation and amortization, currency gain (loss), and other income (expense) as well as certain non-recurring items. The following table presents Adjusted EBITDA for each of the periods indicated (in thousands):
| | | |
Six Months Ended
June 30, |
| |
Year Ended
December 31, |
| ||||||||||||||||||
| | | |
2026
|
| |
2025
|
| |
2025
|
| |
2024
|
| ||||||||||||
|
Adjusted EBITDA(1)
|
| | | $ | 15,514 | | | | | $ | 6,551 | | | | | $ | 20,153 | | | | | $ | 5,906 | | |
(1)
Adjusted EBITDA is a non-GAAP financial measure. For a reconciliation of Adjusted EBITDA to the most directly comparable U.S. GAAP financial measure, information about why we consider such measure useful and a discussion of the material risks and limitations of such measure, please see “Management’s Discussion and Analysis of Financial Condition and Results of Operations—Non-GAAP Financial Measures.
23
RISK FACTORS
Investing in our Class A Common Stock involves a high degree of risk. You should carefully consider the risks described below, as well as the other information in this prospectus, including our financial statements and the related notes included elsewhere in this prospectus and the section titled “Management’s Discussion and Analysis of Financial Condition and Results of Operations,” before deciding whether to invest in our Class A Common Stock. The occurrence of any of the events or developments described below could have a material adverse effect on our business, financial condition, results of operations, and prospects. In such an event, the market price of our Class A Common Stock could decline, and you may lose all or part of your investment. Please also see the section titled “Special Note Regarding Forward-Looking Statements.” Additional risks and uncertainties not presently known to us or that we currently believe are not material may also impair our business, financial condition, results of operations and prospects.
Risks Related to Financial Matters and Our Capital Requirements
We depend entirely on sales of our prodisc products for our revenue. If we are unable to successfully achieve substantial market acceptance and adoption of our prodisc products, or any of our future products, or if confidence in our products is diminished, our business, financial condition, results of operations, and prospects would be harmed.
We expect that revenue from sales of our prodisc products will continue to account for all of our revenue for the foreseeable future. Continued and widespread market acceptance and adoption of our prodisc technology platform are critical to our future success. The size of our hospital and surgeon base, our ability to acquire new hospitals and surgeon users, and our ability to retain existing hospitals and surgeons are critical to our success as well. Thus, our commercial success will depend in large part on further adoption of prodisc technology platform by hospitals and surgeons, and an increase in the number of patients receiving personalized spine surgery with prodisc products.
Various factors can contribute to the growth in market acceptance of our prodisc products and the ability to effectively engage and retain hospitals and surgeons, and their use of the prodisc technology platform. For example, hospitals and surgeons may be reluctant to purchase or use prodisc products due to familiarity with other products that are well established and known to them. Our ability to grow our sales and drive market adoption will depend on the availability of coverage and adequate reimbursement for procedures using the prodisc technology platform from third-party payors, including government payors, or the willingness of patients to pay out-of-pocket in the absence of coverage and adequate reimbursement by third-party payors, including government payors. In addition, successfully educating hospitals, surgeons, and patients of the relative benefits of the prodisc technology platform compared to other products, as well as educating such hospitals, surgeons, and patients regarding the advantages and limitations of the prodisc technology platform, will be essential to our ability to grow sales of prodisc products and drive market acceptance and adoption. If hospitals and surgeons do not perceive our products to be useful, effective, reliable, and trustworthy, or if we are unable to provide sufficient training to hospitals and surgeons, we may not be able to attract or retain customers. Hospitals and surgeons may perceive the prodisc technology platform to be less useful if they lack familiarity or trust in the prodisc technology platform. In addition, negative clinical research results or publicity or an adverse change to published or unpublished guidelines or recommendations from third parties (including, without limitation, medical societies) relating to the use, clinical benefit, or risk profile of the prodisc technology platform in general or particular prodisc products, could result in negative perception by hospitals and surgeons, and could affect our brand and reputation. Similarly, regulatory bodies including notified bodies working with national competent authorities in the EU can add conditions to or suspend our certificates of conformity which can limit the uptake or use of prodisc products. Although subject to strict quality management systems the subject of regulations, issues of product quality can arise which would prevent the continued sale of prodisc products. While we constantly work to improve the prodisc technology platform, the technologies we work with are novel and complex, and we cannot assure you that there will not be negative reports on the prodisc technology platform in the future. Further, patients, hospitals, or surgeons who are dissatisfied with their experiences with any of our prodisc products may post negative reviews, and we may become the subject of blog, forum, or other social media postings that contain negative statements about us, which are outside of our control and may be inaccurate. Any negative publicity, whether real or perceived, disseminated by word-of-mouth, the general media, electronic or social networking platforms, competitor
24
materials, or other methods, could harm our reputation and brand. Lack of support for our products from hospitals or surgeons can affect how receptive other surgeons are to use the prodisc technology platform for their patients and could result in decreased demand for our products. Negative perception by hospitals or surgeons could also render us less attractive to future hospital customers, which could result in decreased sales of our products. A number of other factors, including the impacts of economic conditions and regulatory changes on hospital budgets and spending patterns, could potentially negatively affect the increase in adoption by hospitals and surgeons of the prodisc technology platform and demand for our products.
We have a limited history of commercializing certain of our products and have experienced periods of significant business changes in a short time, making it difficult for you to evaluate our business and future prospects. If we are unable to manage our business and any fluctuations in our business effectively, our business and growth prospects could be materially and adversely affected.
Centinel Spine, LLC was formed in 2017. We have obtained US marketing authorizations for certain of our products, and started the commercialization of two-level prodisc L in 2020, one-level prodisc C Vivo, prodisc C SK and prodisc C Nova in 2022, and two-level prodisc C Vivo and prodisc C SK in 2025, which makes evaluation of our future prospects difficult. Consequently, any predictions you make about our future success, performance, or viability may not be as accurate as they could be if we had more experience or a longer history of successfully developing and commercializing the prodisc technology platform. Since our inception, we have had periods of significant growth in revenue and employees, which have required us to scale the size of our organization as our business rapidly changed. Our growth objectives will require us to further expand our sales and marketing personnel. Our results of operations have fluctuated in the past, and our future quarterly and annual results of operations may fluctuate as we focus on increasing the demand for our products. Among other factors, future changes in the level of reimbursement for procedures using the prodisc products could have a significant impact on our results of operations, either positively or negatively. We may need to make business decisions that could adversely affect our results of operations and prospects, such as modifications to our pricing and reimbursement strategy, business structure, or operations.
The challenges we face in managing our business, including the changing reimbursement and regulatory landscapes, place significant demands on our management, financial, operational, manufacturing, technological, and other resources. We expect that managing our business will continue to place significant demands on our management and other resources and will require us to continue developing and improving our operational, financial, and other internal controls, reporting systems, and procedures. In particular, continued growth increases the challenges involved in a number of areas, including recruiting and retaining sufficient skilled personnel, providing adequate training and supervision to maintain our high-quality product standards and regulatory compliance, and preserving our culture and values. We may not be able to address these challenges in a cost-effective manner, or at all. As we grow, we may also need to invest significant resources to improve and expand our manufacturing partnerships, and we may not be able to do so in a cost-effective manner, or at all. We cannot assure you that any changes in scale, related quality, or compliance assurance, including those related to any future additional improvements and modifications to the prodisc technology platform, will be successfully implemented or that appropriate personnel will be available to facilitate the management of, and changes to, our business. Failure to implement necessary quality and compliance procedures, transition to new manufacturing processes or supply chains, or hire or maintain necessary personnel could result in higher costs or an inability to meet demand. In addition, our business is affected by general macroeconomic and business conditions around the world, including the impacts of inflation, increased interest rates, market instability, geopolitical conditions and conflicts, health crises, and natural disasters. If we do not effectively manage our business through the various challenges we face, we may not be able to execute our business plan, respond to competitive pressures, take advantage of market opportunities, satisfy patient and healthcare professional requirements, or maintain high-quality products, which could have a material adverse effect on our business, financial condition, results of operations, and prospects.
Our quarterly and annual results may fluctuate significantly and may not fully reflect the underlying performance of our business.
Our quarterly and annual results of operations, including our revenue, profitability, and cash flow, may vary significantly in the future, and period-to-period comparisons of our results of operations may not be
25
meaningful. Accordingly, the results of any one quarter or other period should not be relied upon as an indication of future performance. Our quarterly and annual financial results may fluctuate as a result of a variety of factors, many of which are outside our control and, as a result, may not fully reflect the underlying performance of our business. Factors that may cause fluctuations in our quarterly and annual results include, without limitation:
•
the level of demand for our prodisc products, which may vary significantly from period to period;
•
the rate at which we grow our sales force, and the cost and level of investment therein;
•
expenditures that we may incur to acquire, develop, or commercialize additional products and technologies;
•
the degree of competition in our industry and any change in the competitive landscape of our industry;
•
the timing and cost of obtaining regulatory approvals, clearances or certifications for future products;
•
any regulatory matters which lead to a suspension of sales of prodisc products for any period of time;
•
coverage and reimbursement policies with respect to the procedures using our prodisc products and potential future products that compete with our products;
•
the timing and success or failure of clinical studies, including clinical trials or clinical investigations, for our current or future products or any future products we develop or competing products;
•
the timing and cost of, and level of investment in, research, development, regulatory approval, and commercialization activities relating to our prodisc products, which may change from time to time;
•
the timing of medical procedures, the number of available selling days in a particular period, which can be impacted by a number of factors, such as holidays or days of severe inclement weather in a particular geography, the mix of prodisc products sold, and the geographic mix of where prodisc products are sold;
•
fluctuations in foreign currency exchange rates between the U.S. dollar (our reporting currency) and the local currency;
•
the cost of manufacturing our products, which may vary depending on the quantity of production and the terms of our agreements with third-party suppliers and manufacturers;
•
timing and adequacy of supply chain to meet demand;
•
natural or man-made disasters, outbreaks of disease or public health crises;
•
the timing and nature of any future acquisitions or strategic partnerships; and
•
future accounting pronouncements or changes in our accounting policies.
Because our quarterly and annual results may fluctuate, period-to-period comparisons may not be the best indication of the underlying results of our business and should only be relied upon as one factor in determining how our business is performing.
In addition, this variability and unpredictability could result in our failing to meet the expectations of industry or financial analysts or investors for any period. If our revenue or results of operations fall below the expectations of analysts or investors or below any forecasts we may provide to the market, it may result in a decrease in the price of our Class A Common Stock.
The seasonality of sales of our products creates variance in our quarterly revenue, which makes it difficult to compare or forecast our financial results.
Sales of our products may fluctuate on a seasonal basis, which affects the comparability of our results between periods. In particular, we have experienced and expect to continue to experience seasonality in our business. For example, we have traditionally experienced lower sales volumes in the months in and surrounding summer vacation and winter holiday periods as elective procedures generally decline during the summer months due to warmer weather and its corresponding impact on individual lifestyles, as well as during winter holidays for the international business. We expect these seasonal factors to become more pronounced in the future as our
26
business grows. These seasonal variations may vary amongst different markets and at times may be entirely unpredictable, which introduces additional risk into our business as we rely upon forecasts of demand to build inventory in advance of anticipated sales. In addition, we believe our limited history commercializing our products combined with our rapid growth has, in part, made our seasonal patterns more difficult to discern, making it more difficult to predict future seasonal patterns.
We have a history of net losses, we anticipate increasing expenses in the future, and we may not be able to maintain profitability.
We have incurred net losses since inception in 2017 until the six months ended June 30, 2026, and we cannot assure you that we will be able to sustain profitability in the future. For the six months ended June 30, 2026, we reported net income of $10.2 million compared to net loss of $0.5 million incurred for the six months ended June 30, 2025. As of June 30, 2026, we had an accumulated deficit of $188.4 million. For the years ended December 31, 2025 and 2024, we incurred net losses of $4.3 million and $12.1 million, respectively.
Since inception, we have spent significant amounts to develop our prodisc products, to fund clinical studies and gain FDA marketing authorization and equivalents in other countries for the prodisc products, to develop our manufacturing processes, to scale our commercial operations, and to recruit and retain key talent. Our expected future capital requirements may depend on many factors including the timing and speed of the expansion of our surgeon base and sales force and the timing and extent of spending on the development of our technology to increase our product offerings. We expect to continue to incur significant product development, research and development, clinical and regulatory, sales and marketing and other expenses. In addition, we expect that our general and administrative expenses will increase following this offering due to the additional costs associated with being a public company.
Our revenue may decline or our revenue growth may be constrained for a number of reasons, including reduced demand for our products, increased competition or inability to capitalize on growth opportunities. We cannot assure you that we will be able to sustain or increase profitability to offset our expenses. If our revenue growth does not increase to offset anticipated increases in our expenses, it could adversely affect our business, financial condition and results of operations.
We may need to raise additional funds in the future, and such funds may not be available on acceptable terms or at all.
To date, we have financed our operations principally from the sale of our equity, revenue from our operations and the incurrence of indebtedness. We will need additional funding to fund our operations but additional funds may not be available to us on acceptable terms on a timely basis, if at all. We may seek funds through borrowings or through additional rounds of financing, including private or public equity or debt offerings. If we raise additional funds by issuing equity securities, our stockholders may experience dilution. Any future debt financing into which we enter may impose upon us covenants that restrict our operations, including limitations on our ability to incur liens or additional debt, pay dividends, repurchase our Common Stock, make certain investments, and engage in certain merger, consolidation or asset sale transactions. Any future debt financing or additional equity that we raise may contain terms that are not favorable to us or our stockholders. If we are unable to raise additional capital or generate sufficient cash from operations to adequately fund our operations, we will need to curtail planned activities to reduce costs, which will likely harm our ability to execute on our business plan and continue operations.
Our debt financing agreements contain financial and operating restrictions that may limit our flexibility in operating our business. If we fail to comply with financial or other covenants in such agreements, our lenders may declare a default requiring us to immediately repay all of our indebtedness, which could have a material adverse effect on our business, financial condition and results of operations, and you could lose all or part of your investment in our company.
We entered into a Loan and Security Agreement, dated as of February 25, 2025 (the “Loan Agreement”), with SLR Investment Corp. (“SLR”) and the other lenders party thereto, pursuant to which we borrowed an aggregate principal amount of $60.0 million. We also entered into a Credit Agreement, dated as of February 25, 2025 (the “2025 Credit Agreement”), with Gemino Healthcare Finance, LLC d/b/a SLR Healthcare ABL (“Gemino”), pursuant to which we may borrow up to $5.0 million in revolving loans and
27
may request Gemino to increase the amount we may borrow up to $10.0 million. The obligations under the Loan Agreement and the 2025 Credit Agreement are secured by substantially all of our assets. As of June 30, 2026, the aggregate amount outstanding under the Loan Agreement was approximately $61.4 million.
We entered into a Credit Agreement, dated as of April 18, 2023, as amended (“2023 Credit Agreement”), with entities and trust controlled by some of our stockholders and board observers, pursuant to which we borrowed an aggregate principal amount of approximately $5.25 million. As of June 30, 2026, the aggregate amount outstanding under the 2023 Credit Agreement was approximately $12.5 million, which includes accrued interest and unamortized premium.
We entered into a Convertible Note Purchase Agreement, dated as of March 29, 2021, as amended, with Vision BioBanc Holdings (“Vision BioBanc”), pursuant to which we issued a convertible note in the principal amount of $10.0 million (the “6% Convertible Note”). As of June 30, 2026, the aggregate amount outstanding under the 6% Convertible Note was approximately $10.1 million. We entered into a Subordinated Convertible Promissory Note Purchase Agreement (the “Note Agreement”), dated November 17, 2021 and from that date to May 2024, we issued Subordinated Convertible Promissory Notes (the “4.42% Convertible Notes”) to various investors, including certain of our officers, directors and entities controlled by our directors under the form of such Note Agreement. As of June 30, 2026, the aggregate principal amount of the 4.42% Convertible Notes issued under the Note Agreement was $46.0 million, and the accrued interest on the 4.42% Convertible Notes was $6.9 million. Our obligations under the 2023 Credit Agreement, the 6% Convertible Note and 4.42% Convertible Notes are unsecured and subordinated to our obligations under the Loan Agreement and the 2025 Credit Agreement. As part of the Organizational Transactions, the outstanding principal amount of the 6% Convertible Note and the 4.42% Convertible Notes and accrued interest thereon will convert into shares of Class A Common Stock in connection with the completion of this offering.
As of the date of this prospectus we are, and upon the completion of the offering, we will continue to be, subject to certain covenants under the Loan Agreement and the 2025 Credit Agreement, imposing certain financial obligations on us, such as maintaining minimum revenue requirements, as well as limiting our ability to engage in specified types of transactions without the lenders’ prior consent, including, among other things, our ability to:
•
pay dividends;
•
sell, lease, transfer, assign or dispose of all or any part of our business or property, subject to certain exceptions;
•
engage in any business other than the businesses currently engaged in by us and our subsidiaries or reasonably related to such businesses;
•
merge or consolidate with, or acquire all or substantially all of the capital stock, shares or property of, another entity;
•
create, incur, assume, or be liable for any indebtedness, except for certain permitted indebtedness;
•
create, incur, allow, or suffer any lien on any of our property, except for certain permitted liens; and
•
make any investment other than certain permitted investments.
Such indebtedness could have significant consequences, including:
•
requiring a substantial portion of our cash flows to be dedicated to debt service payments instead of funding growth, working capital, capital expenditures, investments or other cash requirements;
•
reducing our flexibility to adjust to changing business conditions or obtain additional financing;
•
exposing us to the risk of increased interest rates as borrowings under the Loan Agreement and the 2025 Credit Agreement are at a variable rate, making it more costly to make interest payments if interest rates rise;
•
restricting us from making strategic acquisitions or causing us to make non-strategic divestitures;
•
subjecting us to restrictive covenants that may limit our flexibility in operating our business; and
28
•
limiting our ability to obtain additional financing for working capital, capital expenditures, debt service requirements and general corporate or other purposes.
We may not be able to comply with the financial covenants or any of the other covenants described above in the future. Our ability to comply with these covenants may be affected by events and factors beyond our control, and future breaches of any of these covenants could result in a default under the Loan Agreement and/or the 2025 Credit Agreement. In the absence of a waiver from our lenders, any defaults could cause all of the outstanding indebtedness under the Loan Agreement and the 2025 Credit Agreement to become immediately due and payable and the lenders could terminate commitments to extend further credit and foreclose on the collateral granted to it to collateralize such indebtedness, which could adversely affect our business, results of operations and financial position.
If we cannot comply with covenants under the Loan Agreement or the 2025 Credit Agreement and do not have or are unable to generate sufficient cash available to repay our debt obligations when they become due and payable, either upon maturity or in the event of a default, our assets could be foreclosed upon and we may not be able to obtain additional debt or equity financing on favorable terms, if at all, which could have a material adverse effect on our business, financial condition and results of operations. In addition, in such case, we may be unable to continue as a going concern, and you could lose all or part of your investment in our company. See “Management’s Discussion and Analysis of Financial Condition and Results of Operations—Liquidity and Capital Resources—Debt Obligations.”
Risks Related to Our Business and Industry
Our business plan relies on certain assumptions about the market for our implant systems, however, the size and expected growth of our addressable market has not been established with precision and may be smaller than we estimate, and even if the addressable market is as large as we have estimated, we may not be able to capture additional market share.
Our estimates of our addressable market are based on publicly-available information, a number of internal and third-party estimates and assumptions, including the prevalence of TDR and fusion procedures and management’s knowledge and experience in the TDR market. For example, we believe that the aging of the general population and increasingly active lifestyles will continue and that these trends will increase the demand for effective devices and implant systems to be used in connection with TDR procedures. Furthermore, the United States is the largest market for TDR, and any contraction in this market or incorrect assumptions about the current and future development of the market would have a material impact on our results of operations and financial condition. While we believe our assumptions and the data underlying our estimates are reasonable, these assumptions and our estimates may not be correct. The projected growth of TDR procedures and demand for our systems could materially differ from actual demand if our assumptions regarding these trends and acceptance of our systems by the medical community prove to be incorrect or do not materialize, or if non-surgical treatments or fusion techniques gain more widespread acceptance as a viable alternative to our systems or products. In addition, even if the number of people who undergo TDR procedures increases as we expect, technological or medical advances could provide alternatives to address DDD and reduce demand for TDR procedures or for our particular systems. As a result, our estimates of the addressable market for our current or future products may prove to be incorrect. Even if the total addressable market for our current and future products is as large as we have estimated, we may not be able to penetrate this market to capture additional market share for the reasons discussed in this “Risk Factors” section. The estimated market opportunities included in this prospectus represent the total overall revenue opportunity that we believe is available for our systems if 100% market share is achieved by us, and are not a representation that we will achieve any such market share. If the actual number of people who suffer from DDD who would benefit from TDR procedures with our systems, the price at which we can sell our current and future products or the addressable market for our systems and future products is smaller than we estimate, or if the total addressable market is as large as we have estimated but we are unable to capture additional market share, it could have a material adverse effect on our business, financial condition and results of operations.
29
We operate in a highly competitive business environment, and if we are unable to compete successfully against our existing or potential competitors, it could have a material adverse effect on our business, financial condition, results of operations, and prospects.
Our existing products and technologies are, and any new products or technologies we develop and commercialize will be, subject to intense competition. The medical device industry is highly competitive, subject to change and significantly affected by new product introductions and market activities of industry participants. Our ability to compete successfully will depend on our ability to develop products and technologies that reach the market in a timely manner, receive adequate coverage and reimbursement from third-party payors and are safer, less invasive and more effective than the products and technologies of our competitors. Because of the size of the potential market, we anticipate that our competitors may dedicate significant resources, potentially in excess of what we are able to dedicate towards developing competing products and technologies.
The medical device industry is highly competitive, subject to change and significantly affected by new product introductions and market activities of industry participants. Our products compete directly against TDR products offered by Medtronic PLC, Highridge, Inc., Globus Medical Inc., Spineart SA, Spineway Group, and Synergy Spine Solutions, Inc. and numerous other companies offering spinal implant products. Many of our competitors are large, well-capitalized companies with significantly greater financial, technical, marketing, sales, manufacturing and distribution resources than we have. As a result, they may be able to devote greater resources to the development, regulatory approval, marketing and sale of their products than we can.
At any time, these or other market participants may develop alternative treatments, products or procedures that compete directly or indirectly with our products. They may also develop and patent processes or products earlier than we can or obtain regulatory clearance, certification or approvals for competing products more rapidly than we can.
The frequent introduction by competitors of products that are marketed as alternatives to our existing or planned products may also make it difficult for surgeons and other health care providers to differentiate our products from competing products and may lead some of our competitors to employ pricing strategies that could adversely affect the pricing of our products and pricing in the spine surgery market generally.
In addition, we compete with our competitors to engage the services of distributors, both those presently working with us and those with whom we hope to work as we expand. If we are unable to compete successfully against our existing or potential competitors, our business, financial condition, results of operations, and prospects may be adversely affected, and we may not be able to grow at our expected rate, if at all.
Our long-term growth depends on our ability to market, sell and improve our existing products and technologies, commercialize our existing products and products in development and develop new products and technologies through our research and development efforts, and if we fail to do so, we may not be able to increase our market share in the spine surgery market.
In order to increase our market share in the spine surgery market, we must successfully market, sell and improve our existing products and technologies, commercialize our existing products and develop and commercialize new products and technologies through our research and development efforts in response to changing clinical and patients’ needs and competitive pressures. In the near-term, we plan to advance additional sizing options for both cervical and lumbar applications, develop new and updated instrumentation to support procedural efficiency and reproducibility, and invest in enabling technologies intended to assist surgeons with implant selection and procedural consistency. In March 2026, we engaged with the FDA through the pre-submission program for a hybrid indication (TDR adjacent to fusion) for the prodisc C TDR product family. In May 2026, we submitted the PMA supplement seeking a two-level indication for prodisc C and prodisc C Nova. To secure earlier approval for prodisc C Nova, we withdrew prodisc C from the PMA supplement. On September 9, 2026, the FDA approved the two-level indication for prodisc C Nova.
Our industry is characterized by significant competition, technological and scientific advances, new product introductions and enhancements, as well as evolving industry standards. There can be no assurance that other companies will not succeed in developing or marketing products and technologies that are more effective than our products and technologies or that would render our products and technologies obsolete or noncompetitive.
30
Additionally, new spine surgery procedures, medications and other therapies could be developed that replace or reduce the importance of any of our products and technologies. Accordingly, our business prospects depend in part on our ability to develop and commercialize new products and applications for our technology, including in new markets that develop as a result of technological and scientific advances, while improving the performance and cost-effectiveness of our existing products and technologies. Product and technology development is time-consuming and involves a high degree of risk and there can be no assurance that our product and technology development efforts will ultimately result in any commercially successful products. New technologies, techniques or products could emerge that might offer better combinations of price and performance than our existing products. It is important that we anticipate changes in technology and market demand, as well as in practices of healthcare facilities, surgeons and other healthcare providers, to successfully develop, obtain clearance, certification or approval, if required, and introduce new, enhanced and competitive products and technologies that meet clinical and patients’ needs on a timely and cost-effective basis.
We might be unable to successfully commercialize our existing products or develop and obtain regulatory clearances, certifications or approvals to market new products and technologies. Additionally, our products and technologies may not be accepted by the surgeons or third-party payors who reimburse for procedures performed using our products and technologies, or may not be successfully commercialized due to other factors, some of which are outside our control. The success of any new product or enhancement to an existing product or new technology will depend on numerous factors, including our ability to:
•
properly identify and anticipate clinical and patients’ needs;
•
develop and introduce new products, product enhancements and improvements and technologies in a timely manner;
•
adequately protect our intellectual property and avoid infringing upon the intellectual property rights of third parties;
•
demonstrate the safety and efficacy of new products and technologies; and
•
obtain the necessary regulatory clearances, certifications or approvals for new products or product enhancements and improvements.
If we do not develop or obtain regulatory clearances, certifications or approvals for new products or product enhancements and improvements in time to meet market demand, or if there is insufficient demand for these products or product enhancements and improvements, our results of operations will suffer and we will not be able to increase our market share in the spine surgery market. Our research and development efforts may require a substantial investment of time and resources before we are adequately able to determine the commercial viability of a new product, technology, material or other innovation. In addition, even if we are able to develop new products, product enhancements and improvements to existing products or technologies successfully, these new products, product enhancements and improvements or technologies may not produce sales in excess of the costs of development and such products may be rendered obsolete by changing clinical and patients’ preferences, introduction of products embodying new technologies or features or availability of products at lower costs.
Nevertheless, we must carefully manage the introduction and launch of our new products and technologies as well as the expansion of our product offerings. If potential surgeons or patients believe such products will offer enhanced features or be sold for a more attractive price, they may delay purchases until such products are available, which could result in excessive or obsolete inventory as we transition to new products and thereby adversely impact our business, financial condition and results of operations.
We may not be able to successfully demonstrate to surgeons the benefits of total disc replacement surgical approach compared to the traditional fusion procedures.
Surgeons play a significant role in determining the course of treatment and, ultimately, the type of products that will be used to treat a patient. As a result, our success depends, in large part, on our ability to effectively market and demonstrate to surgeons the merits of anterior approach and our products and technologies compared to those of our competitors. Acceptance of our products and technologies depends on educating surgeons as to the distinctive characteristics, clinical benefits, safety and cost-effectiveness of our products and technologies as compared to those of our competitors, and on training surgeons in the proper use of our
31
products. If we are not successful in convincing surgeons of the merits of our products and technologies or educating them on the use of our products, they may not use our products or may not use them effectively and we may be unable to increase our sales, sustain our growth or achieve and sustain profitability.
Surgeons may not be willing to move away from their long-lasting practice of fusion surgery procedures and adopt our motion preservation for the following reasons, among others:
•
lack of experience with our products and technologies;
•
existing relationships with competitors and distributors that sell competitive products;
•
lack or perceived lack of evidence supporting additional patient benefits;
•
perceived liability risks generally associated with the use of new products, technologies and procedures;
•
less attractive availability of coverage and reimbursement by third-party payors compared to procedures using competitive products and other techniques; and
•
the time commitment that may be required for training.
In addition, although we continue to invest in surgeon engagement by providing surgeons with the necessary training in our products and technologies, our efforts to expand surgeon engagement and training may not be successful and the surgeons may choose to use the products of our larger, more established competitors because of their broad and comprehensive product offerings.
We believe recommendations and support of our products and technologies by influential surgeons and key opinion leaders in our industry are essential for market acceptance and establishment of our products and technologies as a standard of care. If we do not receive broad support from such surgeons and key opinion leaders, or if the benefits offered by our products and technologies are not sufficient to justify their cost, surgeons, hospitals and other healthcare facilities may not use our products and we may not remain competitive in the market, our revenue growth may slow or decline, and we may not be able to grow at our expected rate, or at all.
We may not be able to strengthen our brand and the brands associated with our products among patients.
We believe that strengthening the Centinel Spine brand and the brands associated with our products is critical to achieving widespread acceptance of our products, particularly because of the rapidly developing nature of the market for spinal implants. In addition to physician awareness, we have developed and continue to execute our direct-to-patient (DTP) education initiatives designed to increase awareness and understanding of total disc replacement and to support more informed discussions between patients and spine surgeons. To better engage these patients, we have developed a patient education and support program called rediscover, which serves as the central platform for our direct-to-patient education and engagement efforts. The rediscover program is designed to provide patients with educational content, practical guidance, and peer perspectives to help them understand when and how total disc replacement may be considered, how it differs from fusion, and how to prepare for conversations with surgeons trained in motion preservation.
Promoting and positioning our brands will depend largely on the success of our marketing efforts and the reliability of our products, and these brand promotion activities may not help us strengthen our brand and the brands of our products or yield increased sales and, even if they do, any sales increases may not offset the expenses we incur to promote our brand and our products. If we fail to successfully promote and maintain our brands, or if we incur substantial expenses in an unsuccessful attempt to promote and maintain our brand and the brands of our products, our products may not gain broad market acceptance, which would cause our sales to decrease and would adversely affect our business, results of operations and financial condition.
If we are unable to educate hospitals, ambulatory surgery centers and other healthcare facilities on the benefits of using our products, our sales may decrease.
In order for surgeons to use our products at hospitals, ambulatory surgery centers (“ASCs”), and other healthcare facilities, we are often required to obtain approval from those hospitals, ASCs and healthcare facilities. Typically, hospitals, ASCs and healthcare facilities review the comparative effectiveness and cost of products used in the facility. The makeup and evaluation processes for healthcare facilities vary considerably,
32
and it can be a lengthy, costly and time-consuming effort to obtain approval by the relevant healthcare facilities. Additionally, hospitals, ambulatory surgery centers, other healthcare facilities and group purchasing organizations, or GPOs, which manage purchasing for multiple facilities, may also require us to enter into a purchase agreement and satisfy numerous elements of their administrative procurement process, which can also be a lengthy, costly, and time-consuming effort. If we do not obtain access to hospitals, ASCs and other healthcare facilities in a timely manner, or at all, via their approvals or purchase contract processes, or otherwise, or if we are unable to obtain approvals or secure contracts in a timely manner, or at all, our operating costs will increase, our sales may decrease and our operating results may be adversely affected. Furthermore, we may expend significant efforts on these costly and time-consuming processes but may not be able to obtain necessary approvals or secure a purchase contract from such hospitals, ambulatory surgery centers, healthcare facilities or GPOs.
Pricing pressure from our competitors or hospitals may affect our ability to sell our products at prices necessary to support our current business strategies.
Medical device companies, healthcare systems and GPOs have intensified competitive pricing pressure as a result of industry trends and new technologies. Purchasing decisions are gradually shifting to hospitals, integrated health networks, or IDNs, and other hospital groups, and away from individual surgeons and other physicians. Changes in the purchasing behavior of hospitals or the amount third-party payors are willing to reimburse our customers for procedures using our products, including those as a result of healthcare reform initiatives, could create additional pricing pressure on us. In addition to these competitive forces, we continue to see pricing pressure as hospitals introduce new pricing structures into their contracts and agreements, including fixed price formulas, capitated pricing and episodic or bundled payments intended to contain healthcare costs. If such trends continue to drive down the prices we are able to charge for our products, our profit margins will shrink, adversely affecting our business, results of operations and financial condition.
In addition, numerous initiatives and reforms initiated by legislators, regulators and third-party payors to curb rising healthcare costs, in addition to other economic factors, have resulted in a consolidation trend in the healthcare industry to create new companies with greater market power, including hospitals. As the healthcare industry consolidates, competition to provide products and services to industry participants has become, and will likely continue to become, more intense. This in turn has resulted, and will likely continue to result in, greater pricing pressures and the exclusion of certain suppliers from various market segments as GPOs, IDNs, and large single accounts continue to use their market power to consolidate purchasing decisions for some of our existing and prospective customers. We expect that market demand, government regulation and third-party reimbursement policies, among other potential factors, will continue to change the healthcare industry, resulting in further business consolidations and alliances among our customers and prospective customers, which may reduce competition among our existing and prospective customers, exert further downward pressure on the prices of our implants and may adversely impact our business, financial condition or results of operations.
The proliferation of physician-owned distributorships could result in increased downward pricing pressure on our products or harm our ability to sell our products to surgeons who own or are affiliated with those distributorships.
Physician-owned distributorships, or PODs, are product distributors that are owned, directly or indirectly, by physicians. Although we do not sell our products to PODs, the proliferation of PODs could result in increased downward pricing pressure on our products or harm our ability to sell our products to physicians who own or are affiliated with PODs. These physicians derive a proportion of their revenue from selling or arranging for the sale of medical devices for use in procedures they perform on their own patients at hospitals that agree to purchase from or through the POD, or that otherwise furnish ordering physicians with income based, directly or indirectly, on those orders of medical devices.
On March 26, 2013, the Office of Inspector General of the U.S. Department of Health and Human Services, or DHHS, issued a special fraud alert on PODs and stated that it views PODs as inherently suspect under the federal anti-kickback statute and is concerned about the proliferation of PODs. Notwithstanding the DHHS’ concern about PODs, the number of PODs in the spine surgery market may continue to grow as economic pressures increase throughout the industry, healthcare facilities, surgeons and other healthcare providers search for ways to reduce costs and, in the case of the surgeons, search for ways to increase their incomes. PODs and
33
the physicians who own, or partially own, them have significant market knowledge and access to the surgeons who use our products and the healthcare facilities that purchase our products and thus the growth of PODs may reduce our ability to compete effectively for business from surgeons who own such PODs. Growth in the number of PODs may reduce our ability to compete effectively for business from physicians who own, or partially own, them, which could have a material and adverse effect on our business, results of operations and financial condition.
If we fail to successfully enter into purchasing contracts for our products or engage in contract bidding processes internationally, we may not be able to receive access to certain hospital facilities and our sales may decrease.
In the United States, the hospital facilities where physicians treat patients with our products typically require us to enter into purchasing contracts. The process of securing a satisfactory contract can be lengthy and time-consuming and require extensive negotiations and management time. In certain international jurisdictions, from time to time, certain institutions require us to engage in a contract bidding process in the event that such institutions are considering making purchase commitments that exceed specified cost thresholds, which vary by jurisdiction. These processes are only open at certain periods of time, and we may not be successful in the bidding process. If we do not receive access to hospital facilities through these contracting processes or otherwise, or if we are unable to secure contracts or tender successful bids, our sales may stagnate or decrease and our operating results may be harmed. Furthermore, we may expend significant effort in these time-consuming processes and still may not obtain a purchase contract from such hospitals.
If coverage or adequate levels of reimbursement from third-party payors for procedures using our products, or any future products we may seek to commercialize, are not obtained or maintained, surgeons and patients may be reluctant to use our systems and our business will suffer.
In the United States, health care providers such as hospitals and ASCs who purchase our products generally rely on third-party payors, principally federally-funded Medicare, state-funded Medicaid and private health insurance plans, to pay for all or a portion of the cost of the surgical procedures and products utilized in those procedures. We may be unable to sell our products, or any future products we may seek to commercialize, on a profitable basis if third-party payors deny coverage or reduce their current levels of reimbursement for procedures using our systems. Our sales depend largely on governmental health care programs and private health insurers reimbursing providers for procedures using our products. Significant changes to operations at, funding of, or restructuring of such governmental authorities, including but not limited to a government shutdown, decreases in staff who are able to provide reimbursement services, reductions or other changes in funding provided to such governmental authorities, and changes in policy and enforcement priorities, may adversely affect our business.
Hospitals, ASCs and other health care providers may not purchase our products if they do not receive adequate reimbursement from third-party payors for procedures using our products. Payors continue to review their coverage policies for existing and new therapies and may deny coverage for treatments that include the use of our systems or any future products we may seek to commercialize. Third-party payors, whether governmental or commercial, are developing increasingly sophisticated methods of controlling healthcare costs. In addition, no uniform policy of coverage and reimbursement for procedures using our solution exists among third-party payors. Therefore, coverage and reimbursement for procedures using our products can differ from payor to payor.
In addition, some health care providers in the United States have adopted or are considering bundled payment methodologies and/or managed care systems in which providers contract to provide comprehensive health care for a fixed cost per person. Health care providers may attempt to control costs by authorizing fewer elective surgical procedures, or by requiring the use of the least expensive procedure available. In addition, third-party payors increasingly are requiring evidence that medical devices are cost-effective, and if we are unable to meet this requirement, the third-party payor may not cover procedures using our products, which could reduce sales of our products to health care providers who depend upon third-party payor reimbursement for payment. Changes in coverage policies or health care cost containment initiatives that limit or restrict reimbursement for procedures using our systems may have an adverse effect on our business.
34
We face the risk of product liability claims that could be expensive, divert management’s attention and harm our reputation and business. We may not be able to maintain adequate product liability insurance.
Our business exposes us to the risk of product liability claims that are inherent in the testing, manufacturing and marketing of our products. This risk exists even if a product is cleared, certified or approved for commercial sale by the U.S. Food and Drug Administration, or FDA, and manufactured in facilities regulated by the FDA or an applicable foreign regulatory authority. Our products are designed to affect, and any future products will be designed to affect, important bodily functions and processes. Any side effects, manufacturing defects, misuse or abuse associated with our products or our products in development could result in patient injury or death. The medical device industry has historically been subject to extensive litigation over product liability claims, and we cannot assure you that we will not face product liability claims. We may be subject to product liability claims if our products or products in development cause, or merely appear to have caused, patient injury or death, even if such injury or death was as a result of supplies or components that are produced by third-party suppliers.
Product liability claims may be brought against us by consumers, healthcare providers or others selling or otherwise coming into contact with our products, among others. If we cannot successfully defend ourselves against product liability claims, we will incur substantial liabilities and reputational harm. In addition, regardless of merit or eventual outcome, product liability claims may result in:
•
costs of litigation;
•
distraction of management’s attention from our primary business;
•
the inability to commercialize existing or new products;
•
decreased demand for our products or, if cleared, certified or approved, products in development;
•
damage to our business reputation;
•
product recalls or withdrawals from the market;
•
withdrawal of clinical study participants;
•
substantial monetary awards to patients or other claimants; and
•
loss of net revenue.
While we may attempt to manage our product liability exposure by proactively recalling or withdrawing from the market any defective products, any recall or market withdrawal of our products may delay the supply of those products to our customers and may impact our reputation. We cannot assure you that we will be successful in initiating appropriate market recall or market withdrawal efforts that may be required in the future or that these efforts will have the intended effect of preventing product malfunctions and the accompanying product liability that may result. Such recalls and withdrawals may also be used by our competitors to harm our reputation for product safety or be perceived by patients as a safety risk when considering the use of our products, either of which could adversely affect our business, results of operations and financial condition. See “—Risks Related to Government Regulation—Our products may be subject to product recalls. A recall of our products, either voluntarily or at the direction of the FDA or another governmental authority, or the discovery of serious safety issues with our products, could adversely affect us.”
In addition, although we have product liability and clinical study liability insurance that we believe is appropriate, this insurance is subject to deductibles and coverage limitations. Our current product liability insurance may not continue to be available to us on acceptable terms, if at all, and, if available, coverage may not be adequate to protect us against any future product liability claims. If we are unable to obtain insurance at an acceptable cost or on acceptable terms or otherwise protect against potential product liability claims, we could be exposed to significant liabilities. A product liability claim, recall or other claim with respect to uninsured liabilities or for amounts in excess of insured liabilities could adversely affect our business, results of operations and financial condition.
We provide a limited warranty that our prodisc products are free of material defects in workmanship and materials and conform to specifications, and offer to repair or replace defective products. Although we have had very few warranty claims to date, we bear the risk of potential warranty claims on our products. If we
35
receive a significant number of warranty claims or our products require significant amounts of service after sale, our operating expenses may substantially increase and our business and financial results will be adversely affected. We have a limited history of commercial placements from which to judge our rate of warranty claims, and we expect that the number of warranty claims we receive may increase as we scale our operations and as our existing commercial placements age. If product returns or warranty claims are significant or exceed our expectations, we could incur unanticipated reductions in sales or additional operating expenditures for parts and service.
Our results of operations will be materially harmed if we are unable to accurately forecast demand for our implant systems and maintain adequate levels of inventory.
In order to market and sell effectively, we must maintain significant levels of inventory of systems and surgical instrumentation. As a result, a significant amount of our cash used in operations has been associated with maintaining these levels of inventory. To ensure adequate inventory supply, we must forecast inventory needs and manufacturing orders based on our estimates of future demand. Our ability to accurately forecast demand for our systems could be negatively affected by many factors, including our failure to accurately manage our expansion strategy, product introductions by competitors, an increase or decrease in customer demand for our systems or for products of our competitors, our failure to accurately forecast customer acceptance of new products, unanticipated changes in general market conditions or regulatory matters and weakening of economic conditions or consumer confidence in future economic conditions. Inventory levels in excess of customer demand may result in inventory write-downs or write-offs, which would cause our gross margin to be adversely affected and could impair the strength of our brand. Furthermore, as we continue to grow and expand, we require increasing levels of inventory which may subject us to greater financial risk in the event of a recall where such inventory is no longer commercially viable. Conversely, if we underestimate customer demand for our products, our manufacturers and suppliers may not be able to deliver products to meet our requirements, which could result in damage to our reputation and customer relationships. In addition, if we experience a significant increase in demand, additional supplies of raw materials or additional manufacturing capacity may not be available to or at our existing manufacturers and suppliers when required on terms that are acceptable to us, or at all, which will negatively affect our business, financial condition and results of operations.
In addition, we are subject to the risk that a portion of our inventory will become obsolete or expire. Multiple sizes of implants are provided for surgery so that the surgeon can pick the appropriate implant size(s) based on the patient’s anatomy. For each surgery, fewer than all of the implants are used, and therefore certain portions may become obsolete before they can be used. In the event that a substantial portion of our inventory becomes obsolete, it could have a material adverse effect on our earnings and cash flows due to the resulting costs associated with the inventory impairment charges and costs required to replace such inventory.
The provision of loaned surgical instrument sets to our customers may implicate certain federal and state fraud and abuse laws.
We typically loan the surgical instrument sets necessary to perform procedures using our products for each surgery at no additional charge. The provision of these instruments at no charge may implicate certain federal and state fraud and abuse laws. Because the provision of loaned surgical instrument sets may result in a benefit to the hospital, surgeon or other healthcare provider, the government could view this practice as a prohibited transfer of value intended to induce hospitals, surgeons or other healthcare providers to purchase our products that are used in procedures reimbursed by a federal healthcare program. For further discussion of these laws, and the potential penalties thereunder, see “—Risks Related to Government Regulation — We are subject to federal, state and foreign laws and regulations relating to our healthcare business, and could face substantial penalties if we are determined not to have fully complied with such laws, which would adversely affect our business, results of operations and financial condition.” Any challenge to or investigation into our practices under these laws could cause adverse publicity and be costly to respond to, and thus could harm our business.
In the future our products may become obsolete, which would negatively affect operations and financial condition.
The medical device industry is characterized by rapid and significant change. There can be no assurance that other companies will not succeed in developing or marketing devices, and products that are more effective
36
than our products or that would render our products obsolete or noncompetitive. Additionally, new surgical procedures, medications and other therapies could be developed that replace or reduce the importance of our products. Accordingly, our success will depend in part on our ability to respond quickly to medical and other changes through the development and introduction of new products. Product development involves a high degree of risk and there can be no assurance that our new product development efforts will result in any commercially successful products.
We depend on third-party contract manufacturers, some of which are single source, to produce and package our products, and if these manufacturers fail to supply us with our products in sufficient quantities or at all, or in accordance with applicable regulatory requirements and our specifications, it will have a material adverse effect on our business, financial condition, and results of operations.
We use third-party manufacturers to produce almost all of our products and instruments, pursuant to multi-year agreements. We may not be able to renew or enter into new contracts with our existing suppliers following the expiration of such contracts on commercially reasonable terms, or at all. If any of our products or the components used in our products are alleged or proven to include quality or product defects, we may need to find alternate supplies, delay production of our products, discard or otherwise dispose of our products, or engage in a product recall, all of which may adversely affect our business, results of operations and financial condition. If our products or the components in our products are affected by adverse prices or quality or other concerns, we may not be able to identify alternate sources of components or other supplies that meet our quality controls and standards to sustain our sales volumes or on commercially reasonable terms, or at all.
We and our third-party manufacturers are required to comply with the Quality Management System Regulation, or QMSR, which is a set of the FDA regulations that establishes current Good Manufacturing Practices, or cGMP, requirements for medical devices and covers the methods and documentation of the design, testing, production, control, quality assurance, labeling, packaging, sterilization, storage and shipping of such devices.
There is a limited number of suppliers and third-party manufacturers that operate under FDA’s QMSR requirements and that have the necessary expertise and capacity to manufacture our products or components for our products. As a result, it may be difficult for us to locate manufacturers for our anticipated future needs, and our anticipated growth could strain the ability of our current suppliers and third-party manufacturers to deliver products, materials and components to us. Upon expiration of our existing agreements with these third-party manufacturers, we may not be able to renegotiate the terms of our agreements with these third-party manufacturers in a timely manner and on a commercially reasonable basis, or at all.
If we or our third-party manufacturers fail to maintain facilities in accordance with the FDA’s QMSR, the noncomplying party could lose the ability to manufacture our products on a commercial scale. Loss of this manufacturing capability would limit our ability to sell our products, which are manufactured by single-source third-party manufacturers. See “Business—Manufacturing and Supply.”
We rely on certain single source suppliers to manufacture our products. For example, Hammill Manufacturing Co. is our single source supplier for machining and finishing endplates and inlays used in our prodisc C Vivo, prodisc C Nova and prodisc C SK products and Bricon is our sole supplier for machining prodisc C endplates. Both suppliers support distribution in the United States. Internationally, Medicoat (coating), Bricon (finishing) and Fruh (packaging and sterilization) are sole sourced for prodisc C Vivo and prodisc C Nova products. For certain products, we estimate that it could take up to 24 months to find and qualify a second source. Although we have identified alternate third parties who could provide manufacturing services and expect to reduce our reliance on single source manufacturers, we cannot guarantee that we would be able to contract with such alternate third parties within a reasonable amount of time or at all, or upon similar pricing and volume terms, nor can we be assured that any such third party would be capable of producing products in sufficient volume and quality. For example, a replacement supplier may discover challenges with our products or we may not perfectly specify our product designs for such new suppliers’ manufacturing systems, which may require us to refine our products and/or incur additional research and development expense, which could delay our sales and have an adverse effect on our financial condition and results of operations.
Our reliance on a third-party manufacturer and third-party suppliers also subjects us to other risks that could harm our business that we would not be subject to if we manufactured ourselves, including, among others:
37
•
we may not be a major customer of many of our suppliers, and these suppliers may therefore give other customers’ needs higher priority than ours, including some of our competitors who use the same manufacturing partners;
•
third parties may threaten or enforce their intellectual property rights against our suppliers, which may cause disruptions or delays in shipment, or may force our suppliers to cease conducting business with us;
•
we may not be able to obtain an adequate supply of components in a timely manner or on commercially reasonable terms;
•
our suppliers may make errors in manufacturing that could negatively affect the efficacy or safety of our systems or cause delays in shipment;
•
we may have difficulty locating and qualifying alternative suppliers and our existing suppliers could be acquired by companies that have limiting or exclusive relationships with our competitors;
•
switching components or suppliers may require product redesign and possibly submission to and approval by the FDA, or notified bodies, which could significantly impede or delay our commercial activities;
•
our single-source supplier may be unwilling or unable to supply components of our systems;
•
other customers, including our competitors, may use fair or unfair negotiation tactics or pressures to impede our use of the suppliers;
•
the occurrence of a fire, natural disaster or other catastrophe, or the occurrence of geopolitical conflicts, as well as any sanctions or other actions resulting therefrom impacting one or more of our suppliers may affect their ability to deliver products to us in a timely manner;
•
the occurrence of pandemics, epidemics and other public health emergencies may impact a manufacturing facility by limiting operating capacity or sideline critical employees involved in the manufacturing processes thereby affecting their ability to deliver products to us in a timely manner;
•
our suppliers may encounter financial or other business hardships unrelated to our demand, which could inhibit their ability to fulfill our orders and meet our requirements;
•
our suppliers may not maintain the confidentiality of our proprietary information or may mislabel raw materials resulting in inaccurate certifications; and
•
higher manufacturing and product costs than more vertically integrated companies.
Any of these factors could cause delay or suspension of commercialization and marketing, regulatory submissions or required approvals, clearances or certifications, or cause us to incur higher costs. Furthermore, if our contract manufacturers fail to deliver the required commercial quantities of finished products on a timely basis and at commercially reasonable prices and we are unable to find one or more replacement manufacturers capable of production at a substantially equivalent cost, in substantially equivalent volumes and quality, and on a timely basis, we would likely be unable to meet demand for our systems and we would lose potential revenue. Any difficulties in locating and hiring third-party manufacturers, or in the ability of third-party manufacturers to supply quantities of our products meeting applicable regulatory requirements at the times and in the quantities we need could have a material adverse effect on our business. It may take a significant amount of time and resources (including costs) to establish an alternative source of supply for our products and to have any such new source authorized by the FDA or other bodies. Given our reliance on certain single-source suppliers, we are especially susceptible to supply shortages because we do not have alternate suppliers currently available that we could contract with in reasonable amount of time or at all, or upon similar pricing and volume terms, nor can we be assured that any such third party would be capable of producing in sufficient volume and of sufficient quality.
The loss of any of these third-party manufacturers or the failure for any reason of any of these third-party manufacturers to meet their contractual, regulatory, and other obligations, including a failure to meet our quality controls and standards, or a finding by the FDA of significant violations of the QMSR, may result in disruptions to our supply of finished goods, which will have a material adverse effect on our business, financial condition, and results of operations.
38
Performance issues, service interruptions or price increases by shipping carriers could adversely affect our business and harm our reputation and ability to provide our systems on a timely basis.
Expedited, reliable shipping is essential to our operations. We rely heavily on providers of transport services for reliable and secure point-to-point transport of our products to our customers and for tracking of these shipments that are delivered directly to hospitals and ASCs, employees or independent distributors. Should a carrier encounter delivery performance issues such as loss, damage or destruction of our systems, it would be costly to replace our systems in a timely manner, could cause surgeries using our systems to be delayed or canceled and such occurrences may damage our reputation and lead to decreased demand for our systems and increased cost and expense to our business. Once a product leaves our facilities, we are no longer in control of the care of such shipped products and any damage that may occur during transit may not be readily detectable by the customer, including any penetrations of sterile barriers, temperature swings that may cause package seal rupturing or exposure to fine particulates or other debris that is not easily detectable. In addition, any significant increase in shipping rates could adversely affect our operating margins and results of operations. Similarly, strikes, severe weather, natural disasters, including fires and hurricanes, or other service interruptions affecting delivery services we use would adversely affect our ability to process orders for our systems on a timely basis.
We, or the third parties we depend on, may be adversely affected by natural disasters and other catastrophic events, and our business continuity and disaster recovery plans may not adequately protect us from a serious natural disaster or other catastrophic event. Any interruption in our operations or the operations of third parties who supply components or other materials for our products may have a material adverse effect on our business, financial condition, results of operations, and prospects.
Severe weather, natural disasters and other catastrophic events, including pandemics or other public health crises, earthquakes, tsunamis, hurricanes, floods, fires, explosions, accidents, power outages, cyberattacks, telecommunications failures, mechanical failures, unscheduled downtimes, civil unrest, strikes, transportation interruptions, unpermitted discharges or releases of toxic or hazardous substances, other environmental risks, wars or other conflicts (including wars in Ukraine as well as the Middle East), sabotage, terrorist attacks, or other intentional acts of vandalism or misconduct could severely disrupt our operations, or the operations of third parties who manufacture or supply components or other materials for our products, and have a material adverse effect on our business, financial condition, results of operations, and prospects.
If a natural disaster or other catastrophic event occurs that prevents us or third-party suppliers or manufacturers from using all or a significant portion of our or their headquarters or other facilities, that damages critical infrastructure or that otherwise disrupts operations, it may be difficult or, in certain cases, impossible, for us to commercialize our products and conduct our research and development activities for new products for a substantial period of time, which may result in the inability to continue to supply our products during such periods and the loss of customers or harm to our reputation. We are highly dependent on our corporate headquarters and distribution facility, and any natural disaster or catastrophic event that impacts these facilities could have a material adverse impact on our business, financial condition and results of operations. Moreover, the disaster recovery and business continuity plans we have in place currently are limited and are unlikely to prove adequate in the event of a serious disaster or similar catastrophic event. The potential impact of any disruption would depend on the nature and extent of the damage caused by a disaster. We may incur substantial expenses as a result of the limited nature of our disaster recovery and business continuity plans, which could have a material adverse effect on our business, financial condition, results of operations, and prospects.
In addition, integral parties in our supply chain are similarly vulnerable to natural disasters or other sudden, unforeseen, and severe adverse events. If such an event were to affect our supply chain, it could have a material adverse effect on our business, financial condition, results of operations, and prospects.
Our insurance may not cover all potential losses or liabilities that may arise.
We are not insured against all potential losses or liabilities that may arise, as insurance coverage may be unavailable, not cost-effective, or subject to significant limitations. For example, we are not insured against business interruptions suffered by third parties that we depend on, environmental liabilities or patent infringement, among other types of risks. Furthermore, no assurance can be given that an insurance carrier
39
will not seek to cancel or deny coverage after a claim has occurred. If a loss or liability occurs that is not or not fully covered by insurance, we may be required to pay substantial amounts, which could adversely affect its cash position and results of operations.
If we fail to maintain our numerous contractual relationships, our business, results of operations and financial condition could be adversely affected.
We are party to numerous contracts in the normal course of our business. We have contractual relationships with suppliers, surgeons, hospitals, distributors and agents, as well as service providers. In the aggregate, these contractual relationships are necessary for us to operate our business. From time to time, we amend, terminate or negotiate our contracts. We may also periodically be subject to, or make claims of breach of contract, or threaten legal action relating to our contracts. These actions may result in litigation. At any one time, we have a number of negotiations under way for new or amended commercial agreements. We devote substantial time, effort and expense to the administration and negotiation of contracts involved in our business. However, these contracts may not continue in effect past their current term or we may not be able to negotiate satisfactory contracts in the future with current or new business partners, which may adversely affect our business, results of operations and financial condition.
If we are unable to manage, train, maintain and grow our direct sales team and network of independent distributors, we may not be able to generate anticipated sales or we may be subject to regulatory or enforcement action.
Our operating results are directly dependent upon the sales and marketing efforts of not only our direct sales team, but also our independent distributors. If our direct sales team or independent distributors fail to adequately promote, market and sell our products, our sales could significantly decrease.
We face significant challenges and risks in managing our geographically dispersed distribution network and retaining the individuals who make up that network. If any members of our direct sales team were to leave us, or if any of our independent distributors were to cease to do business with us, our sales could be adversely affected.
If a member of our direct sales team or one of our independent distributors were to depart, we may need to seek alternative independent distributors or increase our reliance on our direct sales team, which may not prevent our sales from being adversely affected. If, in such a situation, a member of our direct sales team or independent distributor were to be retained by one of our competitors, we may be unable to prevent them from helping such competitors solicit business from our existing customers, which could further adversely affect our sales. Because of the competition for their services, we may be unable to recruit or retain additional qualified independent distributors or to hire additional direct sales team members to work with us on favorable or commercially reasonable terms, if at all. Failure to hire or retain qualified members of our direct sales team or independent distributors would prevent us from maintaining or expanding our business and generating sales.
If we launch new products or increase our marketing efforts with respect to existing products, we will need to expand the reach of our marketing and sales networks. Our future success will depend largely on our ability to continue to hire, train, retain and motivate skilled members of our direct sales team and independent distributors with significant technical knowledge in our technologies. New hires require training and take time to achieve full productivity. If we fail to train new hires adequately, or if we experience high turnover in our sales force in the future, we cannot be certain that new hires will become as productive as may be necessary to maintain or increase our sales. If we are unable to expand our sales and marketing capabilities domestically and internationally, we may not be able to effectively commercialize our products, which would adversely affect our business, results of operations and financial condition.
The misuse or off-label use of our systems may result in costly investigations, fines, or sanctions by regulatory bodies if we are deemed to have engaged in the promotion of these uses, any of which could be costly to our business.
In certain cases, federal, state and foreign authorities pursue advisory or enforcement actions, including for false claims, on the basis that manufacturers and distributors are promoting unapproved, or “off-label” uses of
40
their products. Pursuant to FDA regulations, we can only market our products for authorized uses. Although surgeons are permitted, in their independent medical judgement, to use medical devices for indications other than those cleared or approved by the FDA, we are prohibited from promoting products for “off-label” uses. Through our direct sales team, we market our products and provide promotional materials and training programs to surgeons regarding the use of our products. Our sales and marketing personnel, as well as our direct sales force, are trained to not promote our devices for uses outside of the FDA-authorized indications for use. If we fail to adequately train new hires or our direct sales team, new hires or members of our direct sales team may engage in practices such as the promotion of unapproved uses of our devices or may assist with the reimbursement process in a manner that results in false or fraudulent claims for reimbursement being submitted to government or private payors. If it is determined that our marketing, promotional materials or training programs constitute promotion of unapproved uses, we could be subject to significant fines in addition to regulatory enforcement actions, including the issuance of a warning letter, injunction, seizure, criminal penalty, and damage to our reputation, as well as the possible exclusion from participation in federal health care programs. Federal, state and foreign authorities also pursue actions for false claims based upon improper billing and coding advice or recommendations, as well as decisions related to the medical necessity of procedures, including the site-of-service where procedures are performed, which could result in significant penalties. See “—Risks Related to Government Regulation.”
Actual or perceived failures to comply with applicable data privacy and security laws, regulations, standards, and other requirements could adversely affect our business, financial condition, results of operations, and prospects.
The global data protection landscape is rapidly evolving, and we, and the third-party service providers on which we rely, are or may become subject to numerous U.S., state, federal, and/or foreign laws, requirements, and regulations, in addition to contractual obligations and research protocols governing privacy and data security, including the collection, use, disclosure, retention, processing, maintenance, transfer, and security of personal information, such as information that we and our third-party service providers collect in connection with the use and development of the prodisc technology platform and in clinical studies, including patient data. Implementation standards and enforcement practices are likely to remain uncertain for the foreseeable future, and we cannot yet determine the impact future and recently-passed laws, regulations, standards, or perception of their requirements may have on our business. This evolution may create uncertainty in our business; affect our ability to operate in certain jurisdictions or to collect, store, transfer, use, and share personal information; necessitate the acceptance of more onerous obligations in our contracts; result in liability; or impose additional costs on us. The cost of compliance with these laws, regulations, and standards is high and is likely to increase in the future. Our actual or perceived failure to comply with privacy and data security regulation could lead to regulatory inquiries or enforcement actions, litigation, fines and penalties, disruptions to our business operations, reputational harm, loss of revenue, additional costs, business changes or delays, and other adverse business consequences.
In the U.S., HIPAA imposes, among other things, certain standards relating to the privacy, security, transmission and breach reporting of individually identifiable health information. We may obtain health information from third parties, such as research institutions with which we collaborate, that are subject to privacy and security requirements under HIPAA. Although we do not believe that we are directly subject to HIPAA, other than potentially with respect to providing certain employee benefits, we could be subject to criminal penalties if we knowingly obtain or disclose individually identifiable health information maintained by a HIPAA covered entity in a manner that is not authorized or permitted by HIPAA. Certain states have also adopted comparable privacy and security laws and regulations, which govern the privacy, processing and protection of health-related and other personal information. Such laws and regulations will be subject to interpretation by various courts and other governmental authorities, thus creating potentially complex compliance issues for us and our future customers and strategic partners. For example, the California Consumer Privacy Act of 2018, (CCPA) as amended by the California Privacy Rights Act (collectively, the CCPA) requires covered businesses that process the personal information of California residents to, among other things: (i) provide certain disclosures to California residents regarding the business’s collection, use, and disclosure of their personal information; (ii) receive and respond to requests from California residents to access, delete, and correct their personal information, or to opt out of certain disclosures of their personal information; and (iii) enter into specific contractual provisions with service providers that process California resident personal information on the business’s behalf. Additional compliance investment and potential business process changes may also be required. Similar laws have been passed in other states, and are
41
continuing to be proposed at the state and federal level, reflecting a trend toward more stringent privacy legislation in the United States. For example, Washington State enacted the Washington My Health My Data Act, which broadly defines consumer health data, creates a private right of action to allow individuals to sue for violations of the law, imposes stringent consent requirements, and grants consumers certain rights with respect to their health data, including to request deletion of their information. The enactment of such laws could have potentially conflicting requirements that would make compliance challenging. In the event that we are subject to or affected by HIPAA, the CCPA, the CPRA or other domestic privacy and data protection laws, any liability from failure to comply with the requirements of these laws could adversely affect our financial condition and the costs of compliance would be material.
Further, the Federal Trade Commission (the “FTC”) also has authority to initiate enforcement actions against entities that make deceptive statements about privacy and data sharing in privacy policies, fail to limit third-party use of personal health information, fail to implement policies to protect personal health information, or engage in other unfair practices that harm customers or that may violate Section 5 of the FTC Act. Failing to take appropriate steps to keep consumers’ personal information secure may constitute unfair acts or practices in or affecting commerce under the FTC Act. The FTC expects a company’s data security measures to be reasonable and appropriate in light of the sensitivity and volume of consumer information that it holds, the size and complexity of its business, and the cost of available tools to improve security and reduce vulnerabilities.
In 2024, the National Security Division of the U.S. Department of Justice (DOJ) issued a new rule—referred to as the “Data Security Program” (DSP)—to implement Executive Order 14117 aimed at preventing access to “bulk U.S. sensitive personal data” and “government-related data” by “countries of concern” (including China, Russia, Iran, North Korea, Cuba, and Venezuela) and “covered persons” (as all such terms are defined in the DSP). Effective as of April 8, 2025, and fully enforceable as of July 8, 2025, the DSP imposes stringent obligations on companies within its scope and prohibits or restricts “covered data transactions” that grant countries of concern or covered persons access to bulk U.S. sensitive personal data or any amount of government-related data. The DSP is new, complex and has yet to be enforced, and as such, there is a risk that our interpretation of its applicability, scope, and requirements is incorrect, incomplete, or misapplied. Compliance with the DSP may require us to invest heavily in data security and compliance measures, such as implementing and complying with the Cybersecurity and Infrastructure Security Agency’s guidelines and other burdensome recordkeeping, reporting, and auditing requirements. It may also require us to implement new processes, stop or restrict certain data transfers, alter the geographic scope of our operations, cease doing business with certain third parties or using certain tools or vendors, or change how data flows throughout our business, any of which could materially impact our business operations or hinder our ability to grow our business. Finally, non-compliance with the DSP could result in significant civil or criminal penalties, which could materially adversely affect our business, results of operations, and financial condition.
Our operations abroad may also be subject to increased scrutiny or attention from data protection authorities. For example, in Europe, the European Union General Data Protection Regulation (the “EU GDPR”) and in the United Kingdom, the United Kingdom General Data Protection Regulation and Data Protection Act 2018 (the “UK GDPR” and together with the EU GDPR, referred to as the “GDPR”) impose strict requirements for processing the personal data of individuals within the European Economic Area (EEA) or United Kingdom or in the context of our activities within the EEA or United Kingdom (as appropriate). Companies that must comply with the GDPR face increased compliance obligations and risk, including more robust regulatory enforcement of data protection requirements and potential fines for noncompliance under both the EU GDPR and UK GDPR of up to €20 million/ GBP 17.5 million or 4% of the annual global revenues of the noncompliant company, whichever is greater. In addition to fines, a breach of the GDPR may result in regulatory investigations, reputational damage, orders to cease/ change our data processing activities, enforcement notices, assessment notices (for a compulsory audit) and/ or civil claims (including class actions). Among other requirements, the GDPR regulates transfers of personal data subject to the GDPR to third countries that have not been found to provide adequate protection to such personal data, including the United States, and the efficacy and longevity of current transfer mechanisms between the EEA, and the United States remains uncertain. Case law from the Court of Justice of the European Union (“CJEU”) states that reliance on the standard contractual clauses—a standard form of contract approved by the European Commission as an adequate personal data transfer mechanism—alone may not necessarily be sufficient in all circumstances and that transfers must be assessed on a case-by-case basis. On July 10, 2023, the European Commission
42
adopted its Adequacy Decision in relation to the new EU-US Data Privacy Framework (“DPF”), rendering the DPF effective as a GDPR transfer mechanism to U.S. entities self-certified under the DPF. Because of regulatory challenges in the EU to the validity of the DPF, we choose to rely on standard contractual clauses for most transfers of personal data to which GDPR applies.
In relation to such cross border transfers of personal data, we expect the existing legal complexity and uncertainty regarding international personal data transfers to continue, and international transfers to the United States, China, and to other jurisdictions more generally to continue to be subject to enhanced scrutiny by regulators. As the regulatory guidance and enforcement landscape in relation to data transfers continue to develop, we could suffer additional costs, complaints and/or regulatory investigations or fines; we may have to stop using certain tools and vendors and make other operational changes; we may have to implement alternative data transfer mechanisms under the GDPR and/ or take additional compliance and operational measures; and/or it could otherwise affect the manner in which we operate our business, and could adversely affect our business, operations and financial condition.
As we expand into other foreign countries and jurisdictions, we will become subject to additional laws and regulations that will affect how we conduct business, and we expect the existing legal complexity and uncertainty regarding international personal data transfers to continue. Our operations could suffer additional costs, complaints, and regulatory investigations or fines, and/or if we are otherwise unable to transfer personal data between and among countries and regions in which we operate, it could affect the manner in which we provide our services, the geographical location or segregation of our relevant systems and operations, and could adversely affect our financial results. Compliance with applicable privacy and data security laws and regulations is a rigorous and time-intensive process, and we may be required to put in place additional mechanisms ensuring compliance with new data protection rules. Failure or perceived failure to comply with any such laws or regulations puts us at risk of facing significant fines and penalties that could adversely affect our business, financial condition, reputation, and results of our operations. Furthermore, conflicting requirements across applicable privacy and data security laws would complicate our compliance efforts and increase both legal risk and compliance costs for us and the third parties upon whom we rely.
Although we work to comply with applicable laws, regulations and standards, our contractual obligations, research protocols, and other obligations, any actual or perceived failure by us or our employees, representatives, contractors, consultants, or other third parties to comply with such requirements or adequately address data privacy and security concerns, even if unfounded, could result in, among other adverse impacts, damage to our reputation, loss of customer confidence in our security measures, withdrawal or withholding of customer consent for using patient data, government investigations, and enforcement actions and litigation and claims by third parties, any of which could have a material adverse effect on our business, financial condition, results of operations, and prospects.
AI presents risks and challenges that can impact our business including by posing security risks to our confidential information, proprietary information and personal data.
We are beginning to incorporate AI solutions into our platform, and these applications can become increasingly important to our operations over time. AI presents risks such as inaccuracy, bias, toxicity, intellectual property infringement or misappropriation, data privacy and cybersecurity and data provenance. In addition, AI utilizes machine learning and predictive analytics, which in some cases present flawed, biased, and inaccurate results, and may have errors or inadequacies that are not easily detectable and may also be subject to data herding and interconnectedness (i.e., multiple market participants utilizing the same data), in each case adversely impacting our business. The regulatory framework for AI is rapidly evolving as many federal, state, and foreign government bodies and agencies have introduced or are currently considering additional laws and regulations. Additionally, existing laws and regulations could affect the operation of our AI. As a result, implementation standards and enforcement practices are likely to remain uncertain for the foreseeable future, and we cannot yet determine the impact of future laws, regulations, standards, or market perception of their requirements on our business and our response. It is possible that new laws and regulations will be adopted in the United States and in other jurisdictions outside the United States, or that existing laws and regulations, including competition and antitrust laws, may be interpreted in ways that would limit our ability to use AI for our business, or require us to change the way we use AI in a manner that negatively affects the performance of our technologies, services, and business and the way in which we use AI. We may need to
43
expend resources to adjust our technologies or services in certain jurisdictions if the laws, regulations, or decisions are not consistent across jurisdictions. Further, the cost to comply with such laws, regulations, or decisions and/or guidance interpreting existing laws, could be significant and would increase our operating expenses (such as by imposing additional reporting obligations regarding our use of AI). Such an increase in operating expenses, as well as any actual or perceived failure to comply with such laws and regulations, could adversely affect our business, financial condition, and results of operations.
These issues, combined with an uncertain regulatory environment, may further result in reputational harm, liability, or other adverse consequences to our business operations. Incorporation of generative AI tools by vendors into their offerings without disclosing this use to us would expose us to potential liability, and the providers of these generative AI tools may not meet existing or rapidly evolving regulatory or industry standards with respect to privacy and data protection and may inhibit our or our vendors’ ability to maintain an adequate level of service and experience. If our vendors, or our third-party partners experience an actual or perceived breach or privacy or security incident because of the use of generative AI, we may lose valuable intellectual property and confidential information and our reputation and the public perception of the effectiveness of our security measures could be harmed. Further, bad actors around the world use increasingly sophisticated methods, including the use of AI, to engage in illegal activities involving the theft and misuse of personal information, confidential information, and intellectual property. Any of these outcomes could damage our reputation, result in the loss of valuable property and information, and adversely impact our business.
We, along with our suppliers, are dependent on various information technology systems. If our information technology systems or those of third parties with whom we work or our data, are or were compromised, we could experience adverse consequences resulting from such compromise, including but not limited to regulatory investigations or actions; litigation; fines and penalties; disruptions of our business operations; reputational harm; loss of revenue or profits; loss of customers or sales; and other adverse consequences.
We and our suppliers collect and maintain information, including data about employees, business partners and clinical study participants, in digital form that is necessary to conduct our business, and rely extensively on information technology systems, networks and services, including internet sites, data hosting and processing facilities and tools, physical security system and other hardware, software and technical applications and platforms, some of which are managed, hosted, provided or used by third-parties or their vendors, and some of which may be stored outside of the United States. These systems include, but are not limited to, ordering and managing materials from suppliers, converting materials to finished products (suppliers), shipping products to customers, processing transactions, summarizing and reporting results of operations, complying with regulatory, legal or tax requirements, providing data security and other processes necessary to manage our business.
We face numerous and evolving cybersecurity risks that threaten the confidentiality, integrity and availability of our information technology systems and sensitive information. A significant breakdown, invasion, corruption, destruction or interruption of critical information technology systems or infrastructure, by our workforce, others with authorized access to our systems or unauthorized persons could negatively impact operations. The use of cloud-based computing creates opportunities for the unintentional dissemination or intentional destruction of confidential information stored in our or our third-party providers’ systems, portable media or storage devices. Our internal computer systems and those of our contractors, consultants and collaborators have been and are vulnerable to damage from cyberattacks, “phishing” attacks, intentional or accidental actions or omissions to act that cause vulnerabilities, computer viruses, unauthorized access, natural disasters, terrorism, war and telecommunication and electrical failures.
Attacks upon information technology systems are increasing in their frequency, levels of persistence, sophistication and intensity, and are being conducted by sophisticated and organized groups and individuals with a wide range of motives and expertise. Cyber-attacks, malicious internet-based activity, online and offline fraud, and other similar activities threaten the confidentiality, integrity, and availability of our sensitive information and information technology systems, and those of the third parties with whom we work. Our information technology systems and those of our third-party service providers, strategic partners and other contractors or consultants are vulnerable to attack, damage and interruption from computer viruses and malware (e.g. ransomware), misconfigurations, “bugs” or other vulnerabilities, malicious code, natural
44
disasters, terrorism, war, telecommunication and electrical failures, hacking, cyberattacks, phishing attacks and other social engineering schemes, employee theft or misuse, human error, fraud, denial or degradation of service attacks and sophisticated nation-state and nation-state-supported actors.
We have also outsourced elements of our information technology infrastructure, and as a result a number of third-party vendors may or could have access to our confidential information. If we or our third-party vendors were to experience a significant cybersecurity breach of our or their information systems or data, the costs associated with the investigation, remediation and potential notification of the breach to counter-parties and data subjects could be material. In addition, our remediation efforts may not be successful. If we do not allocate and effectively manage the resources necessary to build and sustain the proper technology and cybersecurity infrastructure, we could suffer significant business disruption, including transaction errors, supply chain or manufacturing interruptions, processing inefficiencies, data loss or the loss of or damage to intellectual property or other proprietary information. There can also be no assurance that our and our third-party service providers’, strategic partners’, contractors’, consultants’, Contract Research Organizations’ and collaborators’ cybersecurity risk management program and processes, including policies, controls or procedures, will be fully implemented, complied with or effective in protecting our systems, networks and confidential information. For example, a third-party software provider which we have engaged as part of our advanced implant systems was recently inspected by the FDA, which identified a single observation regarding inadequate validation of the software to address active vulnerability threats. While such a finding may not be material, if not properly remediated, it could affect our brand, business, financial condition, results of operations and prospects.
We and certain of our service providers are from time to time subject to cyberattacks and security incidents. While we do not believe that we have experienced any significant system failure, accident or security breach to date, if such an event were to occur and cause interruptions in our operations, it could result in a material disruption of our development programs and our business operations, whether due to a loss, corruption or unauthorized disclosure of our trade secrets, personal information or other proprietary or sensitive information or other similar disruptions. We may also experience security breaches that may remain undetected for an extended period. If our systems are damaged or cease to function properly due to any number of causes, ranging from catastrophic events to power outages to security breaches, and our business continuity plans do not effectively compensate timely, we may suffer interruptions in our ability to manage operations, and would also be exposed to a risk of loss, including financial assets or litigation and potential liability, which could materially adversely affect our business, financial condition, results of operations and prospects.
Any adverse impact to the availability, integrity or confidentiality of our information technology systems or sensitive information can result in legal claims or proceedings (such as class actions), regulatory investigations and enforcement actions, fines and penalties, negative reputational impacts that cause significant incident response, system restoration or remediation and future compliance costs. Any or all of the foregoing could materially adversely affect our business, operating results, and financial condition. We cannot assure you that any limitations of liability provisions in our contracts would be enforceable or adequate or would otherwise protect us from any liabilities or damages with respect to any particular claim relating to a security lapse or breach. While we maintain certain insurance coverage, including cyber insurance, our insurance may be insufficient or may not cover all liabilities incurred by such attacks. We also cannot be certain that our insurance coverage will be adequate for data handling or data security liabilities actually incurred, that insurance will continue to be available to us on economically reasonable terms, or at all, or that any insurer will not deny coverage as to any future claim. The successful assertion of one or more large claims against us that exceeds available insurance coverage, or the occurrence of changes in our insurance policies, including premium increases or the imposition of large deductible or co-insurance requirements, could have a material adverse effect on our business, including our financial condition, operating results and reputation.
Our business subjects us to economic, political, regulatory and other risks associated with international sales and operations that could adversely affect our business, results of operations and financial condition.
Since we sell our products in many different jurisdictions outside the United States, our business is subject to risks associated with conducting business internationally. For the six months ended June 30, 2026 and the fiscal year ended December 31, 2025, net revenue from international operations represented approximately 15% and 16%, respectively, of our total net revenue, and we anticipate that net revenue from international
45
operations will continue to represent a significant portion of our total net revenue. In addition, a number of our third-party manufacturing facilities and suppliers of our products are located outside the United States. Accordingly, our future results could be harmed by a variety of factors, including:
•
multiple, conflicting and changing laws and regulations such as tax laws, privacy laws, export and import restrictions, including unexpected changes in tariffs, trade barriers, regulatory requirements and other governmental approvals, permits and licenses;
•
the effect of local and regional financial pressures on demand and payment for our products and exposure to foreign currency exchange rate fluctuations;
•
customers in some foreign countries potentially having longer payment cycles;
•
disadvantages of competing against companies from countries that are not subject to U.S. laws and regulations, including the U.S. Foreign Corrupt Practices Act, or FCPA, regulations of the U.S. Department of Treasury, Office of Foreign Assets Controls, and U.S. anti- money laundering regulations, as well as exposure of our foreign operations to liability under these regulatory regimes;
•
training of third-parties on our products and the procedures in which they are used;
•
reduced protection for and greater difficulty enforcing our intellectual property rights in certain jurisdictions;
•
difficulty in staffing and managing international operations, including compliance with tax, employment, immigration and labor laws for employees living or traveling abroad;
•
foreign tax laws and complexities of foreign value-added tax (“VAT”) systems;
•
workforce uncertainty in countries where labor unrest is more common than in the United States;
•
international regulators and third-party payors requiring additional clinical studies prior to approving or allowing reimbursement for our products;
•
complexities associated with managing multiple payor reimbursement regimes, government payors or patient self-pay systems;
•
production shortages resulting from any events affecting material supply or manufacturing capabilities abroad; and
•
natural disasters, political and economic instability, including wars, terrorism, political unrest, outbreak of disease, pandemics and epidemics, boycotts, curtailment of trade and other market restrictions.
In addition, further expansion into new international markets may require significant resources and the efforts and attention of our management and other personnel, which may divert resources from our existing business operations. As we expand our business internationally, our success will depend, in large part, on our ability to anticipate and effectively manage these and other risks associated with our operations outside of the United States.
We are exposed to foreign currency risks, which may adversely affect our business, results of operations and financial condition.
Because some of our revenue, expenses, assets and liabilities are denominated in foreign currencies, we are subject to exchange rate and currency risks. In preparing our consolidated financial statements, which are presented in U.S. dollars, we must convert all non-U.S. dollar financial results to U.S. dollars at varying exchange rates. This may ultimately result in currency gain or loss, the outcome of which we cannot predict.
Furthermore, to the extent that we incur expenses or earn revenue in currencies other than in U.S. dollars, any change in the values of those foreign currencies relative to the U.S. dollar could cause our profits to decrease or our products to be less competitive against those of our competitors. To the extent that our current assets denominated in foreign currency are greater or less than our current liabilities denominated in foreign currencies, we face potential foreign exchange exposure.
To minimize such exposures, we may in the future enter into derivative instruments related to forecasted foreign currency transactions or currency hedges from time to time. Losses from changes in the value of the
46
Euro or other foreign currencies relative to the U.S. dollar could adversely affect our business, results of operations and financial condition.
We are subject to differing tax rates in several jurisdictions in which we operate, which may adversely affect our business, results of operations and financial condition.
We are subject to taxes in the United States and certain foreign jurisdictions. Due to economic and political conditions, tax rates in various jurisdictions, including the United States, may be subject to change. Our future effective tax rates could be affected by changes in the mix of earnings in countries with differing statutory tax rates, changes in the valuation of deferred tax assets and liabilities and changes in tax laws or their interpretation. In addition, we may be subject to income tax audits by various tax jurisdictions. Although we believe our income tax liabilities are reasonably estimated and accounted for in accordance with applicable laws and principles, an adverse resolution by one or more taxing authorities could have a material impact on the results of our operations.
We are subject to VAT and other indirect tax laws in multiple jurisdictions, and the complexity and interpretation of these rules could result in additional tax liabilities and compliance costs.
We are subject to VAT, sales, use, and other indirect tax laws in multiple jurisdictions, including the U.K. and the European Union, which are complex, evolving, and subject to differing interpretations by tax authorities. Determining the appropriate tax treatment of our cross-border transactions and intercompany service arrangements requires judgment, including the characterization of services, determination of place of supply, and application of reverse-charge mechanisms. Disagreements with tax authorities or changes in guidance or enforcement practices could result in additional VAT liabilities, penalties, interest, or the loss of input VAT recovery, which could adversely affect our financial condition, results of operations, and cash flows.
We may seek to grow our business through acquisitions of or investments in new or complementary businesses, products or technologies, and the failure to manage acquisitions or investments, or the failure to integrate them with our existing business, could have a material adverse effect on us.
From time to time, we expect to consider opportunities to acquire or make investments in other technologies, products, and businesses that may enhance our capabilities, complement our current products, or expand the breadth of our markets or customer base. Potential and completed acquisitions and strategic investments involve numerous risks, including:
•
problems assimilating the purchased technologies, products, or business operations;
•
issues maintaining uniform standards, procedures, controls, and policies;
•
unanticipated costs and liabilities associated with acquisitions;
•
diversion of management’s attention from our core business;
•
adverse effects on existing business relationships with suppliers and customers;
•
risks associated with entering new markets in which we have limited or no experience;
•
potential loss of key employees of acquired businesses; and
•
increased legal and accounting compliance costs.
We have no current commitments with respect to any acquisition or investment. We do not know if we will be able to identify acquisitions we deem suitable, whether we will be able to successfully complete any such acquisitions on favorable terms or at all, or whether we will be able to successfully integrate any acquired business, product, or technology into our business or retain any key personnel, suppliers, or distributors. Our ability to successfully grow through acquisitions depends upon our ability to identify, negotiate, complete, and integrate suitable target businesses and to obtain any necessary financing. These efforts could be expensive and time consuming, and may disrupt our ongoing business and prevent management from focusing on our operations. If we are unable to successfully integrate any acquired businesses, products, or technologies effectively, our business, results of operations, and financial condition will be materially adversely affected.
47
We may enter into collaborations, in-licensing arrangements, joint ventures, strategic alliances, or partnerships with third-parties that may not result in the development of commercially viable products or the generation of significant future revenue.
In the ordinary course of our business, we may enter into collaborations, in-licensing arrangements, joint ventures, strategic alliances, partnerships, or other arrangements to develop products and to pursue new markets. We have not entered into any such collaboration arrangements to date. Proposing, negotiating, and implementing collaborations, in-licensing arrangements, joint ventures, strategic alliances, or partnerships may be a lengthy and complex process. Other companies, including those with substantially greater financial, marketing, sales, technology, or other business resources, may compete with us for these opportunities or arrangements. We may not identify, secure, or complete any such transactions or arrangements in a timely manner, on a cost-effective basis, on acceptable terms or at all. We have limited institutional knowledge and experience with respect to these business development activities, and we may also not realize the anticipated benefits of any such transaction or arrangement. In particular, these collaborations may not result in the development of products that achieve commercial success or result in significant revenue and could be terminated prior to developing any products.
It is possible that conflicts may arise with our collaborators, such as conflicts concerning the achievement of performance milestones, or the interpretation of significant terms under any agreement, including those related to financial obligations or the ownership or control of intellectual property developed during the collaboration. If any conflicts arise with any future collaborators, they may act in their self-interest, which may be adverse to our best interest, and they may breach their obligations to us. In addition, we may have limited control over the amount and timing of resources that any future collaborators devote to our or their future products.
Disputes between us and our collaborators may result in litigation or arbitration which would increase our expenses and divert the attention of our management. Further, these transactions and arrangements will be contractual in nature and will generally be terminable under the terms of the applicable agreements and, in such event, we may not continue to have rights to the products relating to such transaction or arrangement or may need to purchase such rights at a premium. If we enter into in-bound intellectual property license agreements, we may not be able to fully protect the licensed intellectual property rights or maintain those licenses. Future licensors could retain the right to prosecute and defend the intellectual property rights licensed to us, in which case we would depend on the ability of our licensors to obtain, maintain and enforce intellectual property protection for the licensed intellectual property. These licensors may determine not to pursue litigation against other companies or may pursue such litigation less aggressively than we would. Further, entering into such license agreements could impose various diligence, commercialization, royalty, or other obligations on us. Future licensors may allege that we have breached our license agreement with them, and accordingly seek to terminate our license, which could adversely affect our competitive business position and harm our business prospects.
The loss of any member on our senior management or our inability to attract and retain highly skilled members of our sales management and marketing teams and engineers could have a material adverse effect on our business, financial condition and results of operations.
Our success depends in part on our continued ability to attract, retain, and motivate highly qualified management, sales and marketing. The loss or incapacity of existing members of our senior management team could have a material adverse effect on our business, financial condition and results of operations if we experience difficulties in hiring qualified successors. We do not maintain “key person” insurance for any of our executives or key employees. We have employment agreements with each of the members of our senior management team; however, the existence of these employment agreements does not guarantee our retention of these senior managers for any period of time.
Our commercial, supply chain and research and development programs and operations depend on our ability to attract and retain highly skilled members of our sales management and marketing teams and engineers. Competition for qualified personnel in the medical device field is intense, due to the limited number of individuals who possess the training, skills, and experience required by our industry. We may be unable to attract or retain qualified member of our sales management and marketing teams or engineers in the future due to the competition for qualified personnel among medical device companies. In addition, to the extent
48
that we hire personnel from competitors, we may be subject to allegations that they have been improperly solicited, that they have divulged proprietary or other confidential information, or that their former employers own their research output. Recruiting and retention difficulties can limit our ability to support our commercial, supply chain and research and development programs. The loss of key employees, failure of any key employee to perform, our inability to attract and retain skilled employees, as needed, or our inability to effectively plan for and implement a succession plan for key employees could have a material adverse effect on our business, financial condition and results of operations.
Unfavorable global and regional economic, political and health conditions could adversely affect our business, financial condition or results of operations.
Our results of operations could be adversely affected by global or regional economic, political and health conditions. A global financial crisis or global or regional political and economic instability (including changes in inflation, interest rates and overall economic conditions and uncertainties), tariffs, wars, terrorism, civil unrest, pandemics, epidemics, endemics and other public health emergencies, and other unexpected events, such as supply chain constraints or disruptions, could cause extreme volatility, increase our costs and disrupt our business. Business disruptions could include, among others, disruptions to our commercial activities, including due to supply chain or distribution constraints or challenges, clinical enrollment, clinical site availability, patient accessibility and conduct of our clinical studies, as well as temporary closures of our facilities and the facilities of suppliers or contract manufacturers in our supply chain. For example, these macroeconomic factors could affect the ability of our current or potential future manufacturers to remain in business, or otherwise manufacture or supply components, materials or services relevant to our systems. Any failure by any of them to remain in business could affect the manufacture of our systems or our ability to meet demand for our systems. In addition, if inflation or other factors were to significantly increase our business costs, we may be unable to pass through price increases to our customers. Interest rates and the ability to access credit markets could also adversely affect the ability of our customers to purchase our systems.
The imposition of tariffs and other orders or restrictions impacting trade could adversely impact our business, including by increasing or otherwise impacting the costs and expenses we incur in connection with our operations and supply chain, and by potentially increasing the price of our systems to purchasers. The actual impacts of any tariffs and other orders or restrictions are subject to a number of factors including the effective date and duration of such tariffs, orders and restrictions, the amount, scope and nature of such inputs, any countermeasures that the target countries may take and any mitigating actions that may become available.
In addition, during certain crises and events, patients may prioritize other items over certain or all of their treatments or delay their requisite spine care, which could have a negative impact on our commercial sales.
A severe or prolonged economic downturn, political disruption or adverse health conditions could result in a variety of risks to our business, including our ability to raise capital when needed on acceptable terms, if at all. Any of the foregoing could harm our business and we cannot anticipate all of the ways in which the political or economic climate and financial market conditions could adversely impact our business.
If rising prices or availability of raw materials continues to persist, our business and results of operations may be adversely affected.
Volatility in raw material prices and availability can impact our business and finances due to numerous factors beyond our control, including general, domestic, and international economic conditions, labor costs, production levels, competition, consumer demand, import duties, inflation and currency exchange rates. This volatility can significantly affect the availability and cost of raw materials that our suppliers purchase and are ultimately used in our systems, and may therefore have a material adverse effect on our business, results of operations, and financial condition. The need to use materials which meet regulatory requirements inhibits the company’s freedom of choice of materials and contracting partners for their supply. In addition, the current U.S. administration has expressed strong concerns about imports from countries that it perceives as engaging in unfair trade practices, and has imposed tariffs or other restrictions on products, components or raw materials sourced from those countries. Moreover, these new tariffs, or other changes in U.S. trade policy, have triggered and may in the future trigger retaliatory actions by affected countries. For example, there have been and continue to be further indications that there may be an increase in tariff rates on various types of goods imported from Canada and Europe that could apply to the raw materials we require in our products,
49
including certain types of metal powders used for coating our products. In the event that any such possible tariff increases remain in place or become enacted in the future, they could significantly increase the cost of materials and components that our suppliers import and use in our systems, which in turn could increase our supply costs. At this time, there can be no assurance that we will be able to pass any portion of such increases on to customers. We currently do not hedge against our exposure to changing raw material prices and are not aware as to whether our suppliers hedge. As a result, fluctuations in raw material prices could have a material adverse effect on our business, results of operations, and financial condition. Supply shortages or changes in availability for any particular type of raw material can delay supplier volume and production capabilities or cause increases in the cost of manufacturing our products. We may be negatively affected by changes in availability and pricing of raw materials, which could negatively impact our results of operations.
Risks Related to Government Regulation
We, our suppliers, and our third-party manufacturers are subject to extensive governmental regulation both in the U.S. and abroad.
The medical device industry is regulated extensively by governmental authorities, principally by the FDA and corresponding state and foreign regulatory agencies. Complying with these regulations is costly and time consuming. The FDA and other U.S. and foreign governmental agencies regulate, among other things, with respect to medical devices:
•
device design, development, and manufacturing;
•
materials and components;
•
testing, labeling, content, and language of instructions for use and storage;
•
clinical studies;
•
product safety;
•
establishment registration and device listing;
•
marketing, sales, and distribution;
•
premarket clearance, approval or certification;
•
record keeping procedures;
•
advertising and promotion;
•
compliance with the QMSR and comparable foreign requirements;
•
recalls and field safety corrective actions;
•
post-market surveillance, including reporting of deaths or serious injuries and device malfunctions that, if they were to recur, could lead to death or serious injury;
•
post-market study requirements; and
•
product import and export.
The regulations to which we are subject are complex and have tended to become more stringently applied over time. Regulatory changes could result in restrictions on our ability to carry on or expand our operations, difficulties achieving new product clearances, certifications or approvals, higher than anticipated costs, or lower than anticipated sales. Before we can market or sell a new regulated product or make a significant modification to an existing product in the U.S., with only limited exceptions, we must obtain FDA 510(k) clearance, PMA approval, or de novo classification.
The FDA enforces its regulatory requirements through, among other means, periodic unannounced inspections. We do not know whether we or any of our third-party manufacturers will be found compliant in connection with any future FDA or foreign inspections. Failure to comply with applicable U.S. requirements may subject us to a variety of administrative or judicial actions and sanctions, such as Form 483 observations, warning letters, untitled letters, product recalls, product seizures, import alerts, total or partial suspension of
50
production or distribution, injunctions, fines, civil penalties, and criminal prosecution. The FDA can also refuse to clear or approve pending applications. Any enforcement action by the FDA and other comparable non-U.S. regulatory agencies could have a material adverse effect on our business, financial condition, and results of operations.
Failure to comply with applicable regulatory requirements could result in costly enforcement actions, which could harm our reputation and cause our business to suffer.
We are subject to ongoing and extensive regulatory requirements governing, among other things, the manufacture, marketing, advertising, medical device reporting, sale, promotion, import, export, registration, and listing of devices. For example, medical device manufacturers must submit certain reports to the FDA and other countries’ regulatory bodies and keep required records as a condition of obtaining and maintaining marketing authorization. These reports include information about failures and certain adverse events potentially associated with the device after its marketing authorization. Failure to submit such reports, or failure to submit the reports in a timely manner, could result in enforcement action by the FDA and other countries’ regulatory bodies. Following its review of the periodic reports, the FDA and other countries’ regulatory bodies might ask for additional information or initiate further investigation.
Regulatory changes could result in restrictions on our ability to continue or expand our operations, higher than anticipated costs, or lower than anticipated sales. The FDA and other regulatory authorities, including foreign authorities, have broad enforcement powers. Regulatory enforcement or inquiries, or other increased scrutiny on us, could dissuade health care providers from using our products and adversely affect our reputation and the perceived safety and effectiveness of our products.
Failure to comply with applicable regulations could jeopardize our ability to sell our products and results in enforcement actions such as:
•
warning or untitled letters;
•
fines;
•
injunctions;
•
consent decrees;
•
field safety corrective actions;
•
civil penalties;
•
termination of distribution;
•
recalls, termination of distribution, administrative detention, or seizures of products;
•
customer notifications or repair, replacement, or refunds;
•
delays in the introduction of products into the market;
•
operating restrictions or total or partial suspension of production;
•
facility closures;
•
delay in or refusal of the FDA or other regulators to grant future clearances or approvals;
•
refusal of the FDA to issue certificates to foreign governments needed to export products for sale in other countries;
•
withdrawals or suspensions of or the placing of conditions upon current clearances or approvals or certificates, resulting in prohibitions on sales of our products; and
•
in the most serious cases, criminal penalties.
Adverse action by the FDA or another regulatory agency could result in inability to produce our products in a cost-effective and timely manner, or at all, decreased sales, higher prices, lower margins, additional unplanned costs or actions, damage to our reputation, and could have material adverse effect on our reputation, business, results of operations, and financial condition.
51
In addition, the FDA may change its marketing authorization policies which may affect future products. The FDA may adopt additional regulations or revise existing regulations, or take other actions, which may prevent or delay marketing authorization of any products under development or impact our ability to modify any products authorized for market on a timely basis. Such changes may also occur in foreign jurisdictions where we may market our products in the future. Such changes could impose additional requirements upon us that could delay our ability to obtain future marketing authorizations, increase the costs of compliance, or restrict our ability to maintain any marketing authorizations we have obtained.
Marketing authorization for new or significantly modified devices could be denied or significantly delayed in the USA.
In the United States, before we can market a new medical device, or a new use of, or other significant modification to an existing, marketed medical device, we must first receive either clearance under Section 510(k) of the Federal Food, Drug, and Cosmetic Act (the “FDCA”), approval of a premarket approval application (“PMA”), or grant of a de novo classification request from the FDA, unless an exemption applies. In the 510(k) clearance process, before a device may be marketed, the FDA must determine that a proposed device is “substantially equivalent” to a legally-marketed “predicate” device, which includes a device that has been previously cleared through the 510(k) process, a device that was legally marketed prior to May 28, 1976 (pre-amendments device), a device that was originally on the U.S. market pursuant to an approved PMA and later down-classified, or a 510(k)-exempt device. To be “substantially equivalent,” the proposed device must have the same intended use as the predicate device, and either have the same technological characteristics as the predicate device or have different technological characteristics and not raise different questions of safety or effectiveness than the predicate device. Clinical data are sometimes required to support substantial equivalence. In the process of obtaining PMA approval, the FDA must determine that a proposed device is safe and effective for its intended use based, in part, on extensive data, including, but not limited to, technical, pre-clinical, clinical study, manufacturing, and labeling data. The PMA process is typically required for devices that are deemed to pose the greatest risk, such as life-sustaining, life-supporting, or implantable devices.
In the de novo classification process, a manufacturer whose novel device under the FDCA would otherwise be automatically classified as Class III and require the submission and approval of a PMA prior to marketing is able to request down-classification of the device to Class I or Class II on the basis that the device presents a low or moderate risk. If the FDA grants the de novo classification request, the applicant will receive authorization to market the device. This device type may be used subsequently as a predicate device for future 510(k) submissions.
The PMA approval, 510(k) clearance and de novo classification processes can be expensive, lengthy, and uncertain. The FDA’s 510(k) clearance process usually takes from three to 12 months, but can take longer. The process of obtaining a PMA is much more costly and uncertain than the 510(k) clearance process and generally takes from one to three years, or even longer, from the time the application is submitted to the FDA. In addition, a PMA generally requires the performance of one or more clinical studies. Clinical data may also be required in connection with an application for 510(k) clearance or a de novo classification request. Despite the time, effort and cost, a device may not obtain marketing authorization by the FDA. We have obtained PMA approvals and 510(k) clearances for our commercialized medical devices, and we must obtain marketing authorization for any future devices we develop, unless they are exempt. Marketing authorizations for any of our future products, if granted, may include significant limitations on the indicated uses for the device, which may limit the potential commercial market for the device.
The FDA can delay, limit or deny marketing authorization of a device for many reasons, including:
•
our inability to demonstrate to the satisfaction of the FDA that our products are substantially equivalent to a predicate device or are safe and effective for their intended uses;
•
the disagreement of the FDA with the design or implementation of clinical studies or the interpretation of data from preclinical or clinical studies;
•
serious and unexpected adverse device effects experienced by participants in clinical studies;
•
the data from preclinical studies and clinical studies may be insufficient to support clearance, de novo classification, or approval, where required;
52
•
our inability to demonstrate that the clinical and other benefits of the device outweigh the risks;
•
the manufacturing process or facilities we use may not meet applicable requirements; and
•
the potential for marketing authorization regulations of the FDA to change significantly in a manner rendering our clinical data or regulatory filings insufficient for marketing authorization.
Even if our new products or significant modifications to our existing products receive marketing authorization in the United States, commercialization of our products in foreign countries would require marketing authorization by regulatory authorities in those countries. Marketing authorization procedures vary among jurisdictions and can involve requirements and administrative review periods different from, and greater than, those in the United States, including additional preclinical studies or clinical studies. Any of these occurrences could have an adverse effect on our business, financial condition and results of operations.
Marketing authorizations for new or significantly modified devices could be denied or significantly delayed in the EU.
Similarly, in the EU, the ability to apply the CE mark to new products, which is accepted not just in the 27 EU member states, but also Norway, Lichtenstein, Iceland, the UK and Turkey and is recognized to varying degrees in other countries globally, depends upon the provision of extensive documentation to regulatory authorities. In the EU, for devices which are in class IIa or above, affixing of the CE mark requires the obtention of a CE certificate of conformity from a notified body which conducts the conformity assessment procedure. Submission to a notified body which undertakes the review and at least two audits and is a time consuming exercise taking from one two three years before providing the necessary certificate. The obtention of the certificate is not a given after submission as up to half of submissions are rejected outright often for lack of adequate clinical data, and such rejection can mean that further clinical data must be obtained ahead a fresh submission.
Material modifications to our devices may require new 510(k) clearance, de novo classification, PMA approval, or PMA supplement approval, or may require us to cease marketing or recall the modified devices until clearances or approvals are obtained.
Material modifications to the intended use or technological characteristics of our devices may require new 510(k) clearance, de novo classification, PMA approval, or PMA supplement approval, or may require us to cease marketing or recall the modified devices until clearances or approvals are obtained. Any modification to a 510(k)-cleared device that could significantly affect its safety or effectiveness, or that would constitute a major change in its intended use, design, or manufacture, generally requires a new 510(k) clearance or, possibly, a PMA. The FDA requires every manufacturer to make and document this determination in the first instance. A manufacturer may determine that a modification could not significantly affect safety or effectiveness and does not represent a major change in its intended use, so that no new 510(k) clearance is necessary. The FDA may review any manufacturer’s decision and may not agree with our decisions regarding whether new clearances or approvals are necessary. The FDA may also on its own initiative determine that a new clearance or approval is required.
We have modified some of our cleared and approved devices and have determined based on our review of the applicable FDA guidance that in certain instances new 510(k) clearances or PMA approvals are not required. If the FDA disagrees with our determination and requires us to submit new marketing authorizations for modifications to our previously authorized products for which we have concluded that new marketing authorizations are unnecessary, we may be required to cease marketing or to recall the modified product until we obtain clearance or approval. In these circumstances, we may be subject to significant enforcement actions, regulatory fines, or penalties, which could require us to redesign our products and harm our operating results. If the FDA requires us to go through a lengthier, more rigorous examination for future products or modifications to existing products than we had expected, product introductions or modifications could be delayed or canceled, which could adversely affect our business.
Material modifications to our devices may require a new notified body certificate in the EU
Where substantial modifications are made to the design or quality management system of a device certified by a notified body in the EU, the company would be required to submit an application to the notified body for a
53
new certificate. That certificate could be denied or delayed, potentially delaying the roll-out of the modified product until the new certification is achieved. If the modification is one that is necessary whether for regulatory or manufacturing reasons, this could mean that the company would need to cease placing devices on the market in the EU and other countries relying on that certificate until the new certification is achieved.
Our products may be subject to product recalls. A recall of our products, either voluntarily or at the direction of the FDA or another governmental authority, or the discovery of serious safety issues with our products, could adversely affect us.
The FDA and similar foreign governmental authorities have the authority to require the recall of commercialized products in the event of material deficiencies or defects in their design or manufacture or in the event that a product poses an unacceptable risk to health.
The FDA’s authority to require a recall for medical devices must be based on a finding that there is reasonable probability that the device would cause serious injury or death. We may also decide to voluntarily recall our products. A government-mandated or voluntary recall could occur as a result of an unacceptable risk to health, component failures, malfunctions, manufacturing errors, design or labeling defects or other deficiencies and issues. We have initiated recalls in the past and may initiate recalls in the future. For example, on December 31, 2025, we initiated a voluntary recall of the prodisc C SK because the product was labeled as including the 6mm device but instead included the 5mm product. This recall affected 20 units in commerce including six that were implanted and was reportable to the FDA as a Class 2 recall. We notified surgery sites and recommend surgeons perform standard post-procedure follow-up. One implanted patient experienced pain, which was transient and resolved without further intervention. We submitted a request to the FDA for termination of the recall on February 13, 2026 and are awaiting FDA’s response.
On March 19, 2026, we then became aware of a similar mislabeling issue with respect to two 30 unit lots of prodisc C SK spinal implants. Specifically, a 30-unit lot of the prodisc C SK PDSXL5, which is an extra-large 5 mm spinal implant, was mislabeled as an extra-large 6 mm spinal implant, resulting in an implant smaller than what is labeled. Additionally, the prodisc C SK PDSXL6, which is an extra-large 6 mm spinal implant, was labeled as a 5 mm spinal implant, resulting in an implant larger than what is labeled. Though the issues were similar, the root causes for this recall and the recall initiated in December 2025 are unique. All affected devices have been accounted for and contained, meaning that they have been returned to us or identified as implanted in patients, of which there were seven patient implants with the incorrectly labeled and sized device. We notified surgery sites and recommended surgeons to perform standard post-procedure follow-up. No patient injury has been identified in connection with the implantation of the recalled devices. A recall report was submitted to the FDA on March 27, 2026 and was reportable to the FDA as a voluntary Class 2 recall. All recall activities were closed on May 15, 2026. We submitted a request to the FDA for termination of the recall on May 15, 2026 and are awaiting FDA’s response.
Companies are required to maintain certain records of recalls and corrections, even if they are not reportable to the FDA. We may initiate voluntary recalls or corrections for our products in the future that we determine do not require notification to the FDA. If the FDA disagrees with our determinations, they could require us to report those actions as recalls and we may be subject to enforcement action.
Similarly, national competent authorities in the EU can require the recall of medical devices and their withdrawal from the market. This is undertaken via a Field Safety Corrective Action to be implemented in each country of sale affected, in agreement with the national competent authorities in these countries, and whereby customers and users of the device are notified via a Field Safety Notice sent by the manufacturer.
We are required to report certain malfunctions, deaths, and serious injuries associated with our products, which can result in voluntary corrective actions or agency enforcement actions.
Under the FDA’s and the EU’s medical device reporting regulations, we are required to report to the FDA and national competent authorities in the EU in which the product is placed on the market when information from any source suggests that our product may have caused or contributed to a death or serious injury or that our product has malfunctioned and, if the malfunction were to recur, would likely cause or contribute to death or serious injury. If we fail to report these events to the FDA or relevant national competent authorities in the
54
EU within the required timeframes, or at all, the FDA or national competent authorities in the EU could take enforcement action against us.
Any adverse event involving our products, whether in the U.S. or abroad, could result in future voluntary corrective actions in multiple countries of the world, such as recalls, including corrections or customer notifications, or agency action, such as inspection or enforcement actions. If malfunctions do occur, we may be unable to correct the malfunctions adequately or prevent further malfunctions, in which case we may need to cease manufacture and distribution of the affected products, initiate voluntary recalls, and redesign the products. Regulatory authorities may also take actions against us, such as ordering recalls, imposing fines, or seizing the affected products. Any corrective action, whether voluntary or involuntary, will require the dedication of our time and capital, distract management from operating our business, and may harm our reputation and financial results.
If we, our suppliers, or our third-party manufacturers fail to comply with FDA’s QMSR or any applicable state or foreign equivalent, our operations could be interrupted, and our potential product sales and operating results could suffer.
We and our third-party manufacturers are required to comply with the QMSR and the applicable regulations of foreign jurisdictions regarding the manufacturing process if we market products in such foreign jurisdictions.
The FDA enforces the QMSR through periodic and announced or unannounced inspections of manufacturing facilities. Similarly, our notified body assesses our quality management system (QMS) and related QMS certificate against the MDR requirements through periodic and announced or unannounced inspections of manufacturing facilities. Our facilities have been inspected by the FDA and other regulatory authorities, and we anticipate that we and our third-party manufacturers will be subject to additional future inspections. If the FDA or our notified body determines during an inspection that our quality management system or the quality management system of our third-party manufacturers does not comply with the QMSR or the MDR requirements concerning QMS, we or the third-party manufacturer could be subject to significant regulatory enforcement actions. Such enforcement actions could include FDA Form 483 observations, warning letters, mandatory product recalls, import alerts, civil monetary penalties, operating restrictions, consent decrees, or suspension or withdrawal of regulatory approvals. In the EU, enforcement action could be suspension or withdrawal of our QMS certificate and/or MDR conformity assessment certificate, preventing the further placing on the market of the relevant device. In addition, any failure to comply with applicable quality system requirements could delay or prevent the clearance or approval of our future products, disrupt manufacturing or commercialization activities, require costly remediation efforts, or result in reputational harm with regulators, customers, and investors.
The FDA’s and other comparable non-U.S. regulatory agencies’ statutes, regulations, policies or interpretations may change, and additional government regulation or statutes may be enacted, which could increase post-approval regulatory requirements, or delay, suspend, prevent marketing of any cleared or approved products or necessitate the recall of distributed products. We cannot predict the likelihood, nature or extent of adverse governmental regulation that might arise from future legislative or administrative action, either in the U.S. or abroad.
If our operations and activities are found to be in violation of any FDA laws or any other governmental regulations that apply to us, we may be subject to penalties, including civil and criminal and administrative penalties, damages, fines and other legal and/or agency enforcement actions including conditioning, withdrawal or suspension of authorisations, licenses or certificates. Any penalties, damages, fines, or curtailment or restructuring of our operations or activities could adversely affect our ability to operate our business and our financial results. The risk of us being found in violation of the FDA laws is increased by the fact that many of these laws are broad and their provisions are open to a variety of interpretations. Any action against us for violation of these laws, even if we successfully defend ourselves against that action and its underlying allegations, could cause us to incur significant legal expenses and divert management’s attention from the operation of our business. Where there is a dispute with a federal or state governmental agency that cannot be resolved to the mutual satisfaction of all relevant parties, we may determine that the costs, both real and contingent, are not justified by the commercial returns to us from maintaining the dispute or the product.
55
Various claims, design features or performance characteristics of our medical devices that we regarded as permitted by the FDA without new marketing clearance or approval may be challenged by the FDA or state or foreign regulators. The FDA or state or foreign regulatory authorities may find that certain claims, design features or performance characteristics, in order to be made or included in the products, may have to be supported by further clinical studies and marketing clearances, certifications or approvals, which could be lengthy, costly and possibly unobtainable.
The results of preclinical and clinical studies of our products conducted to date and ongoing or future studies of our current, planned or future products may not be predictive of the results of later clinical studies.
The results of early clinical studies are not necessarily predictive of future results, and any product, or new indication for use, we advance into clinical studies may not have favorable results in later clinical studies.
Regulatory authorities may disagree with our interpretation of data and results from our clinical studies, and favorable results do not ensure that we will achieve similar results in future clinical studies. Preclinical and clinical data are often susceptible to various interpretations and analyses, and many companies that have believed their products performed satisfactorily in preclinical studies and earlier clinical studies have nonetheless failed to replicate results in later clinical studies. Failure can occur at any stage of clinical testing. Our clinical studies may produce negative or inconclusive results, and we may decide, or regulators may require us, to conduct additional clinical and non-clinical testing in addition to those we have planned.
Clinical studies necessary to support a 510(k) premarket notification, de novo classification request, or PMA application or certification by a notified body in the EU can be expensive and may require the enrollment of large numbers of patients, and suitable patients may be difficult to identify and recruit. Delays or failures in our clinical studies will prevent us from commercializing modified or new products, or new indications for use for existing products, and will adversely affect our business, operating results, and prospects.
Initiating and completing clinical studies necessary to support a 510(k) premarket notification, de novo classification request, or PMA application or certification by a notified body in the EU for our future products would be time consuming and expensive and the outcome uncertain.
The initiation and completion of any of clinical studies may be prevented, delayed, or halted for numerous reasons. We may experience delays in our ongoing clinical studies for a number of reasons, which could adversely affect the costs, timing or successful completion of our clinical studies, including related to the following:
•
we may be required to submit an IDE application to FDA, which must become effective prior to commencing certain human clinical studies of medical devices, and FDA may reject our IDE application and notify us that we may not begin clinical studies;
•
We may be required to submit an application to EU competent authorities for authorisation to undertake clinical studies in their country and which might be rejected and thus we would be unable to commence the trial;
•
regulators may disagree as to the design or implementation of our clinical studies;
•
regulators and/or IRBs or ethics committees, or other reviewing bodies may not authorize us or our investigators to commence a clinical study, or to conduct or continue a clinical study at a prospective or specific trial site;
•
we may not reach agreement on acceptable terms with prospective contract research organizations (“CROs”), and clinical study sites, the terms of which can be subject to extensive negotiation and may vary significantly among different CROs and trial sites;
•
clinical studies may produce negative or inconclusive results, and we may decide, or regulators may require us, to conduct additional clinical studies or abandon product development programs;
•
the number of subjects required for clinical studies may be larger than we anticipate, enrollment in these clinical studies may be insufficient or slower than we anticipate, and the number of clinical studies being conducted at any given time may be high and result in fewer available subjects for any given clinical study, or subjects may drop out of these clinical studies at a higher rate than we anticipate;
56
•
our third-party contractors, including those manufacturing products or conducting clinical studies on our behalf, may fail to comply with regulatory requirements or meet their contractual obligations to us in a timely manner, or at all;
•
we might have to suspend or terminate clinical studies for various reasons, including a finding that the subjects are being exposed to unacceptable health risks;
•
we may have to amend clinical study protocols or conduct additional studies to reflect changes in regulatory requirements or guidance, which we may be required to submit to an IRB or ethics committees and/or regulatory authorities for re-examination;
•
regulators, IRBs or ethics committees, or other parties may require or recommend that we or our investigators suspend or terminate clinical research for various reasons, including safety signals or noncompliance with regulatory requirements;
•
the cost of clinical studies may be greater than we anticipate;
•
clinical sites may not adhere to the clinical protocol or may drop out of a clinical study;
•
we may be unable to recruit a sufficient number of clinical study sites;
•
regulators, IRBs or ethics committees, or other reviewing bodies may fail to approve or subsequently find fault with our manufacturing processes or facilities of third-party manufacturers with which we enter into agreement for clinical and commercial supplies, the supply of devices or other materials necessary to conduct clinical studies may be insufficient, inadequate or not available at an acceptable cost, or we may experience interruptions in supply;
•
approval policies or regulations of the FDA or applicable foreign regulatory agencies may change in a manner rendering our clinical data insufficient for approval; and
•
our current or future products may have undesirable side effects or other unexpected characteristics.
Any of these occurrences may significantly harm our business, financial condition and prospects. In addition, many of the factors that cause, or lead to, a delay in the commencement or completion of clinical studies may also ultimately lead to the denial of regulatory approval of our product candidates.
Conducting successful clinical studies may require the enrollment of large numbers of patients, and suitable patients may be difficult to identify and recruit. Patient enrollment in clinical studies and completion of patient participation and follow-up depends on many factors, including the size of the patient population, the nature of the trial protocol, the attractiveness of, or the discomforts and risks associated with, the treatments received by enrolled subjects, the availability of appropriate clinical study investigators, support staff, and proximity to clinical sites, and the ability to comply with the inclusion and exclusion criteria for participation in the clinical study and patient compliance. Development of sufficient and appropriate clinical protocols to demonstrate safety and effectiveness are required and we may not adequately develop such protocols to support clearance and approval. Further, the FDA or other regulatory authorities may require us to submit data on a greater number of patients than we originally anticipated and/or for a longer follow-up period or change the data collection requirements or data analysis applicable to our clinical studies.
Delays in patient enrollment or failure of patients to continue to participate in a clinical study may cause an increase in costs and delays in the approval and attempted commercialization of our products or result in the failure of the clinical study. In addition, despite considerable time and expense invested in our clinical studies, the FDA or other regulatory authorities may not consider our data adequate to demonstrate safety and effectiveness. Such increased costs and delays or failures could adversely affect our business, operating results and prospects.
Our clinical study sites must operate under procedures that govern the conduct and management of the FDA-regulated clinical studies pursuant to Good Clinical Practices (“GCP”). The FDA or other regulatory authorities may conduct Bioresearch Monitoring or equivalent inspections of us and/or our clinical sites to assess compliance with FDA regulations, our procedures, and the clinical protocol. If the FDA or other regulatory authorities were to find that we, our CROs, or our clinical investigators are not operating in compliance with applicable regulations, we could be subject to FDA or other regulatory authorities
57
enforcement action, as well as refusal to accept all or part of our data in support of a premarket submission, or we may need to conduct additional studies.
If we conduct clinical studies designed to generate long-term data on some of our existing products, the data we generate may not be consistent with our existing data and may demonstrate less favorable safety or efficacy. Data we generate may ultimately not be favorable, or could even hurt the commercial prospects for our products.
We do not expect to conduct clinical studies to generate long-term data for all of our products and will only do so in the future where we anticipate the benefits will outweigh the costs and risks. For these reasons, surgeons and physicians could be less likely to purchase our products than competing products for which longer-term clinical data are available. Also, we may not choose or be able to generate the comparative data that some of our competitors have or are generating, and we may be subject to greater regulatory and product liability risks. If we are unable to or unwilling to collect sufficient long-term clinical data supporting the quality, safety and effectiveness of our existing products, our business, results of operations and financial condition could be adversely affected.
We may rely on third parties to conduct our clinical studies and to assist us with preclinical development and if they fail to perform as contractually required or expected, we may not be able to obtain regulatory clearance or approval to commercialize our products.
We have relied upon and may continue to rely upon third parties, such as CROs, medical institutions, clinical investigators and contract laboratories to assist in conducting our preclinical development activities and our clinical studies, which must be conducted in accordance with applicable regulations, including GCP. We rely on these parties for execution of our studies, and control only certain aspects of their activities. Nevertheless, we are responsible for ensuring that each of our clinical studies is conducted in accordance with the applicable protocol, legal, regulatory, and scientific standards, and our reliance on these third parties does not relieve us of our regulatory responsibilities. GCPs are regulations and guidelines enforced by the FDA and other regulatory authorities for products in clinical development. Regulatory authorities enforce these GCPs through periodic inspections of trial sponsors, principal investigators, trial sites, and CROs. We cannot assure you that upon inspection by a given regulatory authority, such regulatory authority will determine that any of our clinical studies comply with GCP regulations. In addition, our clinical studies must be conducted with product produced under applicable manufacturing requirements.
If these third parties fail to successfully carry out their contractual duties, comply with applicable regulatory obligations, including GCP requirements, or meet expected deadlines, or if these third parties must be replaced, or if the quality or accuracy of the data they obtain is compromised due to the failure to adhere to clinical protocols or applicable regulatory requirements or for other reasons, our pre-clinical development activities or clinical studies may be extended, delayed, suspended or terminated. Under these circumstances we may not be able to obtain regulatory clearance or approval for, or successfully commercialize, our products on a timely basis, if at all, and our business, results of operations and financial condition may be adversely affected.
If any of our relationships with these third parties terminate, we may not be able to enter into arrangements with alternative third parties or to do so on commercially reasonable terms. In addition, our third parties are not our employees, and except for remedies available to us under our agreements with them, we cannot control whether or not they devote sufficient time and resources to our on-going clinical, nonclinical and preclinical programs. Switching or adding additional third parties involves additional cost and requires management time and focus. In addition, there is a natural transition period when a new CRO or other third-party vendor commences work. As a result, delays occur, which can materially impact our ability to meet our desired development timelines. Though we carefully manage our relationships with our third-party vendors including CROs, there can be no assurance that we will not encounter similar challenges or delays in the future or that these delays or challenges will not have a material adverse impact on our business, financial condition and prospects.
Disruptions at the FDA and other government agencies caused by funding shortages or staffing limitations could hinder their ability to hire, retain or deploy key leadership and other personnel, prevent new or modified products from being developed, review, approved or commercialized in a timely manner or at all, which could negatively impact our business.
The ability of the FDA and foreign regulatory authorities to review and approve new products can be affected by a variety of factors, including government budget and funding levels, statutory, regulatory, and policy
58
changes, the FDA’s or foreign regulatory authorities’ ability to hire and retain key personnel and accept the payment of user fees, and other events that may otherwise affect the FDA’s or foreign regulatory authorities’ ability to perform routine functions. In addition, government funding of other government agencies that fund research and development activities is subject to the political process, which is inherently fluid and unpredictable. Disruptions at the FDA and other agencies may also slow the time necessary for new products or modifications to existing products to be reviewed and/or approved by necessary government agencies, which would adversely affect our business. For example, in recent years, the U.S. government has shut down several times and certain regulatory agencies, such as the FDA, have had to furlough critical FDA employees and stop critical activities. In addition, the current U.S. Presidential administration has issued certain policies and Executive Orders directed towards reducing the employee headcount and costs associated with U.S. administrative agencies, including the FDA, and it remains unclear the degree to which these efforts may limit or otherwise adversely affect the FDA’s ability to conduct routine activities. If a prolonged government shutdown occurs, or if funding shortages or staffing limitations hinder or prevent the FDA or other regulatory authorities from conducting their regular inspections, reviews, or other regulatory activities, it could significantly impact the ability of the FDA or other such regulatory authorities to timely review and process our regulatory submissions, which could have a material adverse effect on our business.
We are subject to federal, state and foreign laws and regulations relating to our healthcare business, and could face substantial penalties if we are determined not to have fully complied with such laws, which would adversely affect our business, results of operations and financial condition.
We are subject to healthcare fraud and abuse regulation and enforcement by federal, state and foreign governments, which could adversely impact our business, results of operations and financial condition. Healthcare fraud and abuse and health information privacy and security laws potentially applicable to our operations include:
•
the federal Anti-Kickback Statute, which applies to our operations, including our marketing practices, educational programs, pricing and discounting policies and relationships with healthcare providers, by prohibiting, among other things, persons and entities from knowingly and willfully soliciting, receiving, offering or providing remuneration intended to induce or reward, or in return for, either the referral of an individual for, or the purchase, order or recommendation of an item or service reimbursable under a federal healthcare program, such as the Medicare or Medicaid programs. A person or entity does not need to have actual knowledge of this statute or specific intent to violate it to have committed a violation;
•
the federal civil and criminal false claims laws, including the federal civil False Claims Act, which prohibits, among other things, individuals or entities from knowingly presenting, or causing to be presented, claims for payment or approval to the federal government that are false or fraudulent, knowingly making a false statement material to an obligation to pay or transmit money or property to the federal government or knowingly concealing or knowingly and improperly avoiding or decreasing an obligation to pay or transmit money or property to the federal government. Suits filed under the False Claims Act, can be brought by any individual on behalf of the government, known as “qui tam” actions, and such individuals, commonly known as “whistleblowers,” may share in any amounts paid by the entity to the government in fines or settlement. The frequency of filing qui tam actions has increased significantly in recent years, causing greater numbers of medical device and other healthcare companies to have to defend a False Claims Act action. The government may assert that a claim including items or services resulting from a violation of the federal Anti-Kickback Statute constitutes a false or fraudulent claim for purposes of the false claims statutes;
•
the federal Civil Monetary Penalties Law, which impose civil fines for, among other things, the offering or transfer of remuneration to a Medicare or state healthcare program beneficiary if the person knows or should know it is likely to influence the beneficiary’s selection of a particular provider, practitioner, or supplier of services reimbursable by Medicare or a state healthcare program, unless an exception applies;
•
the Health Insurance Portability and Accountability Act, or HIPAA, and its implementing regulations, which created federal criminal laws that prohibit, among other things, executing or attempting to execute a scheme to defraud any healthcare benefit program or making false statements relating to
59
healthcare matters. Similar to the federal Anti-Kickback Statute, a person or entity does not need to have actual knowledge of the statute or specific intent to violate it to have committed a violation;
•
HIPAA, as amended by the Health Information Technology for Economic and Clinical Health Act of 2009, or HITECH, and its implementing regulations, imposes obligations, including mandatory contractual terms, with respect to safeguarding the privacy, security and transmission of individually identifiable health information without appropriate authorization by covered entities subject to the rule, such as health plans, healthcare clearinghouses and certain healthcare providers as well as their business associates and covered subcontractors that perform certain services for or on their behalf involving the use or disclosure of individually identifiable health information;
•
in the EEA and United Kingdom, GDPR imposes obligations relating to personal data (including health data) including relating to processing health and other sensitive data, in certain circumstances obtaining consent of the individuals to whom the personal data relates, providing information to individuals regarding data processing activities, implementing safeguards to protect the security and confidentiality of personal data, providing notification of data breaches, and taking certain measures when engaging third-party processors;
•
the federal Physician Payments Sunshine Act, which requires manufacturers of drugs, devices, biologics and medical supplies for which payment is available under Medicare, Medicaid or the Children’s Health Insurance Program (with certain exceptions) to report annually to the government information related to certain payments or other “transfers of value” made to physicians (defined to include doctors, dentists, optometrists, podiatrists and chiropractors) and teaching hospitals, certain other healthcare professionals such as physician assistants and nurse practitioners, as well as ownership and investment interests held by physicians and their immediate family members;
•
federal consumer protection and unfair competition laws, which broadly regulate marketplace activities and activities that potentially harm consumers; and
•
state and foreign law equivalents of each of the above federal laws and regulations, such as anti-kickback, self-referral, and false claims and anti-bribery laws that may be broader in scope and apply to items or services reimbursed by any third-party payor, including commercial insurers; state laws that require medical device companies to comply with the industry’s voluntary compliance guidelines and the relevant compliance guidance promulgated by the federal government, other governmental regulators or law enforcement officers, or otherwise that restrict payments that may be made to healthcare providers; and state laws that require drug and device manufacturers to report information related to payments and other transfers of value to physicians and other healthcare providers or marketing expenditures and pricing information. Most European countries and/or government hospitals and clinics have laws and rules limiting interactions between the medical device industry and healthcare providers, healthcare organizations, and patient organizations. In some countries, our interactions with these persons and/or organizations are also subject to prior authorization or notification requirements and/or to requirements to publish information detailing these interactions together with the value of support or payments provided. In addition, we follow the MedTech Europe Code of Ethical Business Practice, which sets forth industry standards governing interactions between medical technology companies and healthcare professionals, and we comply with applicable national sunshine and transparency reporting obligations in the EU member states in which we operate. Failure to meet these requirements can lead to criminal, administrative and civil sanctions being imposed, as well as potential exclusion from EU tendering opportunities.
We have entered into royalty and data license or data provision agreements (collectively, referred to as “data agreements”) with two surgeons, who are customers. The royalty agreement is with one of the inventors of prodisc intellectual property. Pursuant to our data agreements, we licensed certain de-identified data collected by these surgeons and obtained intellectual property rights to any aggregation or summary of such data. In consideration for the data delivered to us under these data agreements, we made certain cash payments, issued options or are obligated to pay a license fee, as applicable. The impact of these arrangements is not significant to our operations.
We typically loan our customers the surgical instrument sets necessary to perform procedures using our products for each surgery at no additional charge. We also engage in co-marketing arrangements with certain
60
surgeons who use our products. In addition, certain of our customer surgeons and distributors acquired from us directly or indirectly, in the aggregate, approximately 5.9% of our current outstanding units, which were principally purchased in an arm’s length transaction on terms identical to those offered to others. While all of these transactions were structured with the intention of complying with all applicable laws, including the federal Anti-Kickback Statute, state anti-kickback laws and other applicable laws, it is possible that regulatory agencies may view these transactions as prohibited arrangements that must be restructured, or discontinued, or for which we could be subject to significant penalties and criminal, civil and administrative liability. We would be materially and adversely affected if regulatory agencies interpret our financial relationships with surgeons who order our products to be in violation of applicable laws and we were unable to comply with such laws, which could subject us to, among other things, monetary penalties for non-compliance, the cost of which could be substantial.
The risk of us being found in violation of these laws and regulations is increased by the fact that many of them have not been fully interpreted by the regulatory authorities or the courts, and their provisions are open to a variety of interpretations. We are unable to predict what additional federal, state or foreign legislation or regulatory initiatives may be enacted in the future regarding our business or the healthcare industry in general, or what effect such legislation or regulations may have on us. Federal, state or foreign governments may impose additional restrictions or adopt interpretations of existing laws that could adversely affect us.
Because of the breadth of these laws and the narrowness of the statutory exceptions and safe harbors available under such laws, it is possible that some of our business activities could be subject to challenge under one or more of such laws. Any action against us for violation of these laws, even if we successfully defend against it, could cause us to incur significant legal expenses and divert our management’s attention from the operation of our business. If our operations are found to be in violation of any of the laws described above or any other governmental regulations that apply to us, we may be subject to penalties, including significant administrative, civil and criminal penalties, damages, fines, imprisonment, exclusion from governmental healthcare programs, disgorgement, contractual damages, additional regulatory monitoring and oversight if we become subject to a corporate integrity agreement or similar agreement to resolve allegations of non-compliance with these laws, reputational harm, diminished profits and future earnings, and the curtailment or restructuring of our operations, any of which could adversely impact our business, results of operations and financial condition. Further, if any of the surgeons or other healthcare providers or entities with whom we do business is found to be not in compliance with applicable laws, they may be subject to significant administrative, civil and criminal sanctions, including exclusion from government funded healthcare programs.
Healthcare regulatory reform may affect our ability to sell our products profitably and could adversely affect our business, results of operations and financial condition.
In the United States and in certain foreign jurisdictions, there have been a number of legislative and regulatory proposals to change the regulatory and healthcare systems in ways that could prevent or delay marketing approval of our products in development, restrict or regulate post-approval activities of our products and impact our ability to sell our products profitably. In the United States in recent years, new legislation has been proposed and adopted at the federal and state level that is effecting major changes in the healthcare system. In addition, new regulations and interpretations of existing healthcare statutes and regulations are frequently adopted.
In March 2010, the Patient Protection and Affordable Care Act, as amended by the Health Care and Education Reconciliation Act, or collectively, the ACA, was signed into law. While the goal of healthcare reform is to expand coverage to more individuals, it also involves increased government price controls, additional regulatory mandates and other measures designed to constrain medical costs. The ACA substantially changed the way healthcare is financed by both governmental and private insurers, encourages improvements in the quality of healthcare items and services and significantly impacts the medical device industry. Among other things, the ACA established new value-based payment programs, increased funding of comparative effectiveness research, reduced hospital payments for avoidable readmissions and hospital acquired conditions, and pilot programs to evaluate alternative payment methodologies that promote care coordination (such as bundled physician and hospital payments).
In addition, third-party payors regularly update payments to physicians, hospitals and ASCs where our products are used. For example, the Medicare Access and CHIP Reauthorization Act of 2015, or MACRA,
61
ended the use of the Sustainable Growth Rate Formula, and introduced a merit-based incentive bonus program for Medicare physicians also referred to as the Quality Payment Program. Any resulting decrease in payment under the merit-based reimbursement system may adversely affect our revenue and results of operations. Any reduction in reimbursement from Medicare or other government programs may result in a similar reduction in payments from private payors. In addition, the Budget Control Act of 2011, which, subject to certain temporary suspension periods, imposed reductions to Medicare payments to providers per fiscal year starting April 1, 2013, and, due to subsequent legislative amendments, will stay in effect through 2032, unless additional Congressional action is taken. In January 2013, the American Taxpayer Relief Act of 2012 was signed into law, which, among other things, further reduced Medicare payments to several types of providers, and increased the statute of limitations period for the government to recover overpayments to providers from three to five years. These and other payment updates could directly impact the demand for our products or any products we may develop in the future, if cleared or approved.
More recently, on July 4, 2025, the One Big Beautiful Bill Act, or OBBBA, was signed into law, which narrowed access to ACA marketplace exchange enrollment and declined to extend the ACA enhanced advanced premium tax credits that expired at the end of 2025, which, among other provisions in the law, are anticipated to reduce the number of Americans with health insurance. The OBBBA also is expected to reduce Medicaid spending and enrollment by implementing work requirements for some beneficiaries, capping state-directed payments, reducing federal funding, and limiting provider taxes used to fund the program. Congress is considering proposed legislation intended to further reduce healthcare costs with alternatives to replace the expired ACA subsidies.
Additional federal and state healthcare reform measures may be adopted in the future, which may result in additional reductions in Medicare and other healthcare funding, more rigorous coverage criteria, new payment methodologies and in additional downward pressure on the price that we receive for any cleared or approved products. Further, it is possible that additional governmental action is taken in response to the future pandemics or disease outbreaks.
In the EU, the regulatory landscape concerning medical devices continues to undergo legislative changes. These requirements are in active implementation and may change as the European Commission adopts additional implementing acts and considers targeted revisions to related medical device rules. On December 16, 2025, the European Commission published a targeted revision proposal of the MDR to address structural issues, certification delays, and burdens on small and medium-sized enterprises. The proposal will need to follow the EU ordinary legislative procedure once finalized and is not expected to be adopted before 2027. These amendments, if adopted, may have an effect on the way we conduct our business in the EU and could result in additional requirements, costs, or delays in obtaining or maintaining CE certification for our products.
Further, on December 13, 2021, the EU adopted Regulation No 2021/2282 on Health Technology Assessment (HTA Regulation), amending Directive 2011/24/EU. The HTA Regulation entered into force in January 2022 and has been applicable since January 2025, with phased implementation based on the type of product, including certain high-risk medical devices as of 2026. The HTA Regulation intends to boost cooperation among EU member states in assessing health technologies, including certain high-risk medical devices, and provide the basis for cooperation at the EU level for joint clinical assessments in these areas. It will permit EU member states to use common HTA tools, methodologies, and procedures across the EU, working together in four main areas, including joint clinical assessment of the innovative health technologies with the highest potential impact for patients, joint scientific consultations whereby developers can seek advice from HTA authorities, identification of emerging health technologies to identify promising technologies early, and continuing voluntary cooperation in other areas. Individual EU member states will continue to be responsible for assessing non-clinical (e.g., economic, social, ethical) aspects of health technology, and making decisions on pricing and reimbursement. Given that our implant products are, or will be, classified as Class III under the MDR, they may be subject to joint clinical assessments at the EU level under the HTA Regulation, which could affect market access, reimbursement, and the clinical data requirements applicable to our products.
We, our suppliers, and our third-party manufacturers are subject to extensive government regulation in relation to products being placed on the market in Europe, including medical device regulations in the EU which are still in the transitional phase.
We, our suppliers, and our third-party manufacturers are subject to extensive governmental regulation in relation to products being placed on the market in Europe. In the EU, medical device laws are in a transitional
62
phase, with new regulations replacing the previous directives (Directive 93/42/EEC (MDD)). Modifications arising from the new EU regulations (Regulation (EU) 2017/745 (MDR)) will affect the regulation of our products placed on the market in all countries accepting CE marked medical devices. These countries include the EU 27 member states, the United Kingdom, or UK (until June 30, 2023), the EEA countries of Norway, Lichtenstein and Iceland, as well as many other countries around the world.
Under MDR there is no grandfathering—all devices must undergo a new regulatory review and rewriting of regulatory documents and processes, all of which are more detailed and rigorous than under the MDD. For devices that require a notified body certificate of conformity, it is necessary for us to supply clinical evidence of safety and efficacy in relation to the manufacturer’s intended purpose, and a much more detailed set of technical documentation. There is a process for “legacy devices”, which are those that were regulated under the MDD and which a manufacturer wants to transition to certification under the MDR. Manufacturers of legacy devices must by May 26, 2024 have a QMS compliant with the MDR in place and applied to a notified body for a conformity assessment. No later than September 26, 2024 we must have in place with a notified body have signed a written agreement for the conformity assessment of each of our legacy devices.
The QMS includes our post-market surveillance, or PMS, system as well as agreements with critical suppliers including QMS allowing the manufacturer some control over communications with competent authorities. As a manufacturer based outside the EU, we must appoint an EU importer whose details must be included with the products, as well as an authorized representative whose contact details must be on the labeling. There are also complex registration and information requirements with a new medical devices database (EUDAMED), and a requirement to include a unique device identifier on every device. Obligations relating to registration will be imposed gradually as the database comes online, which is occurring in a modular fashion, and is obligatory for the first four modules from May 26, 2026.
The MDR has been fully applicable since May 26, 2021. In accordance with the MDR’s recently extended transitional provisions, both (i) devices lawfully placed on the market pursuant to the MDD prior to May 26, 2021 and (ii) legacy devices lawfully placed on the EU market after May 26, 2021 in accordance with the MDR transitional provisions may generally continue to be made available on the market or put into service, provided that the requirements of the transitional provisions are fulfilled. In particular, no significant change must be made to the device, as such a modification would trigger the obligation to obtain a new certification under the MDR and therefore to have a notified body conduct a new conformity assessment of the device. The extended transitional deadlines are December 31, 2027 for Class III and certain Class IIb implantable devices and December 31, 2028 for other Class IIb devices, Class IIa devices and certain Class I devices. However, even during the transitional period, manufacturers must comply with a number of new or reinforced requirements set forth in the MDR with regard to registration of economic operators and of devices, post-market surveillance and vigilance requirements. In the EU, our implant products are currently classified as Class IIb under the MDD (pursuant to certificates issued by BSI, our notified body) and will be classified as Class III under the MDR. Our surgical instruments are classified separately as Class IIa or Class I (reusable) devices. Class III devices under the MDR require the highest level of regulatory controls and the best quality clinical evidence from clinical studies to demonstrate an appropriate risk-benefit analysis in respect of safety and efficacy.
Under the MDR, Class III implantable devices are subject to an additional review by the European Commission’s relevant expert panel as part of the conformity assessment process. For products undergoing MDR conformity assessment, the expert panel issues a scientific opinion which can recommend that a device might or might not be placed on the market, or that the intended purpose of the device be restricted by type of patient or indication and to limit the period of validity for the certificate. The notified body is likely to follow the opinion of the EU regulatory panel when issuing its certificate, and there is no appeal process with respect to the scientific opinion. In the EU, we are required to have a QMS that is documented and maintained and is subject to notified body audit, both at the outset to obtain certification allowing our products to be placed on the market, and periodically thereafter. If there is an unacceptable level of major non-conformities in any audit, national competent authorities in the EU can prohibit the further sale of our products in the EU, as well as requiring a recall of distributed products. This could prevent us from fulfilling our contracts and might lead to breach of tenders, which could detrimentally affect future sales and tender awards. We would be obliged to take remedial action, which could be costly, and our products could be out of the market for a period of time, leading to a decrease in revenues in the EU.
63
The MDR requires that before placing a device on the market, manufacturers (as well as other economic operators such as authorized representatives and importers) must register by submitting identification information to the European Database on Medical Devices (EUDAMED), unless they have already registered. The MDR also requires that before placing a device on the market, manufacturers must assign a unique identifier to the device and provide it, along with other core data, to the unique device identifier (UDI) database within EUDAMED. These requirements aim at ensuring better identification and traceability of devices. Manufacturers are also notably responsible for entering the necessary data on EUDAMED, which includes the UDI database, and for keeping it up to date. The obligations for registration in EUDAMED will become applicable on May 28, 2026, for the four first modules related to (i) economic actor and (ii) UDI/devices registrations, (iii) notified bodies and certificates, and (iv) market surveillance. Until EUDAMED is fully functional, the corresponding provisions of the MDD continue to apply for the purpose of meeting the obligations laid down in the provisions regarding exchange of information, including, and in particular, information regarding registration of devices and economic operators. We are in the process of ensuring compliance with these forthcoming EUDAMED registration obligations. Failure to timely register in EUDAMED or to comply with the UDI requirements could result in enforcement action by EU competent authorities and could adversely affect our ability to place our products on the EU market.
Under the MDR, medical devices must be designed and manufactured in such a way that, during normal conditions of use, they are suitable for their intended purpose and must meet the applicable general safety and performance requirements (GSPR). Only devices that have undergone the applicable conformity assessment procedure allowing the affixing of a CE mark may be marketed and advertised in the EU in accordance with their intended purpose, and off-label promotion is prohibited. Although surgeons may, in their independent medical judgment, use medical devices for indications other than those covered by the CE mark for the particular device, we do not systematically monitor off-label use of our products in the EU or elsewhere. For Class III and Class IIb implantable devices, the MDR specifically requires that the PMS plan provide for proactive and systematic collection and evaluation of data on the quality, performance and safety of devices throughout their entire lifetime, and that this data feed into the manufacturer’s clinical evaluation and risk management processes. Where off-label use is known to occur, this obligation extends to the capture and evaluation of related safety data as part of the PMS system. We conduct annual clinical evaluation reports and monitor complaints on a global basis through our quarterly management review process; however, we do not systematically collect or evaluate data on off-label use of our products. This means that safety signals arising from uses outside our devices’ intended purpose may not be fully captured, which could affect the completeness of our PMS data, clinical evaluation reports, and periodic safety update reports required under the MDR. If EU competent authorities or our notified body, BSI, were to determine that our PMS system does not adequately address off-label use patterns or that our clinical evaluation is incomplete in this respect, we could face non-conformity findings during surveillance audits, requests for corrective action, or delays in obtaining or renewing CE certificates of conformity. In addition, if adverse events were to arise from off-label use that we did not detect or report in a timely manner through our vigilance system, we could be subject to enforcement action by EU competent authorities, which could include suspension of sales, product recalls, or fines and other sanctions.
Significant changes to our devices will require new notified body certificates of conformity, and if our submission is not accepted, our notified body may require us to cease placing affected products on the market or to not implement the change.
In the EU, we are unable to make any significant changes to our medical devices until we receive our new MDR certificate of conformity from our notified body. If technical, operational or regulatory reasons necessitate a substantial change to a product requiring a notified body certificate of conformity, we might have to remove it from the market until we obtain our MDR certificate or decide not to implement the contemplated change.
In the EU, there are continuing obligations for post-market compliance and which, if not complied with, could lead to fines, penalties, criminal sanctions and a requirement to withdraw our products from the market.
The EU regulatory system for medical devices requires a continuous system of vigilance, testing and review. Any potential issues with a device can lead to lengthy and time-consuming correspondence with national competent authorities and investigations by them and by notified bodies. In the EU, national competent
64
authorities and notified bodies have the power to request that new instructions are issued to the market regarding a device, or that sales are suspended, products quarantined and, in some cases, withdrawn from the market altogether. Manufacturing sites as well as distribution centers and regulatory activities might also be audited at any time by affected competent authorities and by any relevant notified body. The changes to the PMS under the MDR require that the PMS is proactive rather than simply reactive. The MDR also requires a higher level of engagement with distributors and other economic operators to assure product compliance throughout the supply chain.
In the EU, adverse events must be reported to national regulatory authorities and appropriate market action taken.
Foreign regulatory authorities have very similar reporting requirements to those in the United States for adverse events, and similar enforcement actions where there is noncompliance. All manufacturers placing medical devices on the market in the EU must comply with the EU medical device vigilance system, which has been reinforced by the MDR. Under this system, serious incidents and Field Safety Corrective Actions (FSCAs) must be reported to the relevant authorities of the EU member states. These reports will have to be submitted through EUDAMED once functional and aim to ensure that, in addition to reporting to the relevant authorities of the EU member states, other actors such as the economic operators in the supply chain will also be informed.
Manufacturers are required to take Field Safety Corrective Actions (FSCAs), which are defined as any corrective action for technical or medical reasons to prevent or reduce a risk of a serious incident associated with the use of a medical device that is made available on the market. A serious incident is any malfunction or deterioration in the characteristics or performance of a device on the market (e.g., inadequacy in the information supplied by the manufacturer, undesirable side-effect), which, directly or indirectly, might lead to either the death or serious deterioration of the health of a patient, user, or other persons, or to a serious public health threat. An FSCA may include the recall, modification, exchange, destruction or retrofitting of the device. FSCAs must be communicated by the manufacturer or its legal representative to its customers and/or to the end users of the device through Field Safety Notices (FSN). For similar serious incidents that occur with the same device or device type and for which the root cause has been identified or an FSCA implemented or where the incidents are common and well documented, manufacturers may provide periodic summary reports instead of individual serious incident reports.
Manufacturers (and authorized representatives) must also have available within their organization at least one person responsible for regulatory compliance, or PRRC, who possesses the requisite expertise in the field of medical devices. The PRRC is responsible for all aspects of compliance with the requirements of the MDR and in particular compliance with post-market surveillance and vigilance requirements. Authorized representatives are also required to have their own PRRC.
In the event of a serious adverse event, national competent authorities might require that corrective action is taken, including a withdrawal of the product from the EU market and the notified body might withdraw or suspend their conformity assessment certificate, preventing further products being placed on the market. Corrective actions are required to be notified via FSN issued to every person on the supply chain for the products. Each such person is required to acknowledge the notice and confirm that they have copied with the contents. FSNs are agreed with the competent authorities in each member state where the product is sold. These notifications and tracking of acknowledgements can be a time consuming and expensive exercise. They can also diminish our reputation with customers and generally in the marketplace and might lead to customers not renewing contracts and a decrease in product sales.
As we conduct clinical studies designed to generate long-term data on some of our existing products, the data we generate may not be consistent with our existing data and may demonstrate less favorable safety or efficacy. Data we generate may ultimately not be favorable or could even hurt the commercial prospects for our products.
In order to be able to place new devices on the market in the EU, it is likely we would also have to undertake clinical studies in the EU. The EU similarly imposes regulatory requirements on companies when they undertake clinical studies on investigational medical devices. All types of clinical evaluations are required to meet specific standards of scientific rigor, verifying that the study is conducted in accordance with the study plan, that data is reliable and properly handled and interpreted to ensure accuracy and integrity.
65
All applications for clinical investigations must be made through individual member states’ competent authorities pending use of EUDAMED dedicated module for clinical investigations. Once applicable, EUDAMED will allow for a single application to be made for multi-site clinical investigations within the EU. It will also be interoperable with the EU database for clinical trials clinical trials on medicinal products (EU Clinical Trials Register).
Devices for clinical evaluations must comply with the general safety and performance requirements in Annex I MDR, save for the aspects being studied and in respect of which “every precaution” must be taken to protect health and safety. If the safety of participants is ever in question, regulatory authorities can step-in and require a suspension or halt of the clinical evaluation.
Advertising and marketing materials are subject to regulation in individual countries in Europe. Failure to adhere to applicable European regulations could lead to fines or sanctions.
Advertising and marketing materials are subject to regulation in individual countries in Europe, with off-label uses being prohibited in every country, and in some countries, no consumer-facing and promotion of medical devices is permitted for any for prescription-only devices or in some cases devices which are subject to government reimbursement. Within the EU, the requirements are enormously varied as between countries, which can be challenging because reviews need to be undertaken country by country, in particular in relation to any advertising that is likely to be seen by the general public. Failure to adhere to local regulations on the advertising and promotion of medical devices can lead to fines and other sanctions, as well as third-party damages claims for unfair competition in many countries in continental Europe.
Our products are subject to requirements related to pricing and reimbursement in individual European countries.
Our products are subject to requirements of pricing and reimbursement in individual European countries. If we fail to agree a price or the right to receive reimbursement from the government or national insurance agencies, then we will not be permitted to sell our devices to government hospitals in the particular country. Separately, we must gain traction with KOLs in each country so that they accept and prescribe our products for their patients.
As a result of Brexit, we are subject to differing regulatory requirements in the UK compared to the EU regulatory system, which increases our financial cost of European regulatory compliance and may lead to reduced revenue in the UK.
The Medicines and Healthcare Products Regulatory Agency (MHRA) is the regulatory authority for medical devices in the UK, however, the EU regulatory regime no longer applies in Great Britain (England, Wales and Scotland), but only in Northern Ireland. Manufacturers based outside the UK must appoint a UK Responsible Person and register devices with the MHRA before placing them on the Great Britain market.
Devices with valid MDD certificates may continue on the Great Britain market until the sooner of certificate expiration or June 30, 2028, and devices with valid MDR certificates until the sooner of certificate expiration or June 30, 2030. The MHRA has consulted on reforms to its pre-market framework and, in its published consultation response (July 22, 2025), confirmed measures including recognition of certain CE-certified devices, replacement of the physical UKCA mark with UDI registration obligations, and other changes to be implemented through UK secondary legislation.
To the extent we market or intend to market in Great Britain, having products separately regulated from the EU increases compliance costs and may divert management resources. Failure to comply with the evolving UK regulatory requirements, including MHRA registration and any future obligations which are additional to those already undertaken for CE marked devices, could result in delays or an inability to place our products on the Great Britain market.
We are subject to governmental regulation and other legal obligations, particularly related to privacy, data protection and information security, and we are subject to consumer protection laws that regulate our marketing practices and prohibit unfair or deceptive acts or practices. Our actual or perceived failure to comply with such obligations could harm our business.
In the course of our business, we collect and store data, including legally protected personally identifiable information. We collect this kind of information for various reasons, including potentially during the course
66
of clinical studies and for post-marketing safety vigilance. In doing so, we are subject to diverse laws and regulations relating to data privacy and security, including, in the United States, the California Consumer Privacy Act and its implementing regulations, and, in the European Union, or EU, and the European Economic Area, or EEA, Regulation 2016/679, known as the General Data Protection Regulation, or GDPR. New privacy rules are being enacted in the United States and globally, and existing ones are being updated and strengthened. Complying with these numerous, complex and often changing regulations is expensive and difficult, and failure to comply with any privacy laws or data security laws or any security incident or breach involving the misappropriation, loss or other unauthorized use or disclosure of sensitive or confidential patient or consumer information, whether by us, one of our business associates or another third-party, could adversely affect our business, results of operations and financial condition, including but not limited to: investigation costs, material fines and penalties; compensatory, special, punitive, and statutory damages; litigation; reputational damage; consent orders regarding our privacy and security practices; requirements that we provide notices, credit monitoring services and/or credit restoration services or other relevant services to impacted individuals; adverse actions against our licenses to do business; and injunctive relief. Furthermore, these rules are constantly changing. For example, the California Consumer Privacy Act, or CCPA, took effect on January 1, 2020. The CCPA establishes a new privacy framework for covered businesses and provides new and enhanced data privacy rights to California residents, such as affording consumers the right to access and delete their information and to opt out of certain sharing and sales of personal information. The CCPA imposes severe statutory damages as well as a private right of action for certain data breaches that result in the loss of personal information. The CCPA contains an exemption for medical information governed by the California Confidentiality of Medical Information Act, or CMIA, and for PHI collected by a covered entity or business associate governed by the privacy, security and breach notification rules established pursuant to HIPAA, but the precise application and scope of this exemption is not yet clear, and the law may still apply to certain aspects of our business. In addition, the California Privacy Rights Act of 2020, or CPRA, which went into effect on January 1, 2023, imposes additional obligations on companies covered by the legislation and significantly modifies the CCPA, including by expanding consumers’ rights with respect to certain sensitive personal information. The CPRA also creates a new state agency that is vested with authority to implement and enforce the CCPA and CPRA. Following California’s lead, similar laws have been passed in numerous other states, including Virginia, Colorado, Connecticut, and other states have proposed such laws. The effects of the CCPA, CPRA, and other similar state or federal laws, are potentially significant and may require us to modify our data processing practices and policies and to incur substantial costs and potential liability in an effort to comply with such legislation.
The collection, use, storage, disclosure, transfer, or other processing of any personal data regarding individuals in the European Economic Area (EEA) or in connection with our activities in the EEA, including personal health data, is subject to the EU GDPR, which became effective on May 25, 2018. Equivalent provisions apply in the United Kingdom pursuant to UK GDPR. The GDPR is wide-ranging in scope and imposes numerous requirements on companies that process personal data, including requirements relating to processing health and other sensitive data, in certain circumstances obtaining consent of the individuals to whom the personal data relates, providing information to individuals regarding data processing activities, implementing safeguards to protect the security and confidentiality of personal data, providing notification of data breaches, and taking certain measures when engaging third-party processors. The GDPR also imposes strict rules on the transfer of personal data to countries outside the European Union, including the United States, and permits data protection authorities to impose large penalties for violations of the GDPR, including potential fines of up to €20 million (£17.5 million under UK GDPR) or 4% of annual global revenues, whichever is greater. The GDPR also confers a private right of action on data subjects and consumer associations to lodge complaints with supervisory authorities, seek judicial remedies, and obtain compensation for damages resulting from violations of the GDPR. While we limit the amount of personal data collected about EEA and UK residents, if we do not comply with our obligations under GDPR with respect to any personal data we do collect, we could be exposed to significant fines, or subject to litigation and/or adverse publicity, which could adversely affect our business results, results of operations, and financial condition.
Among other requirements, the GDPR regulates transfers of personal data subject to the GDPR to third countries that have not been found to provide adequate protection to such personal data, including the United States, and the efficacy and longevity of current transfer mechanisms between the EEA, and the United States remains uncertain. Case law from the Court of Justice of the European Union (“CJEU”) states that reliance on the standard contractual clauses—a standard form of contract approved by the European Commission as
67
an adequate personal data transfer mechanism—alone may not necessarily be sufficient in all circumstances and that transfers must be assessed on a case-by-case basis. On July 10, 2023, the European Commission adopted its Adequacy Decision in relation to the new EU-US Data Privacy Framework (“DPF”), rendering the DPF effective as a GDPR transfer mechanism to U.S. entities self-certified under the DPF. Because of regulatory challenges in the EU to the validity of the DPF, we choose to rely on standard contractual clauses for most transfers of personal data to which GDPR applies.
In relation to such cross border transfers of personal data, we expect the existing legal complexity and uncertainty regarding international personal data transfers to continue, and international transfers to the United States, China, and to other jurisdictions more generally to continue to be subject to enhanced scrutiny by regulators. As the regulatory guidance and enforcement landscape in relation to data transfers continue to develop, we could suffer additional costs, complaints and/or regulatory investigations or fines; we may have to stop using certain tools and vendors and make other operational changes; we may have to implement alternative data transfer mechanisms under the GDPR and/ or take additional compliance and operational measures; and/or it could otherwise affect the manner in which we operate our business, and could adversely affect our business, operations and financial condition.
As we expand into other foreign countries and jurisdictions, we will become subject to additional laws and regulations that will affect how we conduct business, and we expect the existing legal complexity and uncertainty regarding international personal data transfers to continue. Our operations could suffer additional costs, complaints, and regulatory investigations or fines, and/or if we are otherwise unable to transfer personal data between and among countries and regions in which we operate, it could affect the manner in which we provide our services, the geographical location or segregation of our relevant systems and operations, and could adversely affect our financial results. Compliance with applicable privacy and data security laws and regulations is a rigorous and time-intensive process, and we may be required to put in place additional mechanisms ensuring compliance with new data protection rules. Failure or perceived failure to comply with any such laws or regulations puts us at risk of facing significant fines and penalties that could adversely affect our business, financial condition, reputation, and results of our operations. Furthermore, conflicting requirements across applicable privacy and data security laws would complicate our compliance efforts and increase both legal risk and compliance costs for us and the third parties upon whom we rely.
Although we work to comply with applicable laws, regulations and standards, our contractual obligations, research protocols, and other obligations, any actual or perceived failure by us or our employees, representatives, contractors, consultants, or other third parties to comply with such requirements or adequately address data privacy and security concerns, even if unfounded, could result in, among other adverse impacts, damage to our reputation, loss of customer confidence in our security measures, withdrawal or withholding of customer consent for using patient data, government investigations, and enforcement actions and litigation and claims by third parties, any of which could have a material adverse effect on our business, financial condition, results of operations, and prospects.
Failure to comply with the FCPA and other anti-bribery, anti-corruption, export control, import, and sanctions laws associated with our activities outside the United States could adversely affect our business, results of operations and financial condition.
We are subject to the FCPA and other anti-bribery and anti-corruption legislation in the countries in which we operate, some of which, including the UK Bribery Act 2010 are similarly extra-territorial. The FCPA generally prohibits covered entities and their intermediaries from engaging in bribery or making other prohibited payments, offers or promises to foreign officials for the purpose of obtaining or retaining business or other advantages. In addition, the FCPA imposes recordkeeping and internal controls requirements on publicly traded corporations and their foreign affiliates, which are intended to, among other things, prevent the diversion of corporate funds to the payment of bribes and other improper payments, and to prevent the establishment of “off books” slush funds from which such improper payments can be made. As we conduct our business in jurisdictions outside of the United States, we face significant risks if we fail to comply with the FCPA and other laws that prohibit improper payments, offers or promises of payment to foreign governments and their officials and political parties by us and other business entities for the purpose of obtaining or retaining business or other advantages. In many foreign countries, particularly in countries with developing economies, it may be a local custom that businesses operating in such countries engage in business practices
68
that are prohibited by the FCPA or other laws and regulations. Although we have implemented a company policy requiring our employees and consultants to comply with the FCPA and similar laws, such policy may not prevent all potential FCPA or other violations. Although our agreements with our international distributors clearly state our expectations for our distributors’ compliance with applicable laws, including the FCPA and other anti-bribery and anti-corruption laws, and provide us with various remedies upon any non-compliance, including the ability to terminate the agreement, we also cannot guarantee our distributors’ compliance with these laws, including the FCPA. Therefore, there can be no assurance that our employees and agents, or those companies to which we outsource certain of our business operations, have not and will not take actions that violate our policies or applicable laws, for which we may be ultimately held responsible. Any violation of the FCPA or other anti-bribery and anti-corruption laws could result in substantial penalties, including fines, enforcement actions, civil and/or criminal sanctions, which could adversely affect our business, results of operations and financial condition.
Most European countries and/ or government hospitals and clinics have laws/ rules limiting interactions between the medical device industry and HCPs, HCOs and patient organizations. In some countries our interactions with these persons are also subject to prior authorization or notification requirements and/ or to requirements to publish information detailing these interactions together with the value of support or payments provided. Failure to meet these requirements can lead to criminal and civil sanctions being imposed as well as potential exclusion from EU tendering opportunities.
Furthermore, we are subject to U.S. and foreign export controls, trade sanctions and economic embargoes, and import laws and regulations, including, but not limited to, the U.S. Export Administration Regulations administered by the Department of Commerce, and U.S. trade sanctions administered by the Office of Foreign Assets Control within the Department of the Treasury. Governmental regulation of the import or export of our products, or our failure to obtain any required import or export authorization for our products, when applicable, could harm our international or domestic sales and adversely affect our revenue. Compliance with applicable regulatory requirements regarding the export of our products may create delays in the introduction of our products in international markets or, in some cases, prevent the export of our products to some countries altogether. Furthermore, U.S. export control laws and economic sanctions limit our ability to market, sell, distribute or otherwise transfer our products or technology to prohibited countries or persons. A determination that we have failed to comply, whether knowingly or inadvertently, may result in substantial penalties, including fines, enforcement actions, civil and/or criminal sanctions, the disgorgement of profits, the imposition of a court-appointed monitor, as well as the denial of export privileges, and may adversely affect our business, results of operations and financial condition.
Risks Related to Intellectual Property Matters
Protection of our intellectual property rights may be difficult and costly, and our inability to protect our intellectual property could adversely affect our competitive position.
Our overall success depends, in part, on our ability to protect our proprietary rights to the technologies and inventions used in, or embodied by, our products, as well as our ability to operate without infringing, misappropriating, or otherwise violating the proprietary rights of others. To protect our proprietary technologies and products, we may rely on a combination of patent, copyright, trade secret and trademark protections, as well as nondisclosure, confidentiality and other contractual restrictions in our consulting and employment agreements and similar agreements. These legal means afford only limited protection, however, and may not adequately protect our rights or permit us to gain or keep any competitive advantage. Our success depends in part on our ability to obtain, maintain, expand, enforce, and defend the scope, ownership or control, validity and enforceability of our intellectual property rights in the United States and other countries with respect to our products and proprietary technologies. We generally seek, and may in the future seek, to protect our proprietary position, in part, by filing patent applications in the United States and abroad relating to our products and technologies. We may also seek to protect our proprietary position in the future by acquiring or in-licensing relevant issued patents or pending patent applications from third parties. If we are unable to obtain, maintain, expand, enforce and defend the scope, ownership or control, validity and enforceability of our intellectual property rights, our business, financial condition, results of operations and prospects could be materially harmed. Our existing or future confidentiality and/or invention assignment agreements with employees, contractors, and others who participate in IP development activities could be
69
breached, or we may not enter into sufficient and adequate agreements with those individuals in the first instance, and we may not have adequate remedies for such breaches. Furthermore, we may be subject to, and forced to defend against, third-party claims of ownership to our intellectual property. If we fail in defending any such claims, in addition to paying monetary damages, we may lose valuable intellectual property rights, such as exclusive ownership of, or rights to use, valuable intellectual property. Such an outcome could adversely affect our business, results of operations and financial condition. Even if we are successful in defending against such claims, litigation could result in substantial costs and be a distraction to management and other employees.
The process of applying for patent protection is complex, time-consuming and expensive and we cannot assure you that all of our patent applications will issue as patents or that, if issued, they will issue in a form that will be advantageous to us. The rights granted to us under our patents, including prospective rights sought in our pending patent applications, may not be meaningful or provide us with any commercial advantage, and they could be opposed, contested, narrowed, or circumvented by our competitors or declared invalid or unenforceable in judicial or administrative proceedings. We may not be able to file, prosecute, maintain, and enforce all necessary or desirable patent applications or maintain and enforce patents that may issue based on our patent applications at a reasonable cost or in a timely manner. It is also possible that we will fail to identify patentable aspects of our research and development output before it is too late to obtain patent protection. As a result, some of our products may not currently be, and in the future may not be, protected by patents. We generally apply for patents in those countries where we intend to make, have made, use, offer for sale, or sell products and where we assess the risk of infringement to justify the cost of seeking patent protection. However, we do not seek protection in all countries where we sell products and we may not accurately predict all the countries where patent protection would ultimately be desirable. If we fail to timely file a patent application in any such country or major market, we may be precluded from doing so at a later date. Competitors may use our technologies and innovations in jurisdictions where we have not obtained patent protection to develop their own products and, further, may export otherwise infringing products to territories in which we have patent protection but where such protection may not be sufficient to enjoin infringing activities.
We own numerous issued patents and pending patent applications relating to our technologies and products. The rights granted to us under these patents, including prospective rights sought in our pending patent applications, could be opposed, contested or circumvented by our competitors or declared invalid or unenforceable in judicial or administrative proceedings. If any of our patents are challenged, invalidated or legally circumvented by third parties, and if we do not own other enforceable patents protecting our products, competitors could market products and use processes that are substantially similar to, or superior to, those of ours, and our business will suffer. In addition, the patents we own may not be of sufficient scope or strength to provide us with any meaningful protection or commercial advantage, and competitors may be able to design around our patents or develop products that provide outcomes comparable to those of ours without infringing on our intellectual property rights.
Even if our patents are determined by the U.S. Patent and Trademark Office, or USPTO, foreign patent office, or a court to be valid and enforceable, they may not be drafted or interpreted sufficiently broadly to prevent others from marketing products and services similar to ours or designing around our patents. For example, third parties may be able to develop products that are similar to ours but that are not covered by the claims of our patents. Third parties may assert that we were not the first to make the inventions covered by our issued patents or pending patent applications. The claims of our issued patents or patent applications when issued may not cover our commercial technologies or the future products and services that we develop. We may not have freedom to operate unimpeded by the patent rights of others. Third parties may have dominating, blocking or other patents relevant to our technologies of which we are not aware. In addition, because patent applications in the United States and many foreign jurisdictions are typically not published until 18 months after the filing of certain priority documents (or, in some cases, are not published until they issue as patents) and because publications in the scientific literature often lag behind actual discoveries, we cannot be certain that others have not filed patent applications for our technologies or our contemplated technology. Any such patent applications may have priority over our patent applications or issued patents, which could require us to obtain rights from third parties to issued patents or pending patent applications covering such technologies to allow us to commercialize our technologies. If another party has filed a U.S. patent application on inventions similar to ours, depending on when the timing of the filing date falls under certain patent laws, we may have to participate in a priority contest (such as an interference proceeding) declared by the USPTO to determine
70
priority of invention in the United States. There may be prior public disclosures of which we are not aware that could invalidate our patents or a portion of the claims of our patents. Further, we may not develop additional proprietary technologies and, even if we do, they may not be patentable.
We may rely on our trademarks as one means to distinguish our products from the products of our competitors, and have registered or applied to register certain of these trademarks. However, we may not be able to successfully secure trademark registrations for all such applications. Third parties may oppose our trademark applications, or otherwise challenge our use of both registered and unregistered trademarks. In the event that our trademarks are successfully challenged, we could be forced to rebrand our products, which could result in loss of brand recognition and could require us to devote resources to advertising and marketing new brands. Our competitors may infringe our trademarks and we may not have adequate resources to enforce our trademarks. Over the long term, if we are unable to establish name recognition based on our trademarks, then we may not be able to compete effectively and our business, results of operations and financial condition may be adversely affected.
We may not be able to prevent the unauthorized disclosure or use of our technical knowledge or other trade secrets by consultants, vendors, former employees or current employees, despite the existence generally of confidentiality agreements and other contractual restrictions. Monitoring unauthorized uses and disclosures of our intellectual property is difficult, and we do not know whether the steps we have taken to protect our intellectual property will be effective.
We have not secured copyright registrations for our works of authorship such as our websites, marketing materials, and training materials, and registration would be necessary if we would elect to bring a lawsuit for copyright infringement in the United States. Moreover, certain statutory damages may be unavailable based upon the date of the third party infringement because any application for registration may not be filed before any potential copyright infringement.
Changes in patent laws or their interpretation could diminish the value of patents in general, thereby imposing our ability to protect our products.
Changes in either the patent laws or interpretation of the patent laws in the United States or in other lead to additional uncertainties and increased costs surrounding the prosecution of our patent applications or enforcement and defense of our issued patents. Assuming that other requirements for patentability are met, prior to March 2013, in the United States, the first to invent the claimed invention was entitled to the patent, while outside the United States, the first to file a patent application was entitled to the patent. After March 2013, under the Leahy-Smith America Invents Act (the America Invents Act) enacted in September 2011, the United States transitioned to a first inventor to file system in which, assuming that other requirements for patentability are met, the first inventor to file a patent application will be entitled to the patent on an invention regardless of whether a third party was the first to invent the claimed invention. A third party that files a patent application in the USPTO after March 2013, but before us or our future licensors could therefore be awarded a patent covering an invention of ours or our future licensors even if we or our future licensors had made the invention before it was made by such third party. This requires us to be cognizant of the time from invention to filing of a patent application. Since patent applications in the United States and most other countries are confidential for a period of time after filing or until issuance, we cannot be certain that we or our future licensors are the first to either (i) file any patent application related to our products and other proprietary technologies we may develop or (ii) invent any of the inventions claimed in our patents or patent applications.
The America Invents Act also included a number of significant changes that affect the way patent applications filed after March 2013 are prosecuted and also affect patent litigation. These include allowing third party protests and submission of prior art to the USPTO during patent prosecution and creating additional procedures to attack the validity of a patent by USPTO-administered post-grant proceedings, including post-grant review, inter partes review and derivation proceedings. Because of a lower evidentiary standard in USPTO proceedings compared to the evidentiary standard in U.S. federal courts necessary to invalidate a patent claim, a third party could potentially provide evidence in a USPTO proceeding sufficient for the USPTO to hold a claim invalid even though the same evidence would be insufficient to invalidate the claim if first presented in a district court action. Accordingly, a third party may attempt to use the USPTO procedures to invalidate our owned patent claims or any patent claims we may license in the future that would not have been
71
invalidated if first challenged by the third party as a defendant in a district court action. An adverse determination in any such submission, proceeding or litigation could reduce the scope of, or invalidate, our patent rights, allow third- parties to commercialize our technologies or products and compete directly with us, without payment to us, or result in our inability to manufacture or commercialize products without infringing third-party patent rights.
In addition, depending on future actions by the U.S. Congress, the federal courts and the USPTO, the laws and regulations governing patents could change in unpredictable ways that could have a material adverse effect on our existing patent portfolio and our ability to protect and enforce our intellectual property in the future. Similarly, changes in patent law and regulations in other countries or jurisdictions or changes in the governmental bodies that enforce them or changes in how the relevant governmental authority enforces patent laws or regulations may weaken our ability to obtain new patents or to enforce patents that we have or may obtain or license in the future.
For example, on June 1, 2023, the European Union Patent Package (EU Patent Package) regulations were implemented with the goal of providing a single pan-European Unitary Patent and a new European Unified Patent Court (UPC) for litigation involving European patents. As a result, all European patents, including those issued prior to ratification of the EU Patent Package, now by default automatically fall under the jurisdiction of the UPC, unless otherwise opted out. It is uncertain how the UPC will impact granted European patents in the medical device industries. Our current and future European patent applications, if issued, could be challenged in the UPC. During the first seven years of the UPC’s existence, the UPC legislation allows a patent owner to opt its European patents out of the jurisdiction of the UPC. We may decide to opt out our future European patents from the UPC, but doing so may preclude us from realizing the benefits of the UPC. Moreover, if we do not meet all of the formalities and requirements for opt-out under the UPC, our future European patents could remain under the jurisdiction of the UPC. The UPC will provide our competitors with a new forum to centrally revoke our European patents, and allow for the possibility of a competitor to obtain pan-European injunction. Such a loss of patent protection could have a material adverse impact on our business and our ability to commercialize our technologies and our products due to increased competition and, resultantly, on our business, financial condition, results of operations and prospects. The UPC and Unitary Patent are significant changes in European patent practice. As the UPC is a new court system, there is no precedent for the court, increasing the uncertainty of any litigation in the UPC.
Obtaining and maintaining our patent protection depends on compliance with various procedural, document submission, fee payment, and other requirements imposed by government patent agencies, and our patent protection could be reduced or eliminated for non-compliance with these requirements.
The USPTO and various foreign governmental patent agencies require compliance with a number of procedural, documentary, fee payment and other similar provisions during the patent application process. In addition, periodic maintenance fees, renewal fees, annuity fees, and various other government fees on patents and patent applications often must be paid to the USPTO and various foreign patent agencies over the lifetime of the patent and patent applications. While an unintentional lapse can in many cases be cured by payment of a late fee or by other means in accordance with the applicable rules, there are situations in which noncompliance can result in abandonment or lapse of the patent or patent application, resulting in partial or complete loss of patent rights in the relevant jurisdiction. Non-compliance events that could result in abandonment or lapse of a patent or patent application include, but are not limited to, failure to respond to official actions within prescribed time limits, non-payment of fees and failure to properly legalize and submit formal documents. If we fail to maintain the patents and patent applications covering our products or technologies, we may not be able to stop a competitor from marketing products that are the same as or similar to our products, which would adversely affect our business, results of operations and financial condition.
Further, the USPTO and various foreign government agencies require compliance with certain foreign filing requirements during the patent application process. For example, in some countries, including the United States, China and some European countries, a foreign filing license is required before certain patent applications are filed. The foreign filing license requirements vary by country and depend on various factors, including where the inventive activity occurred, citizenship status of the inventors, the residency of the inventors and the invention owner, the place of business for the invention owner and the nature of the subject matter to be disclosed (e.g., items related to national security or national defense). In some, but not all cases,
72
for example in China, a foreign filing license cannot be obtained retroactively in accordance with the applicable rules. There are situations, however, in which non-compliance can result in abandonment of a pending patent application or can be grounds for revoking or invalidating an issued patent, resulting in the loss of patent rights in the relevant jurisdiction. In such an event, potential competitors might be able to enter the relevant markets with similar or identical products or technologies, which could have a material adverse effect on our business, financial condition, results of operations and prospects. We may also in the future be dependent on our licensors to take the necessary actions to comply with these requirements with respect to our future licensed intellectual property.
We may not be able to protect our intellectual property and proprietary rights throughout the world.
Filing, prosecuting and defending patents on our products in all countries throughout the world would be prohibitively expensive. Prosecution of foreign patent applications is often a longer process and patents may grant at a later date, and with a shorter term, than in the United States. The requirements for patentability may differ in certain jurisdictions and countries, particularly developing countries, and the breadth of patent claims allowed can be inconsistent. In addition, the laws of some foreign countries may not protect our intellectual property rights to the same extent as laws in the United States, or from selling or importing products made using our intellectual property in and into the United States or other jurisdictions. Consequently, we may not be able to prevent third parties from practicing our inventions in all countries outside the United States. Competitors may use our technologies in jurisdictions where we have not obtained patent protection to develop their own products and, further, may export otherwise infringing products to territories in which we have patent protection that may not be sufficient to terminate infringing activities. These products may compete with our products, and our current or future owned or licensed patents or other intellectual property rights may not be effective or sufficient to prevent them from competing.
Due to differences between foreign and U.S. patent laws, our patented intellectual property rights may not receive the same degree of protection in every jurisdiction in which we obtain patents. The legal systems of certain countries, particularly certain developing countries, do not favor the enforcement of patents, trade secrets and other intellectual property protection, particularly those relating to medical device products, which could make it difficult for us to stop the infringement of our owned patents or any patents we may license in the future or marketing of competing products in violation of our intellectual property and proprietary rights generally. In addition, some jurisdictions, such as Europe, Japan and China, may have a heightened standard for patentability than in the United States, including, for example, the requirement of claims having literal support in the original patent filing and the limitation on using supporting data that is not in the original patent filing. Under those heightened patentability requirements, we may not be able to obtain sufficient patent protection in certain jurisdictions even though the same or similar patent protection can be secured in the United States and other jurisdictions. Furthermore, we do not have patent rights in certain foreign countries in which a market may exist in the future. We may need to expend additional resources to protect or defend our intellectual property rights in these countries, and the inability to protect or defend the same could impair our brand or adversely affect the growth of our business internationally. For example, we may not be able to stop a competitor from marketing and selling in foreign countries products that are the same as or similar to our products.
Proceedings to enforce our intellectual property and proprietary rights in the United States or other jurisdictions could result in substantial costs and divert our efforts and attention from other aspects of our business, could put our owned and any patents we may license in the future at risk of being invalidated or interpreted narrowly, could put our patent applications and any patent applications we may license in the future at risk of not issuing, and could provoke third parties to assert claims against us. We may not prevail in any lawsuits that we initiate, and the damages or other remedies awarded, if any, may not be commercially meaningful. Accordingly, our efforts to enforce our intellectual property and proprietary rights around the world may be inadequate to obtain a significant commercial advantage from the intellectual property that we develop.
Many countries have compulsory licensing laws under which a patent owner may be compelled to grant licenses to third parties, including governmental agencies. In addition, many countries limit the enforceability of patents against government agencies or government contractors. In these countries, the patent owner may have limited remedies, which could materially diminish the value of such patent. If we are forced to grant a
73
license to third parties with respect to any patents relevant to our business, our competitive position may be impaired, and our business, financial condition, results of operations and prospects may be adversely affected.
Patent terms may be inadequate to protect the competitive position of our products for an adequate amount of time.
Patents have a limited lifespan, and the protection patents affords is limited. In the United States, if all maintenance fees are timely paid, the natural expiration of a patent is generally 20 years from its earliest U.S. non-provisional or international patent application filing date. The actual protection afforded by a patent varies from country to country, and depends on many factors, including the type of patent, the scope of its coverage, the availability of regulatory-related extensions, the availability of legal remedies in a particular country and the validity and enforceability of the patent. Although various extensions may be available, the term of a patent, and the protection it affords, is limited. We may also be required to disclaim a portion of a patent term in order to overcome double patenting rejections from the patent office, thus potentially shortening our exclusivity period. Even if patents covering our products are obtained, once the patent life has expired for patents covering a product, we may be vulnerable to competition from competitive products and services. In addition, although upon issuance in the United States a patent’s term can be extended based on certain delays caused by the USPTO, this extension can be reduced or eliminated based on certain delays caused by the patent applicant during patent prosecution. A patent term extension based on regulatory delay may be available in the United States for medical devices. However, only a single patent can be extended for each marketing approval, and any patent can be extended only once for a single product. Moreover, the scope of protection during the period of the patent term extension does not extend to the full scope of the claim, but instead only to the scope of the product as approved. Laws governing analogous patent term extensions in foreign jurisdictions vary widely, as do laws governing the ability to obtain multiple patents from a single patent family. Additionally, we may not receive an extension if we fail to exercise due diligence during the testing phase or regulatory review process, apply within applicable deadlines, fail to apply prior to expiration of relevant patents or otherwise fail to satisfy applicable requirements. Given the amount of time required for the development, testing and regulatory review of our products, the remaining patent term of our regulatory-approved products may be limited. As a result, our patent portfolio may not provide us with sufficient rights to exclude others from commercializing products similar or identical to ours. Certain of our patents that cover our commercial motion preservation products are expected to expire in the next couple of years. Accordingly, as and when these different patents expire, our commercial motion preservation products could become subject to increased competition. If we do not have sufficient patent life to protect our products, our business, financial condition, results of operations and prospects will be adversely affected.
We may need to obtain licenses from third parties to advance our research or allow commercialization of our products and technologies.
We may need to obtain licenses from third parties to advance our research or allow commercialization of our products and technologies. We may fail to obtain any of these licenses on commercially reasonable terms, if at all. Even if we are able to obtain a license, it may be non-exclusive, thereby giving our competitors access to the same technologies licensed to us. In the event that we are not able to acquire a license, we may be required to expend significant time and resources to develop or license replacement technology, which may entail additional costs and commercialization delays. If we are unable to do so, we may be unable to develop or commercialize the affected products and technologies, which could materially harm our business. In addition, the third parties owning such intellectual property rights could seek either an injunction prohibiting our sales, or, with respect to our sales, an obligation on our part to pay royalties or other forms of compensation and damages.
The licensing and acquisition of third-party intellectual property rights is a competitive area, and companies that may be more established or have greater resources than we do may also be pursuing strategies to license or acquire third-party intellectual property rights that we may consider necessary or attractive in order to commercialize our products. More established companies may have a competitive advantage over us due to their size, resources, and greater clinical development and commercialization capabilities. In addition, companies that perceive us to be a competitor may be unwilling to assign or license rights to us. There can be no assurance that we will be able to successfully complete these types of negotiations and ultimately acquire the rights to the intellectual property related to the products that we may seek to develop or market. If we are
74
unable to successfully obtain rights to required third-party intellectual property or to maintain the existing intellectual property rights we have, our business, results of operations and financial condition could suffer.
Licensing of intellectual property involves complex legal, business and scientific issues.
Disputes may arise between us and our future licensors regarding intellectual property that is subject to a license agreement, including:
•
the scope of rights granted under the license agreement and other interpretation-related issues;
•
whether and the extent to which our technologies and products infringe on intellectual property of the licensor that is not subject to the license agreement;
•
our right to sublicense patent and other rights to third parties under future license arrangements or collaborative development relationships;
•
our diligence obligations with respect to the use of the licensed technology in relation to our development and commercialization of our products and technologies, and what activities satisfy those diligence obligations; and
•
the ownership of inventions and know-how resulting from the joint creation or use of intellectual property by our licensors and us and our partners.
If disputes over intellectual property that we may license prevent or impair our ability to maintain our future licensing arrangements on acceptable terms, we may be unable to successfully develop and commercialize such affected products and technologies.
Our intellectual property agreements with third parties may be subject to disagreements over contract interpretation, which could narrow the scope of our rights to the relevant intellectual property or technologies.
Certain provisions in our intellectual property agreements may be susceptible to multiple interpretations. Further, any agreements we may enter into in the future under which we license intellectual property or technology from third parties could be complex, and certain provisions in such agreements may be susceptible to multiple interpretations. The resolution of any contract interpretation disagreement that may arise could affect the scope of our rights to the relevant intellectual property or technology, or affect financial or other obligations under the relevant agreement, either of which could adversely affect our business, results of operations and financial condition.
In addition, while it is our policy to require our employees and contractors who may be involved in the conception or development of intellectual property to execute agreements assigning such intellectual property to us, we may be unsuccessful in executing such an agreement with each party who in fact conceives or develops intellectual property that we regard as our own. Our assignment agreements may not be self-executing or may be breached, and we may be forced to bring claims against third parties, or defend claims they may bring against us, to determine the ownership of what we regard as our intellectual property. Such claims could have a material adverse effect on our business, results of operations and financial condition.
We may in the future be a party to patent and other intellectual property litigation and administrative proceedings that could be costly and could interfere with our ability to successfully market our products.
The medical device industry has been characterized by frequent and extensive intellectual property litigation and is highly competitive. Companies in the medical device industry have used intellectual property litigation to gain a competitive advantage. Our commercial success depends in part upon our ability and that of our contract manufacturers and suppliers to manufacture, market, and sell our products, and to use our technologies without infringing, misappropriating or otherwise violating the proprietary rights or intellectual property of third parties. We may in the future become party to, or be threatened with, adversarial proceedings or litigation regarding intellectual property rights with respect to our products and any future products and technologies, whether or not we are actually infringing, misappropriating or otherwise violating the rights of third parties. While we take reasonable steps to ensure that we do not infringe upon, misappropriate, or otherwise violate the intellectual property rights of others, there may be pertinent intellectual property rights of others which we or our suppliers are presently unaware. Our competitors or other patent holders may assert
75
that our products and/or the methods employed in our products are covered by their patents or that we are infringing, misappropriating, or misusing their trademark, copyright, trade secret, and/or other proprietary rights.
Patent litigation is costly to defend and can result in significant damage awards, including treble damages and attorneys’ fees under certain circumstances, and injunctions that could prevent the manufacture and sale of affected products or force us to make significant royalty payments in order to continue selling the affected products. In the event that we become involved in such a dispute, we may incur significant costs and expenses and may need to devote resources to resolving any claims, which would reduce the cash we have available for operations and may be distracting to management and other employees, including those involved in the development of intellectual property. We may not have sufficient funds to enforce or defend our patents in litigation which could have a material adverse effect on our business. A successful claim of patent or other intellectual property infringement against us could have a material adverse effect on our business, results of operations, financial condition and cash flows.
We do not know whether our competitors or potential competitors have applied for, will apply for, or will obtain patents that will prevent, limit or interfere with our ability to make, use, sell, import or export our products. Because patent applications can take many years to issue, third parties may have currently pending patent applications which may later result in issued patents that our products and technologies may infringe, or which such third parties claim are infringed by the use of our products or technologies. Also, because the claims of published patent applications can change between publication and patent grant, there may be published patent applications that may ultimately issue with claims that we infringe. There is no guarantee that patents will not issue in the future from currently pending applications that may be infringed by our technologies or products. In addition, identification of third-party patent rights that may be relevant to our technologies is difficult because patent searching is imperfect due to differences in terminology among patents, incomplete databases, and difficulty in assessing the meaning of patent claims. We cannot guarantee that any of our or future licensors’ patent searches or analyses, including the identification of relevant patents, the scope of patent claims or the expiration of relevant patents, are or will be complete or thorough, nor can we be certain that we or our future licensors have identified or will identify each and every third-party patent and pending patent application in the United States and abroad that is relevant to or necessary for the commercialization of our current and future products in any jurisdiction. Our determination of the expiration date of any patent in the United States or abroad that we consider relevant may be incorrect and it is also possible that patents owned by third parties of which we are aware, but which we do not believe we infringe or that we believe we have valid defenses to any claims of patent infringement, could be found to be infringed by us. Moreover, as the medical device industry expands and more patents are issued in this area, the risk increases that we may be subject to claims of infringement of the patent rights of third parties. We cannot assure you that we will prevail in such actions, or that other actions alleging misappropriation or misuse by us of third-party trade secrets or infringement by us of third-party patents, copyrights, trademarks or other rights or challenging the validity of our patents, copyrights, trademarks or other rights will not be asserted against us. In a patent infringement claim against us, we may assert, as a defense, that we do not infringe the relevant patent claims, that the patent is invalid or both. The strength of our defenses will depend on the patents asserted, the interpretation of these patents, and our ability to invalidate the asserted patents. However, we could be unsuccessful in advancing non-infringement and/or invalidity arguments in our defense. In the United States, issued patents enjoy a presumption of validity, and the party challenging the validity of a patent claim must present clear and convincing evidence of invalidity, which is a high burden of proof. Conversely, the patent owner need only prove infringement by a preponderance of the evidence, which is a lower burden of proof. Competing products may also be sold in other countries in which our patent coverage might not exist or be as strong. If we lose a foreign patent or other intellectual property lawsuit alleging our infringement of a competitor’s patents or other intellectual property, we could be prevented from marketing our products in one or more foreign countries.
Moreover, in recent years, individuals and groups that are non-practicing entities, commonly referred to as “patent trolls,” have purchased patents and other intellectual property assets for the purpose of making claims of infringement in order to extract settlements. From time to time, we may receive threatening letters, notices or “invitations to license,” or may be the subject of claims that our products and business operations infringe or violate the intellectual property rights of others. We cannot guarantee that we will be able to successfully settle or otherwise resolve such infringement claims. If we fail in any such dispute, in addition to being forced
76
to pay damages, we may be temporarily or permanently prohibited from commercializing any of our product candidates that are held to be infringing. We might, if possible, also be forced to redesign products or services so that we no longer infringe the third-party intellectual property rights. Any of these events, even if we were ultimately to prevail, could require us to divert substantial financial and management resources that we would otherwise be able to devote to our business.
We may also initiate litigation against third parties to enforce our patent and proprietary rights or to determine the scope, enforceability or validity of the proprietary rights of others. Our patents have not been tested in litigation. If we initiate litigation to protect our patent rights, we run the risk of provoking perceived infringers to assert counterclaims or file administrative actions against us alleging that we infringe their patents and having our patents and other proprietary rights invalidated, canceled, held unenforceable, in whole or in part, or narrowed, which could undermine our competitive position. Further, if the scope of protection provided by our patents or patent applications or other proprietary rights is threatened or reduced as a result of litigation, it could discourage third parties from entering into collaborations with us that are important to the commercialization of our products. We may elect to enter into license agreements in order to settle patent infringement claims or to resolve disputes before litigation, and any such license agreements may require us to pay royalties and other fees that could be significant.
Even if resolved in our favor, litigation or other legal proceedings relating to intellectual property claims may cause us to incur significant expenses and could distract management and our personnel from their normal responsibilities. In addition, there could be public announcements of the results of hearings, motions or other interim proceedings or developments, and if securities analysts or investors perceive these results to be negative, it could have a substantial adverse effect on the price of our Class A Common Stock. Such litigation or proceedings could substantially increase our operating losses and reduce the resources available for development activities or any future sales, marketing or distribution activities. We may not have sufficient financial or other resources to conduct such litigation or proceedings adequately. Some of our competitors may be able to sustain the costs of such litigation or proceedings more effectively than we can because of their greater financial resources and more mature and developed intellectual property portfolios. Uncertainties resulting from the initiation and continuation of patent litigation or other proceedings could have a material adverse effect on our ability to compete in the marketplace.
In addition, third parties may assert infringement claims against our customers. These claims may require us to initiate or defend protracted and costly litigation on behalf of our customers or indemnify our customers for any costs associated with their own initiation or defense of infringement claims, regardless of the merits of these claims. If any of these claims succeed or settle, we may be forced to pay damages or settlement payments on behalf of our customers or may be required to obtain licenses for the products they use. If we cannot obtain all necessary licenses on commercially reasonable terms, our customers may be forced to stop using our products.
We may be subject to ownership disputes relating to intellectual property, including disputes arising from conflicting obligations of consultants or others who are involved in developing our products. Furthermore, if we enter into licensing agreements in the future and if a license to necessary technology is terminated, the licensor may initiate litigation claiming that our processes, products or activities infringe or misappropriate its patent or other intellectual property rights and/or that we breached our obligations under such license agreement, and we and our collaborators would need to defend against such proceedings.
These lawsuits and proceedings, regardless of merit, are time-consuming and expensive to initiate, maintain, defend or settle, and could divert the time and attention of managerial and technical personnel, which could materially adversely affect our business, results of operations and financial condition. Any such claim could also force us to do one or more of the following:
•
incur substantial monetary liability for infringement or other violations of intellectual property rights, which we may have to pay if a court decides that the product, service, or technology at issue infringes or violates the third-party’s rights, and if the court finds that the infringement was willful, we could be ordered to pay treble damages and the third-party’s attorneys’ fees;
•
pay substantial damages to our customers or end users to discontinue use or replace infringing technology with non-infringing technology;
77
•
stop manufacturing, offering for sale, selling, using, importing, exporting or licensing the product or technology incorporating the allegedly infringing technology or stop incorporating the allegedly infringing technology into such product, service, or technology;
•
obtain from the owner of the infringed intellectual property right a license, which may require us to pay substantial upfront fees and/or royalties to sell or use the relevant technology and which may not be available on commercially reasonable terms, or at all;
•
redesign our products, services, and technology so they do not infringe or violate the third-party’s intellectual property rights, which may not be possible or may require substantial monetary expenditures and time;
•
enter into cross-licenses with our competitors, which could weaken our overall intellectual property position;
•
lose the opportunity to license our technologies to others or to collect royalty payments based upon successful protection and assertion of our intellectual property against others;
•
find alternative suppliers for non-infringing products and technologies, which could be costly and create significant delay; or
•
relinquish rights associated with one or more of our patent claims, if our claims are held invalid or otherwise unenforceable.
Some of our competitors may be able to sustain the costs of complex intellectual property litigation more effectively than we can because they have substantially greater resources, and many of our competitors, who have made significant investments in competing technologies, may seek, or may already have sought or obtained, patents that will limit, interfere with or eliminate our ability to make, use and sell our products. In addition, intellectual property litigation, regardless of its outcome, may cause negative publicity, adversely impact prospective customers, cause product shipment delays, divert the time, attention and resources of management, or prohibit us from manufacturing, marketing or otherwise commercializing our products and technologies. Any uncertainties resulting from the initiation and continuation of any litigation could adversely affect our ability to raise additional funds or otherwise adversely affect our business, results of operations and financial condition.
Furthermore, because of the substantial amount of discovery required in connection with intellectual property litigation, there is a risk that some of our confidential information could be compromised by disclosure during this type of litigation. In addition, during the course of this kind of litigation, there could be public announcements of the results of hearings, motions or other interim proceedings or developments. If these results are perceived to be negative, the price of our Class A Common Stock could be adversely affected.
In addition, certain of our agreements with suppliers, distributors, customers and other entities with whom we do business may require us to defend or indemnify these parties to the extent they become involved in infringement claims relating to our technologies or products, or rights licensed to them by us. We could also voluntarily agree to defend or indemnify third parties in instances where we are not obligated to do so if we determine it would be important to our business relationships. If we are required or agree to defend or indemnify any of these third parties in connection with any infringement claims, we could incur significant costs and expenses that could adversely affect our business, results of operation and financial condition.
Uncertainties resulting from the initiation and continuation of patent litigation or other proceedings could have a material adverse effect on our business. Any of the foregoing may cause us to incur substantial costs and could place a significant strain on our financial resources, divert the attention of management from our core business, and harm our reputation.
We may be subject to damages resulting from claims that we or our employees, consultants, or advisors have wrongfully used or disclosed alleged trade secrets of our competitors or their current or former employers or are in breach of non-competition or non-solicitation agreements with our competitors or their current or former employers.
We could in the future be subject to claims that we or our employees, consultants, or advisors have inadvertently or otherwise used or disclosed alleged trade secrets or other proprietary information of such
78
individual’s current or former employers or competitors. In addition, we may in the future be subject to claims that we caused an employee to breach the terms of his or her non-competition or non-solicitation agreement. Litigation may be necessary to defend against these claims. Even if we are successful in defending against these claims, litigation could result in substantial costs and could be a distraction to management. If our defense to those claims fails, in addition to paying monetary damages, a court could prohibit us from using technologies or features that are essential to our products, if such technologies or features are found to incorporate or be derived from the trade secrets or other proprietary information of the competitors or such individual’s current or former employers. An inability to incorporate technologies or features that are important or essential to our products could adversely affect our business, results of operations and financial condition, and may prevent us from selling our products. In addition, we may lose valuable intellectual property rights or personnel. Any litigation or the threat thereof may adversely affect our ability to hire employees or contract with independent sales representatives. A loss of key personnel or their work product could hamper or prevent our ability to commercialize our products, which could adversely affect our business, results of operations and financial condition.
In addition, while it is our policy to require our employees, contractors, advisors and other individuals who may be involved in the conception or development of intellectual property to execute agreements assigning such intellectual property to us, we may be unsuccessful in executing such an agreement with each party who, in fact, conceives or develops intellectual property that we regard as our own. The assignment of intellectual property rights may not be self-executing, or the assignment agreements may be breached, and we may be forced to bring claims against third parties, or defend claims that they may bring against us, to determine the ownership of what we regard as our intellectual property. Such claims could have a material adverse effect on our business, results of operations and financial condition.
If we are unable to protect the confidentiality of our trade secrets, our business and competitive position would be harmed.
In addition to seeking patent protection for our products and technologies, we may rely on trade secret protection and confidentiality agreements to protect our unpatented know-how, technologies, and other proprietary information and to maintain our competitive position. We seek to protect these trade secrets and other proprietary technology, in part, by entering into non-disclosure and confidentiality agreements with parties who have access to them, such as our employees, consultants, vendors, advisors and other third parties. We also enter into confidentiality and invention or patent assignment agreements with our employees, contractors and advisors.
Trade secrets and know-how can be difficult to protect. We may not be able to prevent the unauthorized disclosure or use of our technical knowledge or other trade secrets by consultants, vendors, former employees or current employees, despite the existence generally of confidentiality agreements and other contractual restrictions. Monitoring unauthorized uses and disclosures of our intellectual property is difficult, and we do not know whether the steps we have taken to protect our intellectual property will be effective.
Moreover, our competitors may independently develop equivalent knowledge, methods and know-how. For example, the FDA, as part of its Transparency Initiative, is currently considering whether to make additional information publicly available on a routine basis, including information that we may consider to be trade secrets or other proprietary information, and it is not clear at the present time how the FDA’s disclosure policies may change in the future, if at all. Our competitors could use any of the information we may be required to disclose by the FDA to develop independently technology similar to those of ours.
If we were to enforce a claim that a third-party had illegally obtained, misappropriated or was using our trade secrets or know-how, it would be expensive and time consuming, and the outcome would be unpredictable. In addition, courts outside the United States may be less willing to protect trade secrets or know-how. If any of the technologies or information that we protect as trade secrets or know-how were to be independently developed by a competitor, we would have no right to prevent them from using that technology or information to compete with us.
Misappropriation or unauthorized disclosure of our trade secrets or know-how could impair our competitive position and may adversely affect our business, results of operations and financial condition. Additionally, if
79
the steps taken to maintain our trade secrets are deemed inadequate, we may have insufficient recourse against third parties for misappropriating the trade secret or know-how.
If our trademarks and trade names are not adequately protected, then we may not be able to build name recognition in our markets of interest and our business may be adversely affected.
We may rely on our trademarks as one means to distinguish our products from the products of our competitors, and have registered or applied to register certain of these trademarks. However, our registered or unregistered trademarks or trade names may be challenged, infringed, diluted, circumvented or determined to be infringing, misappropriating or violating other marks. We may not be able to protect our rights to these trademarks and trade names, which we need to build name recognition among potential partners or customers in the markets of interest. During trademark registration proceedings, we may receive rejections of our applications by the USPTO or in other foreign jurisdictions. Although we will be given an opportunity to respond to such rejections, we may be unable to overcome them. If our trademarks are successfully challenged or determined to be infringing, misappropriating or violating other marks, we could be forced to rebrand our products, which could result in loss of brand recognition, and could require us to devote resources to advertising and marketing new brands. In addition, in the USPTO and in comparable agencies in many foreign jurisdictions, third parties are given an opportunity to oppose pending trademark applications and to seek to cancel registered trademarks. Opposition or cancellation proceedings may be filed against our trademarks, which may not survive such proceedings. Moreover, any name we may propose to use with our products in the United States must be approved by the FDA, regardless of whether we have registered it, or applied to register it, as a trademark. Similar requirements exist in Europe. The FDA typically conducts a review of proposed product names, including an evaluation of potential for confusion with other product names. If the FDA or an equivalent administrative body in a foreign jurisdiction objects to any of our proposed proprietary product names, we may be required to expend significant additional resources in an effort to identify a suitable substitute name that would qualify under applicable trademark laws, not infringe, misappropriate or otherwise violate the existing rights of third parties and be acceptable to the FDA. Furthermore, in many countries, owning and maintaining a trademark registration may not provide an adequate defense against a subsequent infringement claim asserted by the owner of a senior trademark.
We may not be able to obtain, protect or enforce our rights to these trademarks and trade names, which we need to build name recognition among potential partners or customers in our markets of interest. At times, competitors or other third parties may adopt trade names or trademarks similar to ours, thereby impeding our ability to build brand identity and possibly leading to market confusion. In addition, there could be potential trade name or trademark infringement, misappropriation, dilution or other claims brought by owners of other registered trademarks or trademarks that incorporate variations of our registered or unregistered trademarks or trade names. Over the long term, if we are unable to establish name recognition based on our trademarks and trade names, then we may not be able to compete effectively and our business may be adversely affected. Our efforts to obtain, enforce or protect our proprietary rights related to trademarks, trade names, domain name, or other intellectual property may be ineffective and could result in substantial costs and diversion of resources and could adversely affect our business, financial condition, results of operations and prospects.
We generally apply for trademark registrations in those countries where we intend to sell products and where we assess the risk of infringement to justify the cost of seeking trademark protection. However, we do not seek protection in all countries where we advertise and sell products and we may not accurately predict all the countries where trademark registrations would ultimately be desirable. We also have not secured trademark registrations for each mark used in connection with our products and services. Filing, prosecuting and enforcing trademarks for our products and services in all countries throughout the world would be prohibitively expensive. Consequently, we may not be able to successfully prevent third parties from using our trademarks in all countries.
Intellectual property rights do not necessarily address all potential threats to our business.
Once granted, patents may remain open to invalidity challenges including opposition, interference, re-examination, post-grant review, inter partes review, nullification or derivation action in court or before patent offices or similar proceedings for a given period after allowance or grant, during which time third parties can
80
raise objections against such grant. In the course of such proceedings, which may continue for a protracted period of time, the patent owner may be compelled to limit the scope of the allowed or granted claims thus attacked, or may lose the allowed or granted claims altogether.
In addition, the degree of future protection afforded by our intellectual property rights is uncertain because even granted intellectual property rights have limitations, and may not adequately protect our business, provide a barrier to entry against our competitors or potential competitors or permit us to maintain our competitive advantage. Moreover, if a third-party has intellectual property rights that cover the practice of our technologies, we may not be able to fully exercise or extract value from our intellectual property rights. The following examples are illustrative:
•
others may be able to develop and/or practice technology that is similar to our technologies or aspects of our technologies, but that are not covered by the claims of the patents that we own or control, assuming such patents have issued or do issue;
•
we or any future strategic partners might not have been the first to conceive or reduce to practice the inventions covered by the issued patents or pending patent applications that we own;
•
we or any future strategic partners might not have been the first to file patent applications covering certain of our or their inventions;
•
others may independently develop similar or alternative technologies or duplicate any of our technologies without infringing our intellectual property rights;
•
our pending or future patent applications that we own or may license may not lead to issued patents;
•
issued patents that we own or may license in the future may not provide us with any competitive advantage, or may be held invalid or unenforceable, as a result of legal challenges by our competitors or other third parties;
•
if we enter into licensing agreement with strategic partners in the future, others may have access to the same intellectual property rights licensed to us in the future on a non-exclusive basis;
•
our competitors or other third parties might conduct research and development activities in countries where we do not have patent rights and then use the information learned from such activities to develop competitive products for sale in our major commercial markets;
•
third parties performing manufacturing or testing for us using our products or technologies could use the intellectual property of others without obtaining a proper license;
•
parties may assert an ownership interest in our intellectual property and, if successful, such disputes may preclude us from exercising exclusive rights over that intellectual property;
•
we may not develop or in-license additional proprietary technologies that are patentable;
•
we may fail to identify potential patentable subject matter and/or may fail to file on it;
•
we may not be able to obtain and maintain necessary licenses on commercially reasonable terms, or at all; and
•
the patents of others may adversely affect our business.
Should any of these events occur, they could adversely affect our business, results of operations and financial condition.
Risks Related to Our Organizational Structure
Our principal asset after the completion of this offering will be our direct or indirect interest in Centinel LLC, and, as a result, we will depend on distributions from Centinel LLC to pay our taxes and expenses (including payments under the Tax Receivable Agreement) and pay dividends (if any). Centinel LLC’s ability to make such distributions may be subject to various limitations and restrictions.
Upon the consummation of this offering and the Organizational Transactions, we will be a holding company and will have no material assets other than our ownership of Series A Common Units. As such, we will have
81
no independent means of generating revenue or cash flow, and our ability to pay our taxes and operating expenses or declare and pay dividends in the future, if any, will be dependent upon the financial results and cash flows of Centinel LLC and distributions we receive from Centinel LLC. There can be no assurance Centinel LLC will generate sufficient cash flow to distribute funds to us or that applicable state law and contractual restrictions, including negative covenants in any applicable debt instruments, will permit such distributions. Centinel LLC is currently subject to debt instruments or other agreements that restrict its ability to make distributions to us, which may in turn affect Centinel LLC’s ability to pay distributions to us and thereby adversely affect our cash flows.
Although no assurances can be provided, we anticipate that Centinel LLC will continue to be treated as a partnership for U.S. federal income tax purposes (and not as a “publicly traded partnership” taxable as a corporation for U.S. federal income tax purposes) and, as such, generally will not be subject to any entity-level U.S. federal income tax. Instead, any taxable income of Centinel LLC will be allocated to holders of LLC Units, including us. Accordingly, we will incur income taxes on our allocable share of any net taxable income of Centinel LLC. However, Centinel LLC may, absent an election to the contrary (which we may not make), be subject to material liabilities pursuant to the partnership audit rules enacted pursuant to the Bipartisan Budget Act of 2015 and related guidance if, for example, its calculations of taxable income are incorrect. Pursuant to these rules, Centinel LLC may be liable for underpayments of taxes attributable to the equity interests of the Continuing Equity Owners, or historic equityholders of Centinel LLC from periods before this offering, in which case we may indirectly economically bear a portion of such taxes (including any applicable penalties and interest) even though we did not economically benefit from the income giving rise to such taxes. Further, we will be responsible for the unpaid tax liabilities of the Blocker Companies we acquire as part of the Organizational Transactions, including for the taxable year (or portion thereof) of such entities ending on the date of this offering. To the extent that we need funds and Centinel LLC is restricted from making such distributions under applicable law or regulations, or as a result of covenants in the debt agreements of Centinel LLC, we may not be able to obtain such funds on terms acceptable to us or at all which as a result could have a material adverse effect on our business, financial condition and results of operations.
Under the terms of the Amended and Restated Centinel LLC Agreement, Centinel LLC will be obligated to make tax distributions to holders of LLC Units, including us. In addition to tax expenses, we will also incur expenses related to our operations, including payments under the Tax Receivable Agreement, which we expect will be significant. See “Certain Relationships and Related Party Transactions—Tax Receivable Agreement.” We intend, as its managing member, to cause Centinel LLC to make cash distributions to the holders of LLC Units (including us) in an amount sufficient to (i) fund all or part of their tax obligations in respect of taxable income allocated to them and (ii) cover our operating expenses, including payments under the Tax Receivable Agreement. However, Centinel LLC’s ability to make such distributions may be subject to various limitations and restrictions, such as restrictions on distributions that would either violate any contract or agreement to which Centinel LLC is then a party, including debt agreements, or any applicable law, or that would have the effect of rendering Centinel LLC insolvent.
If we do not have sufficient funds to pay taxes or other liabilities, or to fund our operations (including, if applicable, because of an acceleration of our obligations under the Tax Receivable Agreement), we may have to borrow funds, which could materially and adversely affect our liquidity and financial condition, and subject us to various restrictions imposed by any lenders of such funds. To the extent we are unable to make timely payments under the Tax Receivable Agreement for any reason, such payments generally will be deferred and will accrue interest until paid; provided, however, that nonpayment for a specified period may constitute a material breach of a material obligation under the Tax Receivable Agreement resulting in the acceleration of payments due under the Tax Receivable Agreement. See “Certain Relationships and Related Party Transactions—Tax Receivable Agreement.” In addition, if Centinel LLC does not have sufficient funds to make distributions, our ability to declare and pay cash dividends (if any) will also be restricted or impaired, although we do not anticipate declaring or paying any cash dividends on our Class A Common Stock in the foreseeable future. See “Risk Factors—Risks Related to This Offering and Ownership of Our Class A Common Stock” and “Dividend Policy.”
As a result of (i) potential differences in the amount of net taxable income allocable to us and to the other holders of LLC Units, (ii) the lower tax rate applicable to corporations as opposed to individuals, and (iii) certain tax benefits covered by, and payments under, the Tax Receivable Agreement, tax distributions
82
from Centinel LLC may be in amounts that exceed our tax liabilities. Our board of directors will determine the appropriate uses for any excess cash so accumulated, which may include, among other uses, the payment of obligations under the Tax Receivable Agreement and the payment of other expenses. We will have no obligation to distribute such cash (or other available cash) to our stockholders. No adjustments to the exchange ratio of the LLC Units for shares of Class A Common Stock will be made as a result of any cash dividend or distribution by us or any retention of cash by us. As a result, the holders of Series B Common Units may benefit from value, if any, attributable to such cash balances if they acquire shares of Class A Common Stock in exchange for their Series B Common Units, notwithstanding that such holders may have participated previously as holders of Series B Common Units in distributions that resulted in such excess cash balances to us. To the extent we do not distribute such excess cash as dividends on our Class A Common Stock, we may take other actions with respect to such excess cash (for example, holding such excess cash, or lending or contributing it (or a portion thereof) to Centinel LLC) which may result in shares of our Class A Common Stock increasing in value relative to the value of LLC Units.
Conflicts of interest could arise between certain of our stockholders and the Continuing Equity Owners, which may impede business decisions that could benefit our stockholders.
The Continuing Equity Owners, who will be the only holders of LLC Units other than us upon consummation of this offering, have the right to consent to certain amendments to the Amended and Restated Centinel LLC Agreement, as well as to certain other matters. The Continuing Equity Owners will have significant rights and interests that may not align with those of our stockholders, including the right to receive substantial payments under the Tax Receivable Agreement (together with our Blocker Stockholders), the ability to cause Centinel LLC to make tax distributions that may exceed their actual tax liabilities and the right to exchange Series B Common Units and shares of Class B Common Stock for shares of Class A Common Stock (or cash, at our election), potentially resulting in dilution to our stockholders. In addition, the Continuing Equity Owners, through their ownership of Class B Common Stock, will have significant voting power and influence over our corporate governance and major transactions. The Continuing Equity Owners may exercise these voting rights in a manner that conflicts with the interests of our stockholders. Circumstances may arise in the future when the interests of the Continuing Equity Owners conflict with the interests of our stockholders. As we control Centinel LLC as its managing member, we have certain obligations to the Continuing Equity Owners that may conflict with fiduciary duties our officers and directors owe to our stockholders. These conflicts may result in decisions that are not in the best interests of stockholders.
The Tax Receivable Agreement requires us to make cash payments to the Continuing Equity Owners and the Blocker Stockholders in respect of certain tax benefits to which we may become entitled, and we expect that such payments will be substantial.
In connection with the consummation of this offering, we will enter into a Tax Receivable Agreement with Centinel LLC and the TRA Parties that provides for the payment by us to such Continuing Equity Owners and Blocker Stockholders of 85% of certain tax benefits, if any, that we actually realize, or are deemed to realize (calculated using certain assumptions), as a result of (i) our allocable share of existing tax basis in Centinel LLC’s assets acquired in this offering, (ii) increases in our allocable share of existing tax basis and tax basis adjustments to the tangible and intangible assets of Centinel LLC as a result of sales or exchanges of LLC Units in connection with or after this offering, (iii) our utilization of certain tax attributes (including any existing tax basis) of the Blocker Companies, which Centinel Holdco acquires in connection with this offering, and (iv) certain other tax benefits related to our entering into the Tax Receivable Agreement, including tax benefits attributable to payments under the Tax Receivable Agreement (collectively, “Tax Benefits”). We will be required to make such payments to the Continuing Equity Owners and the Blocker Stockholders even if all of the Continuing Equity Owners were to exchange or redeem their remaining Series B Common Units.
The payment obligations under the Tax Receivable Agreement are an obligation of Centinel Holdco and not of Centinel LLC. We expect that the amount of the cash payments we will be required to make under the Tax Receivable Agreement will be substantial. Any payments made by us to the TRA Parties under the Tax Receivable Agreement will not be available for reinvestment in our business and will generally reduce the amount of overall cash flow that might have otherwise been available to us. To the extent that we are unable to make timely payments under the Tax Receivable Agreement for any reason, the unpaid amounts will be deferred and will accrue interest until paid by us; provided, however, that nonpayment for a specified period
83
may constitute a material breach of a material obligation under the Tax Receivable Agreement resulting in the acceleration of payments due under the Tax Receivable Agreement. See “Certain Relationships and Related Party Transactions—Tax Receivable Agreement.” Payments under the Tax Receivable Agreement are not conditioned upon continued ownership of Centinel LLC by the exchanging TRA Parties. Furthermore, if we experience a change of control (as defined under the Tax Receivable Agreement), which includes certain mergers, asset sales, and other forms of business combinations, we would be obligated to make an immediate payment, and such payment may be significantly in advance of, and may materially exceed, the actual realization, if any, of the future Tax Benefits to which the payment relates. This payment obligation could (i) make us a less attractive target for an acquisition, particularly in the case of an acquirer that cannot use some or all of the Tax Benefits that are the subject of the Tax Receivable Agreement and (ii) result in holders of our Class A Common Stock receiving substantially less consideration in connection with a change of control transaction than they would receive in the absence of such obligation. Accordingly, the TRA Parties’ interests may conflict with those of the holders of our Class A Common Stock.
The actual Tax Benefit and the actual utilization of any Tax Benefits, as well as the amount and timing of any payments under the Tax Receivable Agreement, will vary depending upon a number of factors including: the timing of exchanges; the price of shares of our Class A Common Stock at the time of the exchange; the extent to which such exchanges are taxable; the amount of gain recognized by the parties to the Tax Receivable Agreement; the amount and timing of the taxable income allocated to us or otherwise generated by us in the future; the portion of our payments under the Tax Receivable Agreement constituting imputed interest; and the federal and state tax rates then applicable.
In certain cases, payments under the Tax Receivable Agreement may be accelerated or significantly exceed any actual benefits we realize in respect of the tax attributes subject to the Tax Receivable Agreement.
The Tax Receivable Agreement will generally apply to each of our taxable years, beginning with the first taxable year ending after the consummation of the Organizational Transactions. There is no maximum term for the Tax Receivable Agreement. However, the Tax Receivable Agreement will provide that if (i) we materially breach any of our material obligations under the Tax Receivable Agreement, (ii) certain mergers, asset sales, other forms of business combinations or other changes of control occur after the consummation of this offering, or (iii) we elect an early termination of the Tax Receivable Agreement, then our obligations, or our successor’s obligations, under the Tax Receivable Agreement to make payments will be determined based on certain assumptions, including an assumption that we will have sufficient taxable income to fully utilize all potential future Tax Benefits that are subject to the Tax Receivable Agreement.
As a result of the foregoing, we would be required to make an immediate cash payment equal to the present value of the anticipated future Tax Benefits that are the subject of the Tax Receivable Agreement, based on certain assumptions (including that we (or our successor) would have sufficient taxable income to fully utilize the benefits arising from the increased tax deductions and tax basis and other benefits covered by the Tax Receivable Agreement), which payment may be made significantly in advance of the actual realization, if any, of such future Tax Benefits. Such cash payment could be greater than the specified percentage of any actual benefits we ultimately realize in respect of the Tax Benefits that are subject to the Tax Receivable Agreement. In these situations, our obligations under the Tax Receivable Agreement could have a substantial negative impact on our liquidity and could have the effect of delaying, deferring, or preventing certain mergers, asset sales, other forms of business combinations or other changes of control or negatively impact the value received by owners of our Class A Common Stock in a change of control transaction. For example, should we elect to terminate the Tax Receivable Agreement immediately following this offering, assuming no material changes in the relevant tax laws or tax rates and that we earn sufficient taxable income to realize all tax potential benefits that are subject to the Tax Receivable Agreement, we estimate that the aggregate of termination payments would be approximately $ million based on the assumed initial public offering price of $ per share of our Class A Common Stock, which is the midpoint of the range set forth on the cover page of this prospectus, and assuming SOFR (as defined in the Tax Receivable Agreement) were to be %. There can be no assurance that we will be able to fund or finance our obligations under the Tax Receivable Agreement. We may need to incur debt to finance payments under the Tax Receivable Agreement to the extent our cash resources are insufficient to meet our obligations under the Tax Receivable Agreement as a result of timing discrepancies or otherwise.
84
We will not be reimbursed for any payments made under the Tax Receivable Agreement in the event that any Tax Benefits are disallowed.
Payments under the Tax Receivable Agreement will be based on the tax reporting positions that we determine, and the Internal Revenue Service (“IRS”), or another tax authority, may challenge all or part of the basis adjustments or other Tax Benefits we claim or utilize, as well as other related tax positions we take, and a court could sustain such challenge. If the outcome of any such challenge would reasonably be expected to materially and adversely affect the rights and obligations of the TRA Parties under the Tax Receivable Agreement, then we will not be permitted to settle such challenge without the consent (not to be unreasonably withheld or delayed) of the TRA Parties. The interests of the TRA Parties in any such challenge may differ from or conflict with our interests and your interests, and the TRA Parties may exercise their consent rights relating to any such challenge in a manner adverse to our interests and your interests. We will not be reimbursed for any cash payments previously made to the TRA Parties under the Tax Receivable Agreement in the event that any Tax Benefits initially claimed by us and for which payment has been made to a TRA Party are subsequently challenged by a taxing authority and are ultimately disallowed. Instead, any excess cash payments made by us to a TRA Party will be netted against future cash payments, if any, that we might otherwise be required to make to such TRA Party, under the terms of the Tax Receivable Agreement. However, we might not determine that we have effectively made an excess cash payment to a TRA Party for a number of years following the initial time of such payment. Moreover, the excess cash payments we made previously under the Tax Receivable Agreement could be greater than the amount of future cash payments against which we would otherwise be permitted to net such excess. The applicable U.S. federal income tax rules for determining applicable Tax Benefits we may claim or utilize are complex and factual in nature, and there can be no assurance that the IRS or a court will agree with our tax reporting positions. As a result, payments could be made under the Tax Receivable Agreement significantly in excess of any actual cash tax savings that we realize in respect of the Tax Benefits with respect to a TRA Party that are the subject of the Tax Receivable Agreement.
If Centinel LLC were to be treated as a “publicly traded partnership” taxable as a corporation for U.S. federal or state income tax purposes, we might be subject to significant tax inefficiencies, and we would not be able to recover payments previously made by us under the Tax Receivable Agreement, even if the corresponding Tax Benefits were subsequently determined to have been unavailable due to such status.
We intend to operate Centinel LLC such that it does not become a “publicly traded partnership” taxable as a corporation for U.S. federal income tax purposes. A “publicly traded partnership” is a partnership the interests of which are traded on an established securities market or are readily tradable on a secondary market or the substantial equivalent thereof. An entity that would otherwise be classified as a partnership for U.S. federal income tax purposes (such as Centinel LLC) may nonetheless be treated as, and taxable as, a corporation if it is a “publicly traded partnership” unless 90% or more of such partnership’s gross income consists of certain passive-type qualifying income, such as interest, dividends and real property rents. Under certain circumstances, transfers of LLC Units (including pursuant to the Exchange Agreement) could cause Centinel LLC to be treated as a “publicly traded partnership.” Applicable U.S. Treasury regulations provide for certain safe harbors from treatment as a “publicly traded partnership,” and we intend to operate such that exchanges or other transfers of LLC Units qualify for one or more of such safe harbors. Accordingly, while such position is not free from doubt, Centinel LLC is expected to be operated such that it is not treated as a “publicly traded partnership” taxable as a corporation for U.S. federal income tax purposes and we intend to take the position that Centinel LLC is not so treated as a result of exchanges of its interests pursuant to the Exchange Agreement. If Centinel LLC were to become a “publicly traded partnership” taxable as a corporation for U.S. federal income tax purposes, significant tax inefficiencies might result for us and for Centinel LLC. Centinel LLC would be taxable on its income at the U.S. federal income tax rates applicable to corporations and distributions by Centinel LLC to its members (including us) may be taxable as dividends to such members to the extent of the current or accumulated earnings and profits of Centinel LLC, as determined under U.S. federal income tax principles, if we are unable to file a consolidated U.S. federal income tax return with Centinel LLC. In addition, we may not be able to realize the Tax Benefits covered under the Tax Receivable Agreement, including that we would no longer have the benefit of increases in the tax basis of Centinel LLC’s assets as a result of exchanges of LLC Units, and would not be able to recover any payments previously made by us under the Tax Receivable Agreement related to such tax benefits, even if they were subsequently determined to have been unavailable.
85
We may be subject to withholding obligations in connection with exchanges of Series B Common Units by holders who are non-U.S. persons, which could create administrative burdens and potential liability for us.
Any holder of Series B Common Units who is a non-U.S. person (as defined under the Code) that exchanges its Series B Common Units for shares of Class A Common Stock (or cash, at our election) may be subject to U.S. federal income tax withholding on such exchange. Because the exchange of Series B Common Units for shares of Class A Common Stock is expected to be treated as a taxable sale of a partnership interest, we (or Centinel LLC) may be required to withhold tax on the amount realized by the exchanging non-U.S. holder (despite the fact that it is a “cashless” exchange). If we do not properly withhold on such exchange, we could be held liable for any failure to properly withhold and remit such amounts to the IRS. Compliance with such withholding obligations may create significant administrative burdens for us, including the obligation to determine which exchanging holders are non-U.S. persons and to collect applicable tax certifications, as well as sourcing the cash that will be used to satisfy such withholding obligations. Any failure to withhold the required amounts may subject us to penalties and interest, which could adversely affect our financial condition.
Certain aspects of the Organizational Transactions involve uncertain tax treatment, and the IRS could challenge our tax positions, which could result in adverse tax consequences to us.
The Organizational Transactions involve a series of complex steps, including the recapitalization of Centinel LLC’s equity, the mergers of the Blocker Companies with and into us, and the conversion of certain convertible debt and warrant instruments. Certain of these steps involve areas of tax law that are uncertain or for which there is limited direct authority. Any adverse determination by the IRS or a court with respect to the tax treatment of any step of the Organizational Transactions could result in unexpected tax liabilities for us and could adversely affect the Tax Benefits that are the subject of the Tax Receivable Agreement.
If we were deemed to be an investment company under the Investment Company Act of 1940, as amended (the “1940 Act”), as a result of our ownership of Centinel LLC, applicable restrictions could make it impractical for us to continue our business as contemplated and could have a material adverse effect on our business.
Under Sections 3(a)(1)(A) and (C) of the 1940 Act, a company generally will be deemed to be an “investment company” for purposes of the 1940 Act if it (i) is, or holds itself out as being, engaged primarily, or proposes to engage primarily, in the business of investing, reinvesting or trading in securities, or (ii) is engaged, or proposes to engage, in the business of investing, reinvesting, owning, holding, or trading in securities and it owns or proposes to acquire investment securities having a value exceeding 40% of the value of its total assets (exclusive of U.S. government securities and cash items) on an unconsolidated basis. We do not believe that we are an “investment company,” as such term is defined in either of those sections of the 1940 Act.
We and Centinel LLC intend to conduct our operations so that we will not be deemed an investment company. As the sole managing member of Centinel LLC, we will control and operate Centinel LLC. On that basis, we believe that our interest in Centinel LLC is not an “investment security” as that term is used in the 1940 Act. However, if we were to cease participation in the management of Centinel LLC, or if Centinel LLC itself becomes an investment company, our interest in Centinel LLC could be deemed an “investment security” for purposes of the 1940 Act.
If it were established that we were an unregistered investment company, there would be a risk that we would be subject to monetary penalties and injunctive relief in an action brought by the SEC, that we would be unable to enforce contracts with third parties and that third parties could seek to obtain rescission of transactions undertaken during the period it was established that we were an unregistered investment company. If we were deemed an investment company, restrictions imposed by the 1940 Act, including limitations on our capital structure and our ability to transact with affiliates, could make it impractical for us to continue our business as contemplated and could have a material adverse effect on our business.
Risks Related to This Offering and Ownership of Our Class A Common Stock
There may not be an active trading market for our Class A Common Stock, which may cause shares of our Class A Common Stock to trade at a discount from the initial public offering price and make it difficult to sell the shares of Class A Common Stock you purchase.
Prior to this offering, there has been no public market for our Class A Common Stock. It is possible that after this offering, an active trading market will not develop or, if developed, that any market will not be sustained,
86
which would make it difficult for you to sell your shares of Common Stock at an attractive price or at all. The lack of an active market may impair the value of your shares or your ability to sell your shares at the time you wish to sell them or at a price that you consider reasonable. The initial public offering price per share of Class A Common Stock will be determined by agreement among us and the representatives of the underwriters and may not be indicative of the price at which shares of our Class A Common Stock will trade in the public market, if any, after this offering. The market value of our Class A Common Stock may decrease from the initial public offering price. Furthermore, an inactive market may also impair our ability to raise capital in the future by selling shares of our Class A Common Stock.
We are an “emerging growth company” and a “smaller reporting company,” and we cannot be certain if the reduced reporting requirements applicable to emerging growth companies and smaller reporting companies will make our Class A Common Stock less attractive to investors.
We are an “emerging growth company,” as defined in the JOBS Act. We will remain an “emerging growth company” until the earliest to occur of:
•
the last day of the fiscal year during which our total annual revenue equals or exceeds $1.235 billion (subject to adjustment for inflation);
•
the last day of the fiscal year following the fifth anniversary of this offering;
•
the date on which we have, during the previous three-year period, issued more than $1 billion in non-convertible debt; or
•
the date on which we are deemed to be a “large accelerated filer” under the Exchange Act.
As a result of our “emerging growth company” status, we may take advantage of exemptions from various reporting requirements that would otherwise be applicable to public companies including, but not limited to, reduced disclosure obligations regarding executive compensation in our periodic reports and proxy statements and exemptions from the requirements of holding a nonbinding advisory vote on executive compensation and stockholder approval of any golden parachute payments not previously approved.
We also are a “smaller reporting company,” meaning that the market value of our stock held by non-affiliates plus the proposed aggregate amount of gross proceeds to us as a result of this offering is less than $250.0 million. We may continue to be a smaller reporting company after this offering if either (i) the market value of our stock held by non-affiliates is less than $250.0 million or (ii) our annual revenue is less than $100.0 million during the most recently completed fiscal year and the market value of our stock held by non-affiliates is less than $700.0 million. If we are a smaller reporting company at the time we cease to be an emerging growth company, we may continue to rely on exemptions from certain disclosure requirements that are available to smaller reporting companies. Specifically, as a smaller reporting company we may choose to present only the two most recent fiscal years of audited financial statements in our annual report on Form 10-K and, similar to emerging growth companies, smaller reporting companies have reduced disclosure obligations regarding executive compensation.
Investors may find our Class A Common Stock less attractive because we may rely on these exemptions. If some investors find our Class A Common Stock less attractive as a result, there may be a less active trading market for our Class A Common Stock and the market price of our Class A Common Stock may be adversely affected and more volatile.
We will incur increased costs and become subject to additional regulations and requirements as a result of becoming a public company, which could lower our profits or make it more difficult to run our business.
As a public company, we will incur significant legal, accounting, and other expenses that we have not incurred as a private company, including costs associated with public company reporting requirements. We have also incurred and will continue to incur costs associated with the Sarbanes-Oxley Act and related rules implemented by the SEC and the exchange on which our securities are listed. The expenses generally incurred by public companies for reporting and corporate governance purposes have been increasing. We expect these rules and regulations to increase our legal and financial compliance costs and to make some activities more time-consuming and costly, although we are currently unable to estimate these costs with any degree of certainty. These laws and regulations also could make it more difficult or costly for us to obtain certain types of
87
insurance, including director and officer liability insurance, and we may be forced to accept reduced policy limits and coverage or incur substantially higher costs to obtain the same or similar coverage. These laws and regulations could also make it more difficult for us to attract and retain qualified persons to serve on our board of directors, on our board committees or as our executive officers. Furthermore, if we are unable to satisfy our obligations as a public company, we could be subject to delisting of our Class A Common Stock, fines, sanctions, other regulatory action, and potentially civil litigation.
If we are unable to design, implement, and maintain effective internal control over financial reporting in the future, investors may lose confidence in the accuracy and completeness of our financial reports and the market price of our Class A Common Stock may decline.
As a public company, we will be required to maintain internal control over financial reporting and to report any material weaknesses in such internal controls. In addition, beginning with our second annual report on Form 10-K, we will be required to furnish a report by management on the effectiveness of our internal control over financial reporting, pursuant to the rules and regulations of the SEC regarding compliance with Section 404 of the Sarbanes-Oxley Act. The process of designing, implementing and testing the internal control over financial reporting required to comply with this obligation is time consuming, costly and complicated. While we have not identified material weaknesses in the past, we may identify material weaknesses in our internal control over financial reporting in the future. Any failure to maintain internal control over financial reporting could severely inhibit our ability to accurately report our financial condition, results of operations, or cash flows. Further, if we identify one or more material weaknesses in our internal control over financial reporting, if we are unable to comply with the requirements of Section 404 of the Sarbanes-Oxley Act in a timely manner, or if we or, if required, our auditors, are unable to assert that our internal control over financial reporting is effective, investors may lose confidence in the accuracy and completeness of our financial reports and the market price of our Class A Common Stock could decline, and we could also become subject to investigations by the stock exchange on which our Class A Common Stock is listed, the SEC or other regulatory authorities, which could require additional financial and management resources. Failure to remedy any material weakness in our internal control over financial reporting, or to implement or maintain other effective control systems required of public companies, could also restrict our future access to the capital markets.
We do not intend to pay dividends in the foreseeable future. As a result, your ability to achieve a return on your investment will depend on appreciation in the market price of our Class A Common Stock.
We do not currently intend to pay any cash dividends on our capital stock in the foreseeable future. We currently intend to retain all available funds and any future earnings to fund the development and expansion of our business. Any future determination related to dividend policy will be made at the discretion of our board of directors, subject to applicable laws, and will depend upon, among other factors, our results of operations, prospects, financial condition, contractual restrictions and capital requirements. In addition, our ability to pay cash dividends on our capital stock is limited by the terms of the Loan Agreement and the Credit Agreement, and may be limited by the terms of any future debt or preferred securities we issue or any future credit facilities we enter into. Accordingly, investors must for the foreseeable future rely on sales of their Class A Common Stock after price appreciation, which may never occur, as the only way to realize any future gains on their investments.
The market price of our Class A Common Stock may be volatile, which could result in substantial losses for investors purchasing shares in this offering.
Even if an active trading market develops, the market price of our Class A Common Stock may be highly volatile and could be subject to wide fluctuations. The initial public offering price for our Class A Common Stock will be determined through negotiations with the underwriters. This initial public offering price may differ from the market price of our Class A Common Stock after the offering. As a result, you may not be able to sell your Class A Common Stock at or above the initial public offering price. Some of the factors that may cause the market price of our Class A Common Stock to fluctuate include:
•
delays or setbacks in the ongoing commercialization of our products and procedures;
•
the success of existing or new competitive products or technologies;
88
•
regulatory or legal developments in the United States and other countries that we pursue expansion in;
•
developments or disputes concerning patent applications, issued patents or other proprietary rights;
•
the recruitment or departure of key personnel;
•
the commencement of litigation;
•
actual or anticipated changes in estimates as to financial condition and results of operations;
•
announcement or expectation of additional financing efforts;
•
announcements by us or our competitors of significant business developments, acquisitions, new offerings, licenses, strategic partnerships, joint ventures or capital commitments;
•
the impact of pandemics epidemics, endemics and other public health emergencies on the performance of procedures;
•
the impact of political instability, natural disasters, events of terrorism or war;
•
sales of our Class A Common Stock by us, our insiders or other stockholders, or the anticipation of such sales, including if existing stockholders sell shares into the market when applicable “lock-up” periods end;
•
expiration of market standoff or lock-up agreements;
•
variations between our actual operating results, or those of companies that are perceived to be similar to us, and the expectations of securities analysts, investors and the financial community;
•
any forward-looking financial or operating information we may provide to the public or securities analysts, any changes in this information or our failure to meet expectations based on this information;
•
changes in estimates or recommendations by securities analysts, if any, that cover our stock;
•
various macroeconomic events, including changes in inflation, interest rates and overall economic conditions and uncertainties;
•
changes in the structure of health care payment systems;
•
market conditions in the medical device sector;
•
changes in the anticipated future size and growth rate of our market;
•
the seasonality of our business;
•
an increase in the rate of returns of our products;
•
general economic, industry and market conditions, including economic recessions or slowdowns; and
•
the other factors described in this “Risk Factors” section.
In recent years, the stock market in general, and the market for medical device companies in particular, has experienced significant price and volume fluctuations that have often been unrelated or disproportionate to changes in the operating performance of the companies whose stock is experiencing those price and volume fluctuations. Further, the stock market in general has been highly volatile due to various macroeconomic events. Broad market and industry factors may seriously affect the market price of our Class A Common Stock, regardless of our actual operating performance. These fluctuations may be even more pronounced in the trading market for our stock shortly following this offering. Following periods of such volatility in the market price of a company’s securities, securities class action litigation has often been brought against that company. Because of the potential volatility of our stock price, we may become the target of securities litigation in the future. Securities litigation could result in substantial costs and divert management’s attention and resources from our business.
If our operating and financial performance in any given period does not meet any guidance that we provide to the public, the market price of our Class A Common Stock may decline.
We may, but are not obligated to, provide public guidance on our expected operating and financial results for future periods. Any such guidance will be comprised of forward-looking statements subject to the risks and
89
uncertainties described in this prospectus and in our other public filings and public statements. Our actual results may not always be in line with or exceed any guidance we have provided, especially in times of economic uncertainty. If actual circumstances differ from those in our assumptions, our operating and financial results could fall below our publicly announced guidance or the expectations of investors. If, in the future, our operating or financial results for a particular period do not meet any guidance we provide or the expectations of investment analysts or investors generally, or if we reduce our guidance for future periods, the market price of our Class A Common Stock may decline. Even if we do issue public guidance, there can be no assurance that we will continue to do so in the future.
We will have broad discretion in the use of net proceeds to us from this offering and may not use them effectively.
We will have broad discretion in the application of the net proceeds to us from this offering, including for any of the purposes described in “Use of Proceeds,” and you will not have the opportunity as part of your investment decision to assess whether the net proceeds are being used appropriately. Because of the number and variability of factors that will determine our use of the net proceeds from this offering, their ultimate use may vary substantially from their currently intended use. If we do not use the net proceeds that we receive in this offering effectively, our business, financial condition, results of operations, and prospects could be harmed, and the market price of our Class A Common Stock could decline. Pending their use, we may invest the net proceeds from this offering in short-term, investment-grade, interest-bearing securities such as money market accounts, certificates of deposit, commercial paper, and guaranteed obligations of the U.S. government that may not generate a high yield for our stockholders. These investments may not yield a favorable return to our investors.
Investors in this offering will experience immediate and substantial dilution in the net tangible book value of the shares of Class A Common Stock purchased in this offering.
The initial public offering price of our Class A Common Stock is expected to be substantially higher than the pro forma as adjusted net tangible book value per share of our Class A Common Stock. Therefore, if you purchase shares of our Class A Common Stock in this offering, you will pay a price per share that substantially exceeds our pro forma as adjusted net tangible book value per share after this offering. Based on the assumed initial public offering price of $ per share, the midpoint of the price range set forth on the cover page of this prospectus, you will experience immediate dilution of $ per share, representing the difference between our pro forma as adjusted net tangible book value per share at , 2026 after giving effect to this offering and the initial public offering price. In addition, purchasers of Class A Common Stock in this offering will have contributed 100% of the aggregate price paid by all purchasers of our Class A Common Stock but will own only approximately % of our Class A Common Stock outstanding after this offering and % of total equity outstanding after this offering. Furthermore, if the underwriters exercise their over-allotment option, or outstanding options and warrants (if any) are exercised, you could experience further dilution. For a further description of the dilution that you will experience immediately after this offering, see the section titled “Dilution.”
Additional stock issuances (including in connection with exchanges of Series B Common Units held by our Continuing Equity Owners) could result in significant dilution to our stockholders and cause the trading price of our Class A Common Stock to decline.
We may issue our capital stock or securities convertible into our capital stock from time to time in connection with financing our business operations or growth, to repay debt, or for acquisitions, investments or otherwise (including in connection with exchanges of Series B Common Units held by our Continuing Equity Owners). Additional issuances of our Class A Common Stock or securities convertible into Class A Common Stock will result in dilution to existing holders of our Class A Common Stock. Any such issuances could result in substantial dilution to our existing stockholders and cause the trading price of our Class A Common Stock to decline. In particular, following the issuance of shares of Class A Common Stock in connection with the exchanges of Series B Common Units held by our Continuing Equity Owners and the related cancellation of shares of our Class B Common Stock, such shares of Class A Common Stock will have the same economic rights as other shares of Class A Common Stock.
90
Sales of a substantial number of shares of our Class A Common Stock in the public market could cause our stock price to fall.
Sales of a substantial number of shares of our Class A Common Stock in the public market could occur at any time. These sales, upon the expiration of the market standoff and lock-up agreements, the early release of these agreements or the perception in the market that the holders of a large number of shares of our Class A Common Stock intend to sell shares, could reduce the market price of our Class A Common Stock. After this offering, we expect that we will have shares of our Common Stock outstanding (assuming no exercise of the underwriters’ over-allotment option). Of these shares, shares we are selling in this offering may be resold in the public market immediately, unless purchased by our affiliates. The remaining shares, or approximately of our outstanding shares after this offering, are currently prohibited or otherwise restricted under securities laws, or lock-up agreements entered into by our directors, officers and substantially all of our stockholders with the underwriters. However, subject to applicable securities law restrictions, prohibitions and restrictions on the sale of these shares in the public market will be lifted beginning 180 days after the date of this prospectus. Morgan Stanley & Co. LLC, Goldman Sachs & Co. LLC and Piper Sandler & Co. may release all or some portion of the shares subject to lock-up agreements at any time and for any reason.
All of the shares of Class A Common Stock sold in this offering will be freely tradable without restriction or further registration under the Securities Act of 1933, as amended (the “Securities Act”), except that any shares held by our affiliates, as that term is defined under Rule 144 of the Securities Act (“Rule 144”), may be sold only in compliance with the limitations described in “Shares Eligible for Future Sale-Affiliate Resales of Restricted Securities.”
In addition, shares issued upon the exercise of stock options outstanding under our equity incentive plans, or pursuant to future awards granted under those plans, will become available for sale in the public market to the extent permitted by the provisions of applicable vesting schedules, any applicable market standoff and lock-up agreements, and Rule 144 and Rule 701 under the Securities Act (“Rule 701”). See the section titled “Shares Eligible for Future Sale” for additional information.
In connection with this offering, we intend to file a registration statement on Form S-8 providing for the registration of all shares of our Class A Common Stock that we may issue under our equity compensation plan. Once we register these shares, they can be freely sold in the public market upon issuance and once vested, subject to volume limitations applicable to affiliates and the lock-up agreements described in the section titled “Underwriting.” If any of these additional shares are sold, or if it is perceived that they will be sold, in the public market, the market price of our Class A Common Stock could decline.
Our principal stockholders and management own a significant percentage of our stock and will be able to exert significant control over matters subject to stockholder approval.
After this offering, our directors, officers, holders of more than 5% of our outstanding stock and their respective affiliates will beneficially own shares, in the aggregate, representing approximately % of our outstanding shares of Common Stock (or approximately % if the underwriters’ over-allotment option is exercised in full). As a result, these stockholders, if they act together, will be able to influence our management and affairs and all matters requiring stockholder approval, including the election of directors and approval of significant corporate transactions. This concentration of ownership may have the effect of delaying or preventing a change in control of our company and might affect the market price of our Class A Common Stock.
Certain of our directors are affiliates of other entities operating in the medical device industry that may overlap with our business.
The medical device industry is highly competitive, subject to change and significantly affected by new product introductions and market activities of industry participants. Two of our directors, Anthony Viscogliosi and Marc Viscogliosi, are also principals of Viscogliosi Brothers, LLC (“VB”), a single-family office founded by Anthony, John, and Marc Viscogliosi, with extensive experience in the neuro-musculoskeletal industry. VB’s portfolio companies (“VB Entities”), of which we are one, also include other companies in the medical device industry, such as VB Spine, LLC, a medical technology company that acquired Stryker’s U.S. spine implant
91
business (“VB Spine”), and Companion Spine, a provider of posterior spine non-fusion solutions. Anthony Viscogliosi and Marc Viscogliosi also serve as officers and/or directors of certain of the VB Entities. See the sections titled “Management” and “Certain Relationships and Related Party Transactions” for additional information about Anthony Viscogliosi, Marc Viscogliosi and the VB Entities.
There may be an overlap of our business strategies with those of one or more VB Entities, and the interests of our company and those of one or more VB Entities may be opposed to the interests of one another. This overlap could create conflicts of interest. For example, this overlap could create conflicts in determining, to which entity a particular investment opportunity should be presented. Acquisitions or other opportunities that may be of interest to us may come to, and may be pursued by, one of the VB Entities instead of us. These conflicts may not be resolved in our favor, and a potential target business that Anthony Viscogliosi and/or Marc Viscogliosi become aware of may be presented to a VB Entity prior to being presented to us. In addition, in the ordinary course of business, we will be sharing with Anthony Viscogliosi and Marc Viscogliosi, as directors serving on our board, confidential non-public information about our business, strategy and prospects. Such confidential non-public information may include information that would be useful in connection with the operations of one or more of the VB Entities (even if the VB Entities are not directly competing with our business). Anthony Viscogliosi’s position and/or Marc Viscogliosi’s position with one or more of the VB Entities may create a conflict between the advice provided to such entities and the fiduciary responsibilities owed to us. There can be no assurance that such conflicts will be resolved in our favor, which could adversely impact our business or prospects.
Provisions in our charter documents and under Delaware law could discourage a takeover that stockholders may consider favorable and may lead to entrenchment of management.
Our amended and restated certificate of incorporation and amended and restated bylaws that will be in effect immediately prior to the consummation of this offering will contain provisions that could delay or prevent changes in control or changes in our management without the consent of our board of directors. These provisions will include the following:
•
a classified board of directors with three-year staggered terms, which may delay the ability of stockholders to change the membership of a majority of our board of directors;
•
no cumulative voting in the election of directors, which limits the ability of minority stockholders to elect director candidates;
•
subject to the rights of holders of any series of preferred stock, the exclusive right of our board of directors to elect a director to fill a vacancy created by the expansion of the board of directors or the resignation, death or removal of a director, which prevents stockholders from being able to fill vacancies on our board of directors;
•
subject to the rights of holders of any series of preferred stock, the Board or any individual director may be removed from office at any time, but only for cause and only by the affirmative vote of the holders of at least 66-2/3% of all of the outstanding shares of capital stock of the Corporation entitled to vote generally in the election of directors, voting together as a single class;
•
the ability of our board of directors to authorize the issuance of shares of preferred stock and to determine the price and other terms of those shares, including preferences and voting rights, without stockholder approval, which could be used to significantly dilute the ownership of a hostile acquiror;
•
the ability of our board of directors to alter our amended and restated bylaws without obtaining stockholder approval;
•
the required approval of at least 66-2/3% of the shares entitled to vote to adopt, amend or repeal our amended and restated bylaws (however if the amended and restated bylaws amendment was recommended to the stockholders by Board, only a majority vote of all stockholders is required);
•
the required approval of at least 66-2/3% of the shares entitled to vote to adopt, amend or repeal certain provisions of our amended and restated certificate of incorporation, including those regarding the rights and limitations of our preferred stock and common stock and the election and removal of directors;
92
•
a prohibition on stockholder action by written consent, which forces stockholder action to be taken at an annual or special meeting of our stockholders;
•
an exclusive forum provision providing that the Court of Chancery of the State of Delaware will be the exclusive forum for certain actions and proceedings;
•
the requirement that a special meeting of stockholders may be called only by our board of directors, the Chair of our board of directors, our Chief Executive Officer or our President, which may delay the ability of our stockholders to force consideration of a proposal or to take action, including the removal of directors; and
•
advance notice procedures that stockholders must comply with in order to nominate candidates to our board of directors or to propose matters to be acted upon at a stockholders’ meeting, which may discourage or deter a potential acquiror from conducting a solicitation of proxies to elect the acquiror’s own slate of directors or otherwise attempting to obtain control of us.
These anti-takeover provisions could discourage, delay, or prevent a transaction involving a change in control of our company, including actions that our stockholders may deem advantageous, or negatively affect the trading price of our Class A common stock. These provisions could also discourage proxy contests and make it more difficult for you and other stockholders to elect directors of your choosing and to cause us to take other corporate actions you desire. For further discussion of these and other such anti-takeover provisions, see the section titled “Description of Capital Stock.”
Claims for indemnification by our directors, officers, and other employees or agents may reduce our available funds to satisfy successful third-party claims against us and may reduce the amount of money available to us.
Our amended and restated certificate of incorporation will provide that we will indemnify our directors and officers to the fullest extent permitted by Delaware law. In addition, as permitted by Section 145 of the Delaware General Corporation Law, our amended and restated certificate of incorporation to be effective immediately prior to the completion of this offering and our indemnification agreements that we have entered into with our directors, officers and certain other employees will provide that:
•
We will indemnify our directors and officers for serving us in those capacities or for serving other business enterprises at our request, to the fullest extent permitted by Delaware law. Delaware law provides that a corporation may indemnify such person if such person acted in good faith and in a manner such person reasonably believed to be in or not opposed to the best interests of the registrant and, with respect to any criminal proceeding, had no reasonable cause to believe such person’s conduct was unlawful.
•
We may, in our discretion, indemnify employees and agents in those circumstances where indemnification is permitted by applicable law.
•
We are required to advance expenses, as incurred, to our directors and officers in connection with defending a proceeding, except that such directors or officers shall undertake to repay such advances if it is ultimately determined that such person is not entitled to indemnification.
•
We will not be obligated pursuant to our amended and restated certificate of incorporation to indemnify a person with respect to proceedings initiated by that person against us or our other indemnitees.
•
The rights conferred in our amended and restated certificate of incorporation are not exclusive, and we are authorized to enter into indemnification agreements with our directors, officers, employees, and agents and to obtain insurance to indemnify such persons.
•
We may not retroactively amend our amended and restated certificate of incorporation provisions to reduce our indemnification obligations to directors, officers, employees, and agents.
93
Our amended and restated certificate of incorporation will provide that the Court of Chancery of the State of Delaware will be the exclusive forum for substantially all disputes between us and our stockholders and that the federal district courts shall be the exclusive forum for the resolution of any complaint asserting a cause of action arising under the Securities Act, which could limit our stockholders’ ability to obtain a favorable judicial forum for disputes with us or our directors, officers or employees or the underwriters or any offering giving rise to such claim.
Our amended and restated certificate of incorporation that will be in effect immediately after the closing of this offering will provide, that the Court of Chancery of the State of Delaware is the exclusive forum for any derivative action or proceeding brought on our behalf, any action asserting a breach of fiduciary duty, any action asserting a claim against us arising pursuant to the Delaware General Corporation Law, our amended and restated certificate of incorporation or our amended and restated bylaws, or any action asserting a claim against us that is governed by the internal affairs doctrine; provided, that, this provision would not apply to suits brought to enforce a duty or liability created by the Exchange Act or any other claim for which the federal courts have exclusive jurisdiction. Furthermore, our amended and restated certificate of incorporation will also provide that unless we consent in writing to the selection of an alternative forum, the federal district courts of the United States shall be the exclusive forum for the resolution of any complaint asserting a cause of action arising under the Securities Act. These choice of forum provisions may result in increased costs to stockholders to bring a claim, limit a stockholder’s ability to bring a claim in a judicial forum that it finds favorable for disputes with us or our directors, officers or other employees, and may generally have the effect of discouraging lawsuits against us and our directors, officers and other employees. By agreeing to this provision, however, stockholders will not be deemed to have waived our compliance with the federal securities laws and the rules and regulations thereunder. Furthermore, the enforceability of similar choice of forum provisions in other companies’ certificates of incorporation has been challenged in legal proceedings, and it is possible that a court could find these types of provisions to be inapplicable or unenforceable. If a court were to find the choice of forum provisions in our amended and restated certificate of incorporation to be inapplicable or unenforceable in an action, we may incur additional costs associated with resolving such action in other jurisdictions, which could adversely affect our business and financial condition.
General Risk Factors
We are subject to risks from legal and arbitration proceedings that may prevent us from pursuing our business activities or require us to incur additional costs in defending against claims or paying damages.
We may become subject to legal disputes and regulatory proceedings in connection with our business activities involving, among other things, product liability, product defects, intellectual property infringement, employment matters, and/or alleged violations of other applicable laws in various jurisdictions. We may not be insured against all potential damages that may arise out of any claims to which we may be party in the ordinary course of our business. A negative outcome of these proceedings may prevent us from pursuing certain activities and/or require us to incur additional costs in order to do so and pay damages. In addition, securities class action litigation has often been instituted against companies following periods of volatility in the market price of a company’s securities. This type of litigation, if instituted, could result in substantial costs and a diversion of management’s attention and resources, which would harm our business, financial condition, results of operations and prospects. Additionally, the significant increase in the cost of directors’ and officers’ liability insurance may cause us to opt for lower overall policy limits or to forgo insurance that we may otherwise rely on to cover significant defense costs, settlements, and damages awarded to plaintiffs.
The outcome of pending or potential future legal and arbitration proceedings is difficult to predict with certainty. In the event of a negative outcome of any material legal or arbitration proceeding, whether based on a judgment or a settlement agreement, we could be obligated to make substantial payments, which could have a material adverse effect on our business, financial condition, results of operations, and prospects. In addition, the costs related to litigation and arbitration proceedings may be significant, and any legal or arbitration proceedings could have a material adverse effect on our business, financial condition, results of operations, and prospects.
94
The requirements of being a public company may divert our management’s attention from our growth strategies and other business concerns.
As a public company, we will be subject to the reporting requirements of the Exchange Act and will be required to comply with the applicable requirements of the Sarbanes-Oxley Act and the Dodd- Frank Wall Street Reform and Consumer Protection Act of 2010 (the “Dodd-Frank Act”), the listing requirements of the New York Stock Exchange and other applicable securities rules and regulations. Compliance with these rules and regulations will increase our legal and financial compliance costs, make some activities more difficult, time consuming or costly and increase demand on our systems and resources. Among other things, the Exchange Act requires that we file annual, quarterly and current reports with respect to our business and results of operations and maintain effective disclosure controls and procedures and internal controls over financial reporting. In order to maintain and, if required, improve our disclosure controls and procedures and internal controls over financial reporting to meet this standard, significant resources and management oversight may be required. As a result, management’s attention may be diverted from executing our growth strategies and managing other business concerns and, which could have a material adverse effect on our business, financial condition and results of operations. We may need to hire additional employees to comply with these requirements, which will increase our costs and expenses. Additionally, as a public company, it will be more expensive for us to obtain director and officer liability insurance, and we may be required to accept reduced coverage or incur substantially higher costs to obtain coverage. These factors could make it more difficult for us to attract and retain qualified members of our board of directors, particularly to serve on our audit committee and compensation committee, and qualified executive officers.
We will incur significant costs as a result of operating as a public company and our executive management team expects to devote substantial time to public company compliance programs.
As a public company, we will incur significant legal, accounting and other expenses due to our compliance with regulations and disclosure obligations applicable to us, including compliance with the Sarbanes-Oxley Act, as well as rules implemented by the SEC and NYSE. Stockholder activism, the current political environment and the current high level of government intervention and regulatory reform may lead to substantial new regulations and disclosure obligations, which may lead to additional compliance costs and impact, in ways we cannot currently anticipate, the manner in which we operate our business. Our executive management team and other personnel will devote a substantial amount of time to these compliance programs and monitoring of public company reporting obligations and as a result of the new corporate governance and executive compensation related rules, regulations and guidelines prompted by the Dodd-Frank Act, and further regulations and disclosure obligations expected in the future, we will likely need to devote additional time and costs to comply with such compliance programs and rules. These rules and regulations will cause us to incur significant legal and financial compliance costs and will make some activities more time-consuming and costly.
If securities or industry analysts do not publish research or reports about our business, or if they issue an adverse or misleading opinion regarding our stock, our stock price and trading volume could decline.
The trading market for our Class A Common Stock will be influenced by the research and reports that industry or securities analysts publish about us or our business. We do not currently have and may never obtain research coverage by securities and industry analysts. If no or few securities or industry analysts commence coverage of us, the market price for our stock would be negatively impacted. In the event we obtain securities or industry analyst coverage, if any of the analysts who cover us issue an adverse or misleading opinion regarding us, our business model, our intellectual property or our stock performance, or if our results of operations fail to meet the expectations of analysts, our stock price would likely decline. If one or more of these analysts cease coverage of us or fail to publish reports on us regularly, we could lose visibility in the financial markets, which in turn could cause our stock price or trading volume to decline.
Our disclosure controls and procedures may not prevent or detect all errors or acts of fraud.
Upon the completion of this offering, we will become subject to the periodic reporting requirements of the Exchange Act. We must design our disclosure controls and procedures to reasonably assure that information we must disclose in reports we file or submit under the Exchange Act is accumulated and communicated to
95
management, and recorded, processed, summarized, and reported within the time periods specified in the rules and forms of the SEC. We believe that any disclosure controls and procedures or internal controls and procedures, no matter how well-conceived and operated, can provide only reasonable, not absolute, assurance that the objectives of the control system are met. These inherent limitations include the realities that judgments in decision-making can be faulty, and that breakdowns can occur because of simple error or mistake. For example, our directors or executive officers could inadvertently fail to disclose a new relationship or arrangement, causing us to fail to make a required related party transaction disclosure. Additionally, controls can be circumvented by the individual acts of some persons, by collusion of two or more people, or by an unauthorized override of the controls. Accordingly, because of the inherent limitations in our control system, misstatements due to error or fraud may occur and not be detected.
The increasing use of social media platforms presents new risks and challenges.
Social media is increasingly being used to communicate about our products and technologies, and we utilize appropriate social media in connection with the commercialization of our implants. Social media practices in the medical device industry continue to evolve and regulations and regulatory guidance relating to such use are evolving and not always clear. This evolution creates uncertainty and risk of noncompliance with regulations applicable to our business, resulting in potential regulatory actions against us, along with the potential for litigation. In addition, there is a risk of inappropriate disclosure of sensitive information or negative or inaccurate posts or comments about us or our systems on any social networking website. If any of these events were to occur or we otherwise fail to comply with any applicable regulations, we could incur liability, face restrictive regulatory actions, or incur other harm to our business such as reputational damage.
96
SPECIAL NOTE REGARDING FORWARD-LOOKING STATEMENTS
This prospectus contains forward-looking statements concerning our business, operations and financial performance and condition, as well as our plans, objectives and expectations for our business operations and financial performance and condition. Any statements contained herein that are not statements of historical facts may be deemed to be forward-looking statements. In some cases, you can identify forward-looking statements by terminology such as “aim,” “anticipate,” “assume,” “believe,” “contemplate,” “continue,” “could,” “due,” “estimate,” “expect,” “goal,” “intend,” “may,” “objective,” “plan,” “predict,” “potential,” “positioned,” “seek,” “should,” “target,” “will,” “would” and other similar expressions that are predictions of or indicate future events and future trends, or the negative of these terms or other comparable terminology, although not all forward-looking statements contain these words.
Forward-looking statements contained in this prospectus include, but are not limited to, statements about:
•
the expected growth of our business and our organization and our ability to continue to expand geographically;
•
the continued and future acceptance of our existing portfolio of products and any new products by physicians, patients, third-party payors and others in the medical community;
•
our estimates of our market opportunity and the factors we believe drive demand for our products and our ability to sustain or increase such demand;
•
our ability to achieve and maintain adequate levels of coverage and/or reimbursement for our products, the procedures using our products, or any future products we may seek to commercialize;
•
availability of additional funds in the future on acceptable terms or at all;
•
our ability to comply with financial or other covenants in our financing agreements;
•
the FDA regulatory process and our ability to obtain and maintain required regulatory clearances and approvals;
•
our estimates of our expenses, ongoing losses, future revenue, capital requirements and our need for, or ability to obtain, additional financing;
•
our reliance on a limited number of suppliers, which may impact the availability of our products;
•
our compliance with, and the cost of, federal, state, and foreign regulatory requirements;
•
our ability to retain and recruit key personnel, including the continued development of our sales and marketing infrastructure;
•
our ability to maintain intellectual property protection for our products;
•
developments and projections relating to our competitors and our industry;
•
our expectations regarding the period during which we will qualify as an emerging growth company under the JOBS Act;
•
our expected use of our existing cash and cash equivalents and the proceeds from this offering.
•
the amount and timing of payments under the Tax Receivable Agreement;
•
the tax benefits we expect to realize as a result of the Up-C organizational structure and the related Tax Receivable Agreement;
•
the impact of our organizational structure, including the Tax Receivable Agreement, on our financial condition and results of operations, and the potential for payments under the Tax Receivable Agreement to exceed our actual cash tax savings;
•
anticipated trends and challenges in our business and the markets in which we operate;
•
our ability to obtain and maintain the listing of the Class A Common Stock on the NYSE in connection with and following this offering;
97
•
other events or factors, including those resulting from pandemics, war or incidents of terrorism; and
•
other risks and uncertainties, including those listed under the caption “Risk Factors.”
We caution you that the foregoing list does not contain all of the forward-looking statements made in this prospectus.
Forward-looking statements are based on management’s current expectations, estimates, forecasts and projections about our business and the industry in which we operate, and management’s beliefs and assumptions are not guarantees of future performance or development and involve known and unknown risks, uncertainties and other factors that are in some cases beyond our control. As a result, any or all of our forward-looking statements in this prospectus may turn out to be inaccurate. Furthermore, if the forward-looking statements prove to be inaccurate, the inaccuracy may be material. In light of the significant uncertainties in these forward-looking statements, you should not regard these statements as a representation or warranty by us or any other person that we will achieve our objectives and plans in any specified time frame, or at all. Factors that may cause actual results to differ materially from current expectations include, among other things, those described in the section titled “Risk Factors” and elsewhere in this prospectus. Potential investors are urged to consider these factors carefully in evaluating these forward-looking statements.
Forward-looking statements reflect our beliefs and opinions on the relevant subject. These statements are based on information available to us as of the date of this prospectus, and while we believe that information provides a reasonable basis for these statements, that information may be limited or incomplete. Our statements should not be read to indicate that we have conducted an exhaustive inquiry into, or review of, all relevant information. These statements are inherently uncertain, and we may not actually achieve the plans, intentions or expectations disclosed in our forward-looking statements.
You should not place undue reliance on our forward-looking statements. We qualify all of the forward-looking statements in this prospectus by these cautionary statements.
These forward-looking statements speak only as of the date of this prospectus. Except as required by law, we assume no obligation to update or revise these forward-looking statements for any reason, even if new information becomes available in the future.
98
USE OF PROCEEDS
We estimate the net proceeds from this initial public offering of shares of Class A Common Stock will be approximately $ million, or $ million if the underwriters exercise their option to purchase additional shares in full, assuming an initial public offering price of $ per share, which is the midpoint of the price range set forth on the cover page of this prospectus, after deducting the underwriting discounts and commissions and estimated offering expenses payable by us.
Each $1.00 increase (decrease) in the assumed initial public offering price of $ per share, the midpoint of the price range set forth on the cover page of this prospectus, would increase (decrease) our net proceeds by approximately $ million, assuming that the number of shares offered by us, as set forth on the cover page of this prospectus, remains the same, and after deducting the underwriting discounts and commissions and estimated offering expenses payable by us. We may also increase or decrease the number of shares we are offering. Each increase (decrease) of 1,000,000 shares in the number of shares offered by us would increase (decrease) our net proceeds by approximately $ million, assuming that the assumed initial public offering price remains the same, and after deducting the underwriting discounts and commissions and estimated offering expenses payable by us.
We intend to use such net proceeds to purchase newly-issued Series A Common Units of Centinel LLC. The Series A Common Units will be purchased by us at a purchase price per unit equal to the initial public offering price per share of Class A Common Stock in this offering, less underwriting discounts and commissions. See “Organizational Structure—Organizational Transactions.”
In turn, Centinel LLC intends to use the proceeds received from us in respect of the newly-issued Series A Common Units, as follows:
•
approximately $ million to $ million to pay expenses incurred in connection with this offering and the Organizational Transactions;
•
approximately $ million to $ million to repay the term notes maturing on September 30, 2030 issued under the 2023 Credit Agreement, together with accrued and unpaid interest at 10% per annum and the Make-Whole Amount;
•
approximately $ million to $ million to repay a portion of the Term Loan maturing on March 1, 2030 outstanding under the Loan Agreement, together with accrued and unpaid interest at a floating interest rate per annum equal to the Term SOFR plus 5.30%;
•
approximately $ million to $ million to fund sales and marketing, including expanding the sales infrastructure, patient awareness platform and our medical education programs;
•
approximately $ million to $ million to fund our research and development expenses, including our clinical expenses to pursue two level indication for prodisc C, as well as cervical hybrid indication for prodisc C, prodisc Vivo, prodisc SK and prodisc Nova, estimated to achieve the FDA approval, provided, however, that the FDA approval for these indications is not guaranteed;
•
approximately $ million to $ million to fund capital expenditures, including more instrument sets and implant inventory; and
•
the remainder for general corporate purposes, including working capital and operating expenses.
See “Management’s Discussion and Analysis of Financial Condition and Results of Operations—Liquidity and Capital Resources—Debt Obligations” for information related to the terms of our indebtedness under the Loan Agreement, the 2025 Credit Agreement, and the 2023 Credit Agreement, including, but not limited to, the Make-Whole Amount.
Centinel LLC may also use a portion of our net proceeds to acquire or invest in complementary products, technologies, or businesses; however, we currently have no agreements or commitments to complete any such transactions.
We believe, based on our current operating plan, that our current capital resources, along with the net proceeds from this offering, will be sufficient for us to fund our operating expenses and capital expenditure requirements for at least the next twelve months. However, our expected use of the net proceeds from this offering described
99
above represents our intentions based upon our current plans and business conditions. We cannot predict with certainty all of the particular uses for the net proceeds to be received upon the completion of this offering or the amounts that we will actually spend on the uses set forth above. The amounts and timing of our actual expenditures will depend on numerous factors, including the time and cost necessary to conduct our planned commercialization activities, the results of our planned clinical studies and other factors described in the section titled “Risk Factors” in this prospectus, as well as the amount of cash used in our operations and any unforeseen cash needs. Therefore, our actual expenditures may differ materially from the estimates described above. We may find it necessary or advisable to use the net proceeds for other purposes, and we will have broad discretion over the allocation of the net proceeds from this offering.
Pending use of the net proceeds from this offering described above, we may invest the net proceeds from this offering in short- and intermediate-term interest-bearing obligations, investment-grade instruments, certificates of deposit or direct or guaranteed obligations of the United States government.
100
DIVIDEND POLICY
We do not anticipate declaring or paying any cash dividends to holders of our Class A Common Stock in the foreseeable future. We currently intend to retain all available funds and future earnings, if any, to finance the growth of our business. However, we may, in the future, decide to pay dividends on our Class A Common Stock. Any declaration and payment of cash dividends in the future, if any, will be at the discretion of our board of directors and will depend upon such factors as earnings levels, cash flows, capital requirements, levels of indebtedness, restrictions imposed by applicable law, applicable credit or financing agreements, our overall financial condition, restrictions in our debt financing agreements, and any other factors deemed relevant by our board of directors.
Immediately following this offering, we will be a holding company, and our sole asset will be the direct or indirect ownership of Series A Common Units we purchase from Centinel LLC. If we decide to pay a dividend in the future, we would need to cause Centinel LLC to make distributions to us in an amount sufficient to cover such dividend. If Centinel LLC makes such distributions to us, the Continuing Equity Owners will be entitled to receive pro rata distributions. See “Risk Factors—Risks Related to Our Organizational Structure.”
101
ORGANIZATIONAL STRUCTURE
Centinel Holdco, a Delaware corporation, was formed on April 24, 2026 and is the issuer of the shares of Class A Common Stock offered by this prospectus. Prior to this offering and the Organizational Transactions, all of our business operations have been conducted through Centinel LLC and its direct and indirect subsidiaries. Centinel Holdco has not engaged in any business or other activities other than in connection with our formation and this offering. We will consummate the Organizational Transactions, excluding this offering, substantially concurrently with or prior to the consummation of this offering. Upon consummation of this offering and the application of the net proceeds therefrom, we will be a holding company and the sole managing member of Centinel LLC, and upon consummation of the Organizational Transactions, our principal asset will consist of Series A Common Units and we will operate and control all of the business and affairs and consolidate the financial results of Centinel LLC.
Existing Organization
Centinel LLC is treated as a partnership for U.S. federal income tax purposes and, as such, is generally not subject to any U.S. federal entity-level income taxes. Taxable income or loss of Centinel LLC is included in the U.S. federal income tax returns of Centinel LLC’s members.
The diagram below depicts our historical organizational structure prior to the completion of the Organizational Transactions. This diagram is provided for illustrative purposes only and does not purport to represent all legal entities owned or controlled by us, or owning a beneficial interest in us.
102
Reorganization Transactions
The following reorganization transactions will each be completed prior to or in connection with the completion of this offering:
•
We will issue Class B Preferred Units of Centinel LLC to the Convertible Debt Holders of Centinel LLC’s outstanding 6% Convertible Note upon the conversion of the outstanding principal amount (plus accrued interest, if any) of the 6% Convertible Note at a conversion price of $1.39435 per unit;
•
We will issue Class B Preferred Units of Centinel LLC to the Convertible Debt Holders of Centinel LLC’s outstanding 4.42% Convertible Notes upon the conversion of the outstanding principal amount (plus accrued interest) of the 4.42% Convertible Notes at a conversion price of $1.39435 per unit, if and to the extent such Convertible Debt Holders convert their 4.42% Convertible Notes;
•
We will issue Class A Preferred Units of Centinel LLC to the Class A Warrant Holders, if and to the extent such Class A Warrant Holders exercise their Class A Warrants on a cashless basis;
•
We will issue Class B Preferred Units of Centinel LLC to the Class B Warrant Holders, if and to the extent such Class B Warrant Holders exercise their Class B Warrants on a cashless basis;
•
All outstanding Class A Preferred Units and Class B Preferred Units, including those that are issued upon conversion or exercise, as applicable, of the Convertible Notes, Class A Warrants and Class B Warrants will be converted into common units of Centinel LLC;
•
We will amend and restate the existing Centinel LLC Agreement, effective immediately prior to the consummation of this offering, to, among other things, (i) modify the capital structure of Centinel LLC by replacing the then current common units with two new series of common membership interests consisting of the Series A Common Units and the Series B Common Units and (ii) appoint Centinel Holdco as the sole managing member of Centinel LLC. See “—Amended and Restated Operating Agreement of Centinel LLC.”
•
In accordance with the terms of the Class A Warrants and Class B Warrants, Centinel LLC will issue replacement warrants to purchase Series B Common Units to the Class A Warrant Holders and Class B Warrant Holders that did not exercise their Class A Warrants and Class B Warrants, and the Class A Warrants and Class B Warrants will be terminated. The replacement warrants issued to each such Class A Warrant Holder will be exercisable into an equivalent number of Series B Common Units of Centinel LLC on a -to- basis (i.e., for each Class A Preferred Unit into which a Class A Warrant was exercisable, the replacement warrant shall be exercisable into Series B Common Units). The replacement warrants issued to each such Class B Warrant Holder will be exercisable into an equivalent number of Series B Common Units of Centinel LLC on a -to- basis (i.e., for each Class B Preferred Unit into which a Class B Warrant was exercisable, the replacement warrant shall be exercisable into Series B Common Units). In addition, upon the exercise of either replacement Class A Warrant or replacement Class B Warrant, the holder will also receive shares of Class B Common Stock, which will be equal to the number of Series B Common Units received upon such exercise.
•
We will amend and restate the certificate of incorporation of Centinel Holdco to, among other things, provide (i) for Class A Common Stock, with each share of our Class A Common Stock entitling its holder to one vote per share on all matters presented to our stockholders generally, (ii) for Class B Common Stock, with each share of our Class B Common Stock entitling its holder to one vote per share on all matters presented to our stockholders generally, and (iii) for undesignated preferred stock, the rights, preferences and privileges of which may be designated from time to time by our Board, and which can be issued by our Board from time to time in one or more series without stockholder approval;
•
Centinel Holdco will acquire, by means of a series of sequential two-step mergers, the Blocker Companies as follows: (i) Centinel Holdco will form two new corporations: “CSH Merger Sub 1, Inc.” and “DS Merger Sub 2, Inc.,” and also form two limited liability companies: “CSH Legacy Blocker I, LLC” and “DS Legacy Blocker II, LLC”; (ii) CSH Merger Sub 1, Inc. will merge with and into Centinel Spine Holdings, Inc., with Centinel Spine Holdings, Inc. surviving, and each stockholder of Centinel Spine Holdings, Inc. exchanging its shares in Centinel Spine Holdings, Inc. for shares of Class A Common Stock in Centinel Holdco and the right to receive payments under the Tax Receivable
103
Agreement. The surviving corporation would then merge into CSH Legacy Blocker I, LLC, with CSH Legacy Blocker I, LLC surviving. The Series B Common Units owned by CSH Legacy Blocker I, LLC through the mergers will be automatically cancelled and an equivalent number of Series A Common Units will be issued to CSH Legacy Blocker I, LLC. This process will be repeated for Delac Spine, Inc. with DS Merger Sub 2, Inc. and DS Legacy Blocker II, LLC.
•
We will issue shares of our Class B Common Stock to the Continuing Equity Owners, which will be equal to the number of Series B Common Units held by such Continuing Equity Owners, for nominal consideration;
•
We will assume all outstanding Centinel LLC Options issued pursuant to, and granted under, the Centinel LLC Incentive Plan, which Centinel LLC Options will become exercisable for shares of Class A Common Stock on a -for- basis;
•
We will sell and issue shares of our Class A Common Stock to the investors in this offering (or shares if the underwriters exercise in full their option to purchase additional shares of Class A Common Stock) in exchange for net proceeds of approximately $ million (or approximately $ million if the underwriters exercise in full their option to purchase additional shares of Class A Common Stock) based upon an assumed initial public offering price of $ per share (the midpoint of the estimated price range set forth on the cover page of this prospectus), less the estimated underwriting discounts and commissions and estimated offering expenses payable by us;
•
We will use the net proceeds from this offering to purchase newly-issued Series A Common Units directly from Centinel LLC for approximately $ million, at a purchase price per Series A Common Unit equal to the initial public offering price per share of Class A Common Stock in this offering, less the underwriting discounts and commissions;
•
In accordance with the terms of the 4.42% Convertible Notes, the 4.42% Convertible Notes that did not convert into Class B Preferred Units of Centinel LLC as described above will be automatically converted into newly issued shares of Class A Common Stock (with the unpaid principal being converted at a conversion price equal to a 30% discount to the initial public offering price per share of Class A Common Stock);
•
Centinel LLC will issue to us a number of Series A Common Units equal to the number of shares of Class A Common Stock into which the 4.42% Convertible Notes were automatically converted as described in the previous paragraph;
•
Centinel Holdco will enter into (i) the Exchange Agreement with Centinel LLC and the Continuing Equity Owners, and (ii) the Tax Receivable Agreement with Centinel LLC, the Continuing Equity Owners and the Blocker Stockholders. For a description of the terms of the Exchange Agreement and the Tax Receivable Agreement, see “Certain Relationships and Related Party Transactions.”
Organizational Structure Following the Organizational Transactions
•
Centinel Holdco will be a holding company and our principal asset will consist of Series A Common Units;
•
Centinel Holdco will be the sole managing member of Centinel LLC and will control the business and affairs of Centinel LLC;
•
Centinel Holdco will own, directly or indirectly, Series A Common Units, representing approximately % of the economic interest in Centinel LLC (or approximately % of the economic interest in Centinel LLC if the underwriters exercise in full their option to purchase additional shares of Class A Common Stock);
•
The Continuing Equity Owners will own (i) Series B Common Units, representing approximately % of the economic interest in Centinel LLC (or approximately % of the economic interest in Centinel LLC if the underwriters exercise in full their option to purchase additional shares of Class A Common Stock), and (ii) shares of Class B Common Stock, representing approximately % of the combined voting power of all of Centinel Holdco’s Common Stock (or shares of Class B Common Stock, representing approximately % of the
104
combined voting power of all of Centinel Holdco’s Common Stock if the underwriters exercise in full their option to purchase additional shares of Class A Common Stock);
•
The Blocker Stockholders will own (i) shares of Class A Common Stock, representing approximately % of the combined voting power of all of Centinel Holdco’s Common Stock and approximately % of the economic interest in Centinel Holdco (or approximately % of the combined voting power and approximately % of the economic interest if the underwriters exercise in full their option to purchase additional shares of Class A Common Stock), and (ii) through Centinel Holdco’s ownership of Series A Common Units, indirectly will hold approximately % of the economic interest in Centinel LLC (or approximately % of the economic interest in Centinel LLC if the underwriters exercise in full their option to purchase additional shares of Class A Common Stock); and
•
The investors in this offering will own (i) shares of Class A Common Stock (or shares of Class A Common Stock if the underwriters exercise in full their option to purchase additional shares of Class A Common Stock), representing approximately % of the combined voting power of all of Centinel Holdco’s Common Stock and approximately % of the economic interest in Centinel Holdco (or approximately % of the combined voting power and approximately % of the economic interest if the underwriters exercise in full their option to purchase additional shares of Class A Common Stock), and (ii) through Centinel Holdco’s ownership of Series A Common Units, indirectly will hold approximately % of the economic interest in Centinel LLC (or approximately % of the economic interest in Centinel LLC if the underwriters exercise in full their option to purchase additional shares of Class A Common Stock).
Our corporate structure following this offering, as described below, is commonly referred to as an umbrella partnership-C corporation (“Up-C”) structure, which is often used by partnerships and limited liability companies when they undertake an initial public offering of their business. The Up-C structure will allow the Continuing Equity Owners to retain their equity ownership in Centinel LLC and to continue to realize tax benefits associated with owning interests in an entity that is treated as a partnership, or “flow-through” entity, for U.S. federal income tax purposes following the offering. Investors in this offering will, by contrast, hold their equity ownership in Centinel Holdco, a Delaware corporation that is a domestic corporation for U.S. federal income tax purposes, in the form of shares of Class A Common Stock.
We believe that the Continuing Equity Owners generally will find it advantageous to hold their equity interests in an entity that is not taxable as a corporation for United States federal income tax purposes. The Continuing Equity Owners will be allocated their proportionate share of any taxable income of Centinel LLC. The Continuing Equity Owners will also hold shares of our Class B Common Stock. When the Continuing Equity Owners exchange Series B Common Units for, at our election, shares of our Class A Common Stock or cash, pursuant to the Exchange Agreement described below, they will also be required to deliver an equivalent number of shares of Class B Common Stock. Any Series B Common Units and shares of Class B Common Stock so delivered will be cancelled, and Centinel LLC will issue us a number of Series A Common Units equal to the number of cancelled Series B Common Units.
105
The diagram below depicts our expected organizational structure immediately following completion of the Organizational Transactions. This diagram is provided for illustrative purposes only and does not purport to represent all legal entities owned or controlled by us, or owning a beneficial interest in us.
Centinel Holdco
Centinel Holdco was incorporated in Delaware on April 24, 2026, and has not engaged in any business or other activities except in connection with its formation and this offering. Our certificate of incorporation will be amended and restated immediately prior to the consummation of this offering. Our amended and restated certificate of incorporation will authorize two classes of Common Stock, Class A Common Stock and Class B Common Stock, each having the terms described in the section titled “Description of Capital Stock.” In addition, our amended and restated certificate of incorporation will authorize shares of undesignated preferred stock, the rights, preferences and privileges of which may be designated from time to time by our Board, and which can be issued by our Board from time to time in one or more series without stockholder approval.
Shares of our Class B Common Stock, which provide no economic rights, will be issued to the Continuing Equity Owners in connection with this offering. Each share of our Class B Common Stock entitles its holder to one vote on all matters to be voted on by our stockholders generally. See the section titled “Description of Capital Stock-Class B Common Stock.” Holders of our Class A Common Stock and Class B Common Stock vote together as a single class on all matters presented to our stockholders for their vote or approval, except as otherwise required by applicable law.
106
Sole Managing Member
In connection with this offering, we will become a member and the sole managing member of Centinel LLC. As the sole managing member, we will be able to control all of the day-to-day business affairs and decision-making of Centinel LLC without the approval of any other member, unless otherwise stated in the Amended and Restated Centinel LLC Agreement. As such, through our officers and directors, we will be responsible for all operational and administrative decisions of Centinel LLC and the day-to-day management of Centinel LLC’s business. Pursuant to the Amended and Restated Centinel LLC Agreement, we cannot be removed, under any circumstances, as the sole managing member of Centinel LLC, except by our election.
Compensation
We will not be entitled to compensation for our services as managing member. We will be entitled to reimbursement by Centinel LLC for fees and expenses incurred on behalf of Centinel LLC, including all expenses associated with the Organizational Transactions, including this offering, and maintaining our corporate existence.
Amended and Restated Operating Agreement of Centinel LLC
In connection with the completion of this offering, we will amend and restate the existing Centinel LLC Agreement. The operations of Centinel LLC, and the rights and obligations of the holders of LLC Units (collectively, the “LLC Unitholders”), will be set forth in the Amended and Restated Centinel LLC Agreement. The Amended and Restated Centinel LLC Agreement will be filed as an exhibit to the registration statement of which this prospectus forms a part.
Capitalization of Centinel LLC Upon Completion of this Offering
In connection with the completion of this offering, the Centinel LLC Agreement will be amended and restated to recapitalize the interests currently held by the existing owners of Centinel LLC into two new classes of common membership units, which will be comprised of the Series A Common Units and the Series B Common Units. The Amended and Restated Centinel LLC Agreement will authorize the issuance of an unlimited number of Series A Common Units and Series B Common Units. The Series A Common Units and Series B Common Units will each represent a substantially identical interest in Centinel LLC, except that Series A Common Units will only be held by Centinel Holdco, directly or indirectly, and Series B Common Units will be held by the Continuing Equity Owners, who will also hold a corresponding number of shares of Class B Common Stock. Each LLC Unit will entitle the holder to a pro rata share of the net profits and net losses and distributions of Centinel LLC. Holders of LLC Units will have no voting rights, except as expressly provided in the Amended and Restated Centinel LLC Agreement. Series B Common Units will not be entitled to any voting rights, as the holders of such units will be entitled to exercise voting rights through their corresponding shares of Class B Common Stock.
In addition, the Amended and Restated Centinel LLC Agreement will authorize the issuance to us of an unlimited number of convertible preferred units and non-convertible preferred units (collectively, the “Holdco Preferred Units”). There will be no Holdco Preferred Units outstanding upon completion of this offering; however, Centinel LLC may issue Holdco Preferred Units to Centinel Holdco in connection with the future issuance by Centinel Holdco of preferred stock. See “Description of Capital Stock-Preferred Stock.”
Exchange Rights
The Amended and Restated Centinel LLC Agreement will provide that the Continuing Equity Owners (and certain permitted transferees thereof) may, pursuant to the terms of the Exchange Agreement described below, exchange their Series B Common Units of Centinel LLC for, at our election, shares of our Class A Common Stock on a one-for-one basis or cash, as set forth in the Exchange Agreement. A holder of Series B Common Units will also be required to deliver to us an equivalent number of shares of Class B Common Stock to effectuate an exchange. As a holder exchanges its Series B Common Units, our interest in Centinel LLC will be correspondingly increased. See “—Exchange Agreement.”
107
Issuance of LLC Units Upon Exercise of Options or Issuance of Other Equity Compensation
Upon the exercise of options issued by us, or the issuance of other types of equity compensation by us (such as the issuance of restricted or non-restricted stock, payment of bonuses in stock or settlement of stock appreciation rights in stock), we will be required to acquire from Centinel LLC a number of Series A Common Units of Centinel LLC equal to the number of shares of Class A Common Stock being issued in connection with the exercise of such options or issuance of other types of equity compensation.
Maintenance of One-to-One Ratio of Shares of Class A Common Stock and LLC Units Owned by Centinel Holdco
The Amended and Restated Centinel LLC Agreement will require that (i) we at all times maintain a ratio of one Series A Common Unit of Centinel LLC owned by us for each share of Class A Common Stock issued by us (subject to certain exceptions for treasury shares and shares underlying certain convertible or exchangeable securities), and (ii) Centinel LLC at all times maintains (i) a one-to-one ratio between the number of shares of Class A Common Stock issued by us and the number of Series A Common Units owned by us and (ii) a one-to-one ratio between the number of shares of Class B Common Stock issued and outstanding by us and the number of Series B Common Units owned by the Continuing Equity Owners and their permitted transferees, collectively.
Transfer Restrictions
The Amended and Restated Centinel LLC Agreement generally does not permit transfers of LLC Units by members, subject to limited exceptions. Any transferee of LLC Units must assume, by operation of law or written agreement, all of the obligations of a transferring member with respect to the transferred units, even if the transferee is not admitted as a member of Centinel LLC.
Distributions
The Amended and Restated Centinel LLC Agreement will provide that, to the extent Centinel LLC has available cash and subject to the terms of any credit agreements and contractual restrictions, Centinel LLC will make pro rata cash distributions to holders of LLC Units, including Centinel Holdco, in amounts at least sufficient to allow each member to satisfy its income tax liabilities with respect to its allocable share of the taxable income of Centinel LLC. In addition, the Amended and Restated Centinel LLC Agreement will provide for payments to Centinel Holdco to reimburse it for its corporate and other overhead expenses, including any payments due under the Tax Receivable Agreement. If the amount of tax distributions to be made exceeds the amount of funds available for distribution, such distributions will be made pro rata to the members to the extent of available funds, and any shortfall will be distributed when funds become available.
Tax Receivable Agreement
Prior to the completion of this offering, Centinel Holdco will enter into the Tax Receivable Agreement with Centinel LLC, the Continuing Equity Owners and Blocker Stockholders that provides for the payment by Centinel Holdco to such Continuing Equity Owners and Blocker Stockholders of 85% of certain tax benefits, if any, that Centinel Holdco actually realizes, or is deemed to realize (calculated using certain assumptions), as a result of (i) Centinel Holdco’s allocable share of existing tax basis in Centinel LLC’s assets acquired in this offering, (ii) increases in Centinel Holdco’s allocable share of existing tax basis and tax basis adjustments to the tangible and intangible assets of Centinel LLC as a result of sales or exchanges of Series B Common Units in connection with or after this offering, (iii) Centinel Holdco’s utilization of certain tax attributes (including any existing tax basis) of the Blocker Companies, which Centinel Holdco acquires in connection with this offering, and (iv) certain other tax benefits related to our entering into the Tax Receivable Agreement, including tax benefits attributable to payments under the Tax Receivable Agreement. Sales or exchanges of Series B Common Units are expected to result in increases in the tax basis of the assets of Centinel LLC. The existing tax basis, increases in existing tax basis, and the tax basis adjustments generated over time may increase (for tax purposes) depreciation and amortization deductions available to Centinel Holdco and, therefore, may reduce the amount of U.S. federal, state, and local tax that Centinel Holdco would otherwise be required to pay in the future. Actual tax benefits realized by Centinel Holdco may differ from tax benefits calculated under the Tax Receivable Agreement as a result of the use of certain assumptions in the Tax Receivable
108
Agreement, including the use of an assumed blended state and local income tax rate of % (as adjusted to take into account the U.S. federal tax benefit of such taxes) to calculate tax benefits. This payment obligation is an obligation of Centinel Holdco and not of Centinel LLC. See “Certain Relationships and Related Party Transactions—Tax Receivable Agreement.”
Exchange Agreement
We will enter into the Exchange Agreement with Centinel LLC and the Continuing Equity Owners. Under the Exchange Agreement, from and after the expiration or earlier waiver of the lock-up period applicable to this offering, the Continuing Equity Owners (and certain permitted transferees thereof) may (subject to the terms of the Exchange Agreement) exchange their Series B Common Units for, at our election, shares of our Class A Common Stock on a one-for-one basis or cash, as set forth in the Exchange Agreement; provided that we may elect to settle an exchange in cash only in connection with a substantially concurrent public offering or private sale of Class A Common Stock and only to the extent of the proceeds received by us in such offering or sale. The holders of Series B Common Units will also be required to deliver to us an equivalent number of shares of Class B Common Stock to effectuate an exchange. Any shares of Class B Common Stock and Series B Common Units so delivered will be cancelled, and Centinel LLC will issue us a number of Series A Common Units equal to the number of cancelled Series B Common Units. As a holder exchanges its Series B Common Units of Centinel LLC, our interest in Centinel LLC will be correspondingly increased.
109
CAPITALIZATION
The following table sets forth the cash and cash equivalents and capitalization as of , 2026:
•
of Centinel LLC and its subsidiaries on an actual basis;
•
of Centinel Holdco on a pro forma basis to give effect to the completion of the Organizational Transactions, excluding the consummation of this offering, the use of the net proceeds therefrom and related transactions; and
•
of Centinel Holdco on a pro forma as adjusted basis to give further effect to our issuance and sale of shares of our Class A Common Stock in this offering at an assumed initial public offering price of $ per share, which is the midpoint of the price range set forth on the cover page of this prospectus, after deducting the underwriting discounts and commissions and estimated offering expenses payable by us (assuming no exercise of the underwriters’ option to purchase additional shares), and the application of the net proceeds of the offering as set forth in “Use of Proceeds.”
The pro forma and pro forma as adjusted information below is illustrative only, and our capitalization following the completion of this offering will be adjusted based on the actual initial public offering price and other terms of this offering determined at pricing. You should read this table together with our consolidated financial statements and the related notes appearing elsewhere in this prospectus and the sections of this prospectus titled “Organizational Structure,” “Use of Proceeds,” “Unaudited Consolidated Pro Forma Financial Information” and “Management’s Discussion and Analysis of Financial Condition and Results of Operations.”
| | | |
At , 2026
|
| |||||||||||||||
| | | |
Actual
|
| |
Pro
Forma |
| |
Pro Forma
As Adjusted |
| |||||||||
| | | |
(in thousands, except share,
unit, per share and per unit data) |
| |||||||||||||||
|
Cash and cash equivalents
|
| | | $ | | | | | $ | | | | | $ | | | |||
|
Total long-term debt obligations
|
| | | $ | | | | | $ | | | | | $ | | | |||
|
Redeemable convertible Class A Preferred Units (including VB Fee Class A
Preferred Units); no par value; units authorized and units issued and outstanding, actual; no units authorized, issued or outstanding, pro forma; no units authorized, issued or outstanding, pro forma as adjusted |
| | | $ | | | | | $ | — | | | | | $ | — | | | |
|
Redeemable convertible Class B Preferred Units; no par value; units
authorized and units issued and outstanding, actual; no units authorized, issued or outstanding, pro forma; no units authorized, issued or outstanding, pro forma as adjusted |
| | | | | | | | | | — | | | | | | — | | |
|
Redeemable convertible Special Member Unit; no par value; 1 unit authorized, issued and outstanding, actual; no units authorized, issued or outstanding, pro forma; no units authorized issued or outstanding, pro forma as adjusted
|
| | | | | | | | | | — | | | | | | — | | |
|
Common units; no par value; units authorized and units issued and outstanding, actual; no units authorized, issued or outstanding, pro forma; no units authorized issued or outstanding, pro forma as adjusted
|
| | | | | | | | | | — | | | | | | — | | |
|
Incentive Units no par value, units authorized, and units outstanding, actual; no units authorized, issued or outstanding, pro forma; no units authorized issued or outstanding, pro forma as adjusted
|
| | | | | | | | | | — | | | | | | — | | |
110
| | | |
At , 2026
|
| |||||||||||||||
| | | |
Actual
|
| |
Pro
Forma |
| |
Pro Forma
As Adjusted |
| |||||||||
| | | |
(in thousands, except share,
unit, per share and per unit data) |
| |||||||||||||||
|
Members’ deficit, actual; Stockholders’ equity, pro forma and pro forma as
adjusted: |
| | | | | | | | | | | | | | | | | | |
|
Undesignated preferred stock, $0.0001 par value per share; no shares authorized, issued or outstanding, actual; shares authorized, no shares issued and outstanding, pro forma; shares authorized, no shares issued and outstanding, pro forma as adjusted
|
| | | | | | | | | | — | | | | | | — | | |
|
Class A Common stock, $0.0001 par value per share; no shares
authorized, issued and outstanding, actual; shares authorized, shares issued and outstanding, pro forma; shares authorized, shares issued and outstanding, pro forma as adjusted |
| | | | | | | | | | | | | | | | | | |
|
Class B Common stock, $0.0001 par value per share; no shares
authorized, issued and outstanding, actual; shares authorized, shares issued and outstanding, pro forma; shares authorized, shares issued and outstanding, pro forma as adjusted |
| | | | | | | | | | | | | | | | | | |
|
Additional paid-in capital
|
| | | | | | | | | | | | | | | | | | |
|
Accumulated deficit
|
| | | | | | | | | | | | | | | | | | |
|
Accumulated other comprehensive loss
|
| | | | | | | | | | | | | | | | | | |
|
Total members’ deficit, actual; total stockholders’ equity, pro forma
and pro forma as adjusted |
| | | | | | | | | | | | | | | | | | |
|
Total capitalization
|
| | | $ | | | | | $ | | | | | $ | | | |||
| | |||||||||||||||||||
A $1.00 increase (decrease) in the assumed initial public offering price of $ per share (which is the midpoint of the estimated public offering price range set forth on the cover page of this prospectus) would increase (decrease) each of pro forma as adjusted cash and cash equivalents, additional paid-in capital, total stockholders’ equity and total capitalization by approximately $ million, assuming the number of shares of Class A Common Stock offered, as set forth on the cover page of this prospectus, remains the same, and after deducting the estimated underwriting discounts and commissions and estimated offering expenses payable by us. Each 1,000,000 increase (decrease) in the number of shares of Class A Common Stock offered in this offering would increase (decrease) each of pro forma as adjusted cash and cash equivalents, additional paid-in capital, total stockholders’ equity and total capitalization on a pro forma basis by approximately $ million, based on an assumed initial public offering price of $ per share, which is the midpoint of the estimated public offering price range set forth on the cover page of this prospectus, and after deducting the underwriting discount and estimated offering expenses payable by us.
The number of shares of our Class A Common Stock to be outstanding immediately following the completion of this offering excludes:
•
shares of Class A Common Stock issuable upon exercise of the underwriters’ option to purchase additional shares of Class A Common Stock in the offering;
•
shares of Class A Common Stock that may be issuable to the Continuing Equity Owners upon exchange of Series B Common Units that will be held by the Continuing Equity Owners immediately following this offering;
111
•
shares of Class A Common Stock reserved for issuance upon the exercise of the outstanding Assumed Centinel LLC Options granted under the Centinel LLC Incentive Plan, which options we will assume in connection with the Organizational Transactions and which will become exercisable for shares of Class A Common Stock on a -for- basis; and
•
shares of Class A Common Stock that will be reserved for issuance under the Holdco Omnibus Plan, which will become effective in connection with this offering, as well as any future automatic increases in the number of shares of our Class A Common Stock reserved for issuance thereunder.
112
DILUTION
The Continuing Equity Owners will own Series B Common Units and shares of Class B Common Stock after the Organizational Transactions. Because the Continuing Equity Owners will not have any right to receive distributions from Centinel Holdco with regards to their Series B Common Units or Class B Common Stock, we have presented dilution in pro forma net tangible book value per share and pro forma as adjusted net tangible book value per share assuming that all of the holders of Series B Common Units had their Series B Common Units exchanged for newly-issued shares of Class A Common Stock on a one-for-one basis (rather than for cash) and the transfer to Centinel Holdco and cancellation for no consideration of all of their shares of Class B Common Stock (which are not entitled to receive distributions or dividends, whether cash or stock from Centinel Holdco) in order to more meaningfully present the dilutive impact on the investors in this offering. We refer to the assumed exchange of all Series B Common Units for shares of Class A Common Stock as described in the previous sentence as the “Assumed Exchange.”
Dilution is the amount by which the offering price paid by the investors of the Class A Common Stock in this offering exceeds the pro forma as adjusted net tangible book value per share of Class A Common Stock after the offering. Centinel LLC’s net tangible book value (deficit) as of , 2026, was $ million. After giving effect to the Organizational Transactions, other than the offering, our pro forma net tangible book value as of , 2026 was $ million. Pro forma net tangible book value per share is determined by subtracting our total liabilities from the total book value of our tangible assets and dividing the difference by the number of shares of Class A Common Stock deemed to be outstanding after giving effect to the Assumed Exchange. As of , 2026, our pro forma net tangible book value per share was $ .
If you invest in our Class A Common Stock in this offering, your ownership interest in us will be diluted to the extent of the difference between the initial public offering price per share of our Class A Common Stock and the pro forma net tangible book value (deficit) per share of our Class A Common Stock after giving effect to this offering. Dilution results from the fact that the per share offering price of the Class A Common Stock is substantially in excess of the pro forma net tangible book value per share attributable to our existing owners.
Pro forma as adjusted net tangible book value gives further effect to this offering and the application of the proceeds from this offering as described in “Use of Proceeds.” Our pro forma as adjusted net tangible book value as of , 2026, would have been approximately $ million, or $ per share of Class A Common Stock. This amount represents an immediate increase in pro forma net tangible book value of $ per share to our existing shareholders and an immediate dilution in pro forma net tangible book value of approximately $ per share to new investors purchasing shares of Class A Common Stock in this offering.
The following table illustrates this dilution on a per share of Class A Common Stock basis, assuming the underwriters do not exercise their option to purchase additional shares of Class A Common Stock:
| |
Assumed initial public offering price per share of Class A Common Stock
|
| | | | | | | | | $ | | | |
| |
Pro forma net tangible book value (deficit) per share of Class A Common Stock as of , 2026
|
| | | $ | | | | | | | | | |
| |
Increase in pro forma net tangible book value per share of Class A Common Stock to investors in this offering
|
| | | $ | | | | | | | | | |
| |
Pro forma as adjusted net tangible book value per share of Class A Common Stock as of , 2026
|
| | | | | | | | | $ | | | |
| |
Dilution in pro forma net tangible book value per share to investors participating in this
offering |
| | | | | | | | | $ | | | |
A $1.00 increase (decrease) in the assumed initial public offering price of $ per share, which is the midpoint of the price range set forth on the cover page of this prospectus, would increase (decrease) our pro forma as adjusted net tangible book value per (deficit) share by $ and dilution per share to new investors purchasing Class A Common Stock in this offering by $ , assuming that the number of shares offered by us, as set forth on the cover page of this prospectus, remains the same and after deducting the underwriting discounts and commissions and estimated offering expenses payable by us. An increase (decrease)
113
of 1,000,000 shares in the number of shares of Class A Common Stock offered by us, as set forth on the cover page of this prospectus, would increase (decrease) our pro forma as adjusted net tangible book value per share by $ and increase (decrease) the dilution per share to new investors purchasing Class A Common Stock in this offering by $ , assuming no change in the assumed initial public offering price per share and after deducting the underwriting discounts and commissions and estimated offering expenses payable by us.
If the underwriters exercise in full their option to purchase additional shares of Class A Common Stock in this offering, , the increase in pro forma net tangible book value per share to existing shareholders would be $ and the dilution in pro forma net tangible book value per share to new investors purchasing Class A Common Stock in this offering would be $ , after deducting the underwriting discounts and commissions and estimated offering expenses payable by us, assuming an initial public offering price of $ per share (the midpoint of the estimated price range set forth on the cover page of this prospectus).
The following table summarizes as of , 2026, after giving effect to the Organizational Transactions (including this offering) and the Assumed Exchange, the number of shares of Class A Common Stock purchased from us, the total consideration paid and the average price per share paid by the existing stockholders and purchasers in this offering, based upon an assumed initial public offering price of $ per share (the midpoint of the estimated public offering price range set forth on the cover page of this prospectus) and after deducting estimated underwriting discounts and commissions and offering expenses:
| | | |
Shares of Class A
Common Stock Purchased |
| |
Average Price
Per Share |
| | | | |||||||||||||||||||||
| | | |
Number
|
| |
Percent
|
| |
Amount
|
| |
Percent
|
| | | | |||||||||||||||
|
Existing stockholders
|
| | | | | | | | | | % | | | | | $ | | | | | | % | | | | | $ | | | ||
|
New investors
|
| | | | | | | | | | | | | | | | | | | | | | | | | | | | | | |
|
Total
|
| | | | | | | | | % | | | | | $ | | | | | | % | | | | | $ | | | |||
A $1.00 increase (decrease) in the assumed initial public offering price of $ per share, which is the midpoint of the price range set forth on the cover page of this prospectus, would increase (decrease) the total consideration paid by new investors by $ million and, in the case of an increase, would increase the percentage of total consideration paid by new investors by percentage points and, in the case of a decrease, would decrease the percentage of total consideration paid by new investors by percentage points, assuming that the number of shares offered by us, as set forth on the cover page of this prospectus, remains the same. An increase (decrease) of 1,000,000 shares in the number of shares offered by us, as set forth on the cover page of this prospectus, would increase (decrease) the total consideration paid by new investors by $ million and, in the case of an increase, would increase the percentage of total consideration paid by new investors by percentage points and, in the case of a decrease, would decrease the percentage of total consideration paid by new investors by percentage points, assuming no change in the assumed initial public offering price per share.
The table above is based on the number of shares of Class A Common Stock outstanding as of , 2026 and gives effect to the Organizational Transactions, including this offering and the Assumed Exchange. The table above does not include:
•
shares of Class A Common Stock reserved for issuance upon the exercise of the Assumed Centinel LLC Options granted under the Centinel LLC Incentive Plan, which we will assume in connection with the Organizational Transactions and which will become exercisable for shares of Class A Common Stock on a -for- basis; and
•
shares of Class A Common Stock that will be reserved for issuance under the Holdco Omnibus Plan, which will become effective in connection with this offering, as well as any future increases in the number of shares of our Class A Common Stock reserved for issuance thereunder.
To the extent stock options are exercised, new stock options are issued under our equity incentive plan, or if we issue additional shares of Class A Common Stock in the future, there will be further dilution to investors purchasing Class A Common Stock in this offering.
114
UNAUDITED PRO FORMA CONSOLIDATED FINANCIAL INFORMATION
The unaudited pro forma condensed consolidated balance sheet as of June 30, 2026 and the unaudited pro forma condensed consolidated statements of operations for the year ended December 31, 2025 and the six months ended June 30, 2026 present our financial position and results of operations after giving effect to the following pro forma transactions (the “Pro Forma Transactions”):
•
The Organizational Transactions;
•
The effects of the Tax Receivable Agreement, as described under “Certain Relationships and Related Party Transactions—Tax Receivable Agreement;”
•
A provision for corporate income taxes on the income attributable to us at a tax rate of % as of June 30, 2026, inclusive of all U.S. federal, state, local and foreign income taxes; and
•
This offering and the application of the estimated net proceeds from this offering, as described under “Use of Proceeds”; and
The unaudited pro forma consolidated statements of operations for the year ended December 31, 2025 and the six months ended June 30, 2026 give effect to the Pro Forma Transactions as if the Pro Forma Transactions had occurred or had become effective as of January 1, 2025. The unaudited pro forma consolidated balance sheet gives effect to the Pro Forma Transactions as if the Pro Forma Transactions had occurred or had become effective as of June 30, 2026.
Our historical consolidated financial information has been derived from Centinel LLC’s consolidated financial statements and accompanying notes to the consolidated financial statements included elsewhere in this prospectus. Centinel Holdco was formed on April 24, 2026 and will have no material assets or results of operations until the completion of this offering. Therefore, Centinel Holdco’s historical financial information is not included in the unaudited pro forma consolidated financial information.
The unaudited pro forma consolidated financial information has been prepared on the basis that we will be taxed as a corporation for U.S. federal and state income tax purposes and, accordingly, will become a taxpaying entity subject to U.S. federal, state and foreign income taxes. The presentation of the unaudited pro forma consolidated financial information is prepared in conformity with Article 11 of Regulation S-X and is based on currently available information and certain estimates and assumptions. See the accompanying notes to the Unaudited Consolidated Pro Forma Financial Information for a discussion of assumptions made.
The unaudited pro forma consolidated financial information is not necessarily indicative of financial results that would have been attained had the Pro Forma Transactions occurred on the dates indicated above or that could be achieved in the future. The unaudited pro forma consolidated financial information also does not give effect to the potential impact of any anticipated synergies, operating efficiencies or cost savings that may result from the Pro Forma Transactions. Future results may vary significantly from the results reflected in the unaudited pro forma consolidated statement of operations and should not be relied on as an indication of our results after the consummation of this offering and the other transactions contemplated by such unaudited pro forma consolidated financial information. However, management believes that the assumptions provide a reasonable basis for presenting the significant effects of the Pro Forma Transactions as contemplated and that the pro forma adjustments give appropriate effect to those assumptions and are properly applied in the unaudited pro forma consolidated financial information.
As a public company, we will be implementing additional procedures and processes for the purpose of addressing the standards and requirements applicable to public companies. We expect to incur additional annual expenses related to these steps and, among other things, additional directors’ and officers’ liability insurance, director fees, fees to comply with the reporting requirements of the SEC, transfer agent fees, hiring of additional accounting, legal and administrative personnel, increased auditing and legal fees and similar expenses. We have not included any pro forma adjustments relating to these costs.
For purposes of the unaudited pro forma consolidated financial information, we have assumed that we will issue shares of Class A Common Stock at a price of $ per share, which is the midpoint of the estimated public offering price range set forth on the cover page of this prospectus, and, as a result, immediately following the completion of this offering, the ownership percentage represented by LLC Units
115
not held by us will be %, and the net income attributable to LLC Units not held by us will accordingly represent % of our net income or loss. Except as otherwise indicated, the unaudited pro forma consolidated financial information presented assumes no exercise by the underwriters of their option to purchase additional shares of Class A Common Stock.
As described in greater detail under “Certain Relationships and Related Party Transactions—Tax Receivable Agreement,” in connection with the consummation of this offering, we will enter into a Tax Receivable Agreement with Centinel LLC, the Continuing Equity Owners and Blocker Stockholders that will require us to pay such persons 85% of certain tax savings (calculated using certain assumptions), if any, in U.S. federal, state and local income taxes we actually realize (or under certain circumstances are deemed to realize) as a result of (i) certain increases in the tax basis of assets of Centinel LLC and its subsidiaries resulting from purchases or exchanges of Series B Common Units, (ii) certain other tax attributes of Centinel LLC and its subsidiaries and the Blocker Companies that existed prior to this offering, including existing tax basis and our allocable share of existing tax basis acquired in connection with this offering and increases to such allocable share of existing tax basis and (iii) certain other tax benefits related to our entering into the Tax Receivable Agreement, including tax benefits attributable to payments that we make under the Tax Receivable Agreement.
We retain the remaining 15% of cash savings, if any. If the Tax Receivable Agreement terminates early, we could be required to make a substantial, immediate lump-sum payment. As a result of the Organizational Transactions and this offering, we estimate a liability under the Tax Receivable Agreement of $ million, primarily related to the portion of existing tax benefits that are probable of payment to the TRA Parties pursuant to the terms of the Tax Receivable Agreement as a result of the Pro Forma Transactions. For purposes of the pro forma financial information, we also include an estimate of the deferred tax asset, which is expected to reflect the outside basis difference related to the difference between the book and tax basis in the investment in Centinel LLC. The deferred tax assets and TRA liability do not give effect to future exchanges of Series B Common Units because such timing is uncertain.
However, if all of the Continuing Equity Owners were to exchange or sell us all of their remaining Series B Common Units, we would recognize a deferred tax asset of approximately $ million and a liability under the Tax Receivable Agreement of approximately $ million, assuming: (i) all exchanges or purchases occurred on the same day; (ii) a price of $ per share; (iii) a corporate tax rate of %; (iv) that we will have sufficient taxable income to fully utilize the tax benefits and (v) no material changes in tax law. These amounts are estimates and have been prepared for informational purposes only. The actual amount of deferred tax assets and related liabilities that we will recognize will differ based on, among other things, the timing of the exchanges, the price per share of our Class A Common Stock at the time of the exchange, and the tax rates then in effect.
The unaudited pro forma consolidated financial information should be read together with “Organizational Structure,” “ Use of Proceeds,” “Capitalization,” “Management’s Discussion and Analysis of Financial Condition and Results of Operations,” “Certain Relationships and Related Party Transactions,” and the audited annual consolidated financial statements of Centinel LLC and related notes thereto which are included elsewhere in this prospectus.
116
Unaudited Pro Forma Consolidated Balance Sheet as of June 30, 2026
|
As of June 30, 2026
(thousands, except per share data) |
| |
Historical
Centinel LLC |
| |
Pro Forma
Organizational Transactions Adjustments Before Offering |
| |
As
Adjusted Before Offering |
| |
Pro Forma
Offering Adjustments |
| |
Centinel
Holdco Pro Forma |
| |||||||||||||||
| | | |
(in thousands, except per unit and share information)
|
| |||||||||||||||||||||||||||
| Assets | | | | | | | | | | | | | | | | | | | | | | | | | | | | | | | |
| Current assets: | | | | | | | | | | | | | | | | | | | | | | | | | | | | | | | |
|
Cash and cash equivalents
|
| | | $ | 25,106 | | | | | $ | | | | | $ | | | | | $ | (1) | | | | | $ | | | |||
|
Accounts receivable, net of allowance for doubtful accounts of $1,162 for 2026
|
| | | | 30,281 | | | | | | | | | | | | | | | | | | | | | | | | | | |
|
Inventory, net
|
| | | | 22,250 | | | | | | | | | | | | | | | | | | | | | | | | | | |
|
Prepaid expenses and other current assets
|
| | | | 2,126 | | | | | | | | | | | | | | | | | | | | | | | | | | |
|
Total current assets
|
| | | | 79,763 | | | | | | | | | | | | | | | | | | | | | | | | | | |
| Non-current assets: | | | | | | | | | | | | | | | | | | | | | | | | | | | | | | | |
|
Property and equipment, net of accumulated
depreciation of $26,117 |
| | | | 8,909 | | | | | | | | | | | | | | | | | | | | | | | | | | |
|
Right of use asset
|
| | | | 457 | | | | | | | | | | | | | | | | | | | | | | | | | | |
|
Goodwill
|
| | | | 18,434 | | | | | | | | | | | | | | | | | | | | | | | | | | |
|
Deferred tax assets(2)(3)
|
| | | | — | | | | | | | | | | | | | | | | | | | | | | | | | | |
|
Intangible assets, net
|
| | | | 5,264 | | | | | | | | | | | | | | | | | | | | | | | | | | |
|
Other long-term assets
|
| | | | 2,402 | | | | | | | | | | | | | | | | |
|
(4)
|
| | | | | | | |
|
Total assets
|
| | | $ | 115,229 | | | | | $ | | | | | | $ | | | | | | $ | | | | | | $ | | | |
|
LIABILITIES, REDEEMABLE CONVERTIBLE PREFFERED UNITS AND MEMBERS’ DEFICIT
|
| | | | | | | | | | | | | | | | | | | | | | | | | | | | | | |
| Current liabilities: | | | | | | | | | | | | | | | | | | | | | | | | | | | | | | | |
|
Accounts payable
|
| | | $ | 10,630 | | | | | $ | | | | | | $ | | | | | | $ | | | | | | $ | | | |
|
Accrued expenses
|
| | | | 15,288 | | | | | | | | | | | | | | | | |
|
(1)
|
| | | | | | | |
|
Due to related parties
|
| | | | 16 | | | | | | | | | | | | | | | | | | | | | | | | | | |
|
Current portion of lease liabilities
|
| | | | 422 | | | | | | | | | | | | | | | | | | | | | | | | | | |
|
Current portion of note payable, net
|
| | | | — | | | | | | | | | | | | | | | | | | | | | | | | | | |
|
Total current liabilities
|
| | | | 26,356 | | | | | | | | | | | | | | | | | | | | | | | | | | |
| Non-current liabilities: | | | | | | | | | | | | | | | | | | | | | | | | | | | | | | | |
|
Warrant and derivative liabilities
|
| | | | 6,523 | | | | | | | | | | | | | | | | | | | | | | | | | | |
|
Lease liabilities, net of current potion
|
| | | | 35 | | | | | | | | | | | | | | | | | | | | | | | | | | |
|
Deferred tax liability
|
| | | | 1,642 | | | | | | | | | | | | | | | | | | | | | | | | | | |
|
TRA liability(3)
|
| | | | — | | | | | | | | | | | | | | | | | | | | | | | | | | |
|
Note payable, net
|
| | | | 59,740 | | | | | | | | | | | | | | | | | | | | | | | | | | |
|
Convertible notes payable, net
|
| | | | 62,139 | | | | | | | | | | | | | | | | | | | | | | | | | | |
|
Term notes payable, net
|
| | | | 12,498 | | | | | | | | | | | | | | | | | | | | | | | | | | |
|
Total liabilities
|
| | | | 168,933 | | | | | | | | | | | | | | | | | | | | | | | | | | |
117
|
As of June 30, 2026
(thousands, except per share data) |
| |
Historical
Centinel LLC |
| |
Pro Forma
Organizational Transactions Adjustments Before Offering |
| |
As
Adjusted Before Offering |
| |
Pro Forma
Offering Adjustments |
| |
Centinel
Holdco Pro Forma |
| |||||||||||||||
| | | |
(in thousands, except per unit and share information)
|
| |||||||||||||||||||||||||||
|
Redeemable Convertible Class A Preferred Units; no par value, 66,518,221 units authorized as of June 30, 2026, 63,290,921 units outstanding as of June 30, 2026 and accumulated liquidation value of $88,250 as of June 30, 2026
|
| | | | 83,019 | | | | |
|
(5)
|
| | | | | | | | | | | | | | | | | | | |
|
Redeemable Convertible Class B Preferred Units; no par value, 49,103,261 units authorized as of June 30, 2026, 36,194,017 units outstanding as of June 30, 2026, and accumulated liquidation value of $50,467 as of June 30, 2026
|
| | | | 50,406 | | | | |
|
(5)
|
| | | | | | | | | | | | | | | | | | | |
|
Redeemable Convertible Special Member Unit;
no par value, 1 unit authorized and outstanding as of June 30, 2026, and accumulated liquidation value of $112,487 as of June 30, 2026 |
| | | | — | | | | |
|
(5)
|
| | | | | | | | | | | | | | | | | | | |
| Members’ deficit: | | | | | | | | | | | | | | | | | | | | | | | | | | | | | | | |
|
Common Units no par value, 150,924,548 units authorized as of June 30, 2026, and 32,037,413 units outstanding as of June 30, 2026
|
| | | | — | | | | | | | | | | | | | | | | |
|
(6)
|
| | | | | | | |
|
Incentive Units no par value, 17,480,254 units authorized as of June 30, 2026, and 1,447,987 units outstanding as of June 30, 2026
|
| | | | — | | | | |
|
(5)
|
| | | | | | | | | | | | | | | | | | | |
|
Additional paid-in capital(6)
|
| | | | 4,002 | | | | | | | | | | | | | | | | |
|
(4)
|
| | | | | | | |
|
Accumulated deficit
|
| | | | (188,445) | | | | | | | | | | | | | | | | | | | | | | | | | | |
|
Accumulated other comprehensive loss
|
| | | | (2,686) | | | | | | | | | | | | | | | | | | | | | | | | | | |
|
Total members’ deficit
|
| | | | (187,129) | | | | | | | | | | | | | | | | | | | | | | | | | | |
|
Non-controlling interests(5)
|
| | | | — | | | | | | | | | | | | | | | | | | | | | | | | | | |
|
Total liabilities, redeemable convertible preferred units and members’ deficit
|
| | | $ | 115,229 | | | | | $ | | | | | | $ | | | | | | $ | | | | | | $ | | | |
| | |||||||||||||||||||||||||||||||
See accompanying notes to unaudited pro forma consolidated balance sheet.
118
Notes to Unaudited Pro Forma Consolidated Balance Sheet
(1)
Reflects the net effect on cash of the receipt of offering proceeds to us of $ , based on the sale of shares of Class A common stock at an assumed initial public offering price of $ per share of Class A common stock (the midpoint of the price range set forth on the cover of this prospectus), after deducting the estimated underwriting discounts and commissions and estimated offering expenses payable by us. We will use approximately $ million of the net proceeds from this offering to purchase newly-issued Series A Common Units in Centinel LLC from Centinel LLC, as described under the section titled “Organizational Structure—Organizational Transactions.” The Series A Common Units will be purchased by us at a purchase price per unit equal to the initial public offering price per share of Class A Common Stock in this offering, less underwriting discounts and commissions.
(2)
As described in greater detail under “Organizational Structure” and “Certain Relationships and Related Party Transactions—Tax Receivable Agreement,” in connection with the completion of this offering, we will enter into the Tax Receivable Agreement with Centinel LLC, Continuing Equity Owners and Blocker Stockholders that provides for the payment by Centinel Holdco to such Continuing Equity Owners and Blocker Stockholders of 85% of certain tax benefits, if any, that Centinel Holdco actually realizes, or is deemed to realize (calculated using certain assumptions), as a result of (i) Centinel Holdco’s allocable share of existing tax basis in Centinel LLC’s assets acquired in this offering, (ii) increases in Centinel Holdco’s allocable share of existing tax basis and tax basis adjustments to the tangible and intangible assets of Centinel LLC as a result of sales or exchanges of Series B Common Units in connection with or after this offering, (iii) Centinel Holdco’s utilization of certain tax attributes (including any existing tax basis) of the Blocker Companies, which Centinel Holdco acquires in connection with this offering, and (iv) certain other tax benefits related to our entering into the Tax Receivable Agreement, including tax benefits attributable to payments under the Tax Receivable Agreement.
(3)
For purposes of the pro forma financial information, we include an estimate of the deferred tax asset, which is expected to reflect the outside basis difference related to the difference between the book and tax basis in the investment in Centinel LLC. We also reflect an estimate of the liability under the Tax Receivable Agreement, primarily related to the portion of existing tax benefits that are probable of payment to the TRA Parties pursuant to the terms of the Tax Receivable Agreement as a result of the Pro Forma Transactions. The deferred tax assets and TRA liability do not give effect to future exchanges of Series B Common Units because such timing is uncertain. These amounts are estimates and have been prepared for informational purposes only. The actual amount of deferred tax assets and related liabilities that we will recognize will differ based on, among other things, the timing of the exchanges, the price per share of our Class A Common Stock at the time of the exchange, and the tax rates then in effect.
We will hold an economic interest of % in Centinel LLC subsequent to the Organizational Transaction and this offering. The % interest that we do not own represents a non-controlling interest for financial reporting purposes. Centinel LLC has been and will continue to be treated as a partnership for U.S. federal and state income tax purposes. Following the Organizational Transactions, Centinel Holdco will be subject to U.S. federal income taxes, in addition to state and local taxes, with respect to our allocable share of any net taxable income generated by Centinel LLC.
(4)
Reflects deferred costs associated with this offering, including certain legal, accounting and other related costs, which have been recorded in other long-term assets on the consolidated balance sheet. Upon completion of this offering, these deferred costs will be charged against the proceeds from this offering with a corresponding reduction to additional paid-in capital.
(5)
Upon completion of the Organizational Transactions, we will become the managing member of Centinel LLC. Although we will have a minority economic interest in Centinel LLC, we will have the majority voting interest in, and control of the management of, Centinel LLC. As a result, we will consolidate the financial results of Centinel LLC and will report non-controlling interests related to the interests in Centinel LLC held by the continuing members on our consolidated balance sheet. Immediately following the Organizational Transactions, the economic interests held by the non-controlling interests will be approximately %. If the underwriters were to exercise their option to purchase additional shares of our Class A Common Stock in full, the economic interests held by the non-controlling interests would be approximately %. Through their ownership of shares of Class B Common Stock, the Class B stockholders will control a majority of the voting power of the common stock of Centinel Holdco, the managing member of Centinel LLC, and will therefore have indirect control over Centinel LLC.
We have determined that the non-controlling interest should be classified as permanent equity. This is primarily due to the fact that, in accordance with the Exchange Agreement, we will have the option to settle any exchange of Series B Common Units, together with a corresponding number of shares of Class B Common Stock, in cash or shares of Class A Common Stock, provided, however, that any cash settlement will be limited to the cash proceeds to be received from a substantially concurrent new permanent equity offering of Class A Common Stock.
(6)
The components of increase to additional paid-in capital as a result of the amounts allocable to Centinel Holdco from net proceeds of this offering are set forth below:
| | | |
Pro Forma
Organizational Transactions Adjustments Before Offering |
| |
Pro Forma
Offering Adjustments |
| |
Centinel
Holdco Pro Forma |
| |||||||||
|
Reclassification of members’ equity and convertible preferred units
|
| | | $ | | | | | $ | | | | | $ | | | |||
|
Proceeds from offering net of underwriting discounts
|
| | | | | | | | | | | | | | | | | | |
|
Payment of estimated offering costs
|
| | | | | | | | | | | | | | | | | | |
|
Transaction costs incurred prior to this offering deferred as prepaid expenses and other current assets(4)
|
| | | | | | | | | | | | | | | | | | |
|
Par value of Class A common stock
|
| | | | | | | | | | | | | | | | | | |
|
Par value of Class B common stock
|
| | | | | | | | | | | | | | | | | | |
|
Non-controlling interests
|
| | | | | | | | | | | | | | | | | | |
|
Additional paid-in capital
|
| | | $ | | | | | $ | | | | | $ | | | | ||
119
Unaudited Pro Forma Consolidated Statement of Operations and Comprehensive Income (Loss) for the Year Ended December 31, 2025
|
Year Ended December 31, 2025
(thousands, except per share data) |
| |
Historical Centinel
LLC |
| |
Pro Forma Offering
Adjustments |
| |
Centinel Holdco
Pro Forma |
| |||||||||
|
Net revenue
|
| | | $ | 132,163 | | | | | $ | | | | | | $ | | | |
|
Cost of sales
|
| | | | 26,143 | | | | | | | | | | | | | | |
|
Gross profit
|
| | | | 106,020 | | | | | | | | | | | | | ||
| Operating expenses: | | | | | | | | | | | | | | | | | | | |
|
Selling and marketing
|
| | | | 67,497 | | | | | | | | | | | | | | |
|
General and administrative
|
| | | | 19,157 | | | | | | | | | | | | | | |
|
Research and development
|
| | | | 3,660 | | | | | | | | | | | | | ||
|
Total operating expenses
|
| | | | 90,314 | | | | | | | | | | | | | ||
|
Operating income
|
| | | | 15,706 | | | | | | | | | | | | | ||
| Other income (expense): | | | | | | | | | | | | | | | | | | | |
|
Other expense, net
|
| | | | (9,359) | | | | | | | | | | | | | | |
|
Foreign currency gain (loss)
|
| | | | 4,089 | | | | | | | | | | | | | | |
|
Interest expense
|
| | | | (11,070) | | | | | | | | | | | | | | |
|
Loss in extinguishment of debt
|
| | | | (3,458) | | | | | | | | | | | | | ||
|
Total other expense, net
|
| | | | (19,798) | | | | | | | | | | | | | ||
|
Net loss before taxes
|
| | | | (4,092) | | | | | | | | | | | | | | |
|
Income tax expense
|
| | | | 229 | | | | |
|
(1)
|
| | | | | | | |
|
Net loss
|
| | | | (4,321) | | | | | | | | | | | | | | |
|
Net income (loss) attributable to noncontrolling interests
|
| | | | — | | | | |
|
(2)
|
| | | | | | | |
|
Net income (loss) attributable to Centinel Holdco.
|
| | | | (4,321) | | | | | | | | | | | | | | |
| Other comprehensive loss: | | | | | | | | | | | | | | | | | | | |
|
Foreign currency translation
|
| | | | (1,474) | | | | | | | | | | | | | ||
|
Comprehensive Loss
|
| | | $ | (5,795) | | | | | $ | | | | | $ | | | ||
| Pro Forma Loss Per Share | | | | | | | | | | | | | | | | | | | |
|
Basic
|
| | | | | | | | |
|
(3)
|
| | | | | | | |
|
Diluted
|
| | | | | | | | |
|
(3)
|
| | | | | | | |
|
Pro Forma Number of Shares Used in Computing Loss Per Share
|
| | | | | | | | | | | | | | | | | | |
|
Basic
|
| | | | | | | | |
|
(3)
|
| | | | | | | |
|
Diluted
|
| | | | | | | | |
|
(3)
|
| | | | | | | |
See accompanying notes to unaudited pro forma consolidated statement of operations and
comprehensive income (loss).
comprehensive income (loss).
120
Unaudited Pro Forma Consolidated Statement of Operations and Comprehensive Income (Loss) for the
Six Months Ended June 30, 2026
Six Months Ended June 30, 2026
|
Six Months Ended June 30, 2026
(thousands, except per share data) |
| |
Historical Centinel
LLC |
| |
Pro Forma Offering
Adjustments |
| |
Centinel Holdco
Pro Forma |
| |||||||||
|
Net revenue
|
| | | $ | 85,244 | | | | | $ | | | | | | $ | | | |
|
Cost of sales
|
| | | | 15,159 | | | | | | | | | | | | | | |
|
Gross profit
|
| | | | 70,085 | | | | | | | | | | | | | ||
| Operating expenses: | | | | | |||||||||||||||
|
Selling and marketing
|
| | | | 42,151 | | | | | | | | | | | | | | |
|
General and administrative
|
| | | | 12,092 | | | | | | | | | | | | | | |
|
Research and development
|
| | | | 2,818 | | | | | | | | | | | | | | |
|
Total operating expenses
|
| | | | 57,061 | | | | | | | | | | | | | | |
|
Operating income
|
| | | | 13,024 | | | | | | | | | | | | | | |
| Other income (expense): | | | | | |||||||||||||||
|
Other income (expense), net
|
| | | | 3,885 | | | | | | | | | | | | | | |
|
Foreign currency gain (loss)
|
| | | | (1,058) | | | | | | | | | | | | | | |
|
Interest expense
|
| | | | (5,507) | | | | | | | | | | | | | | |
|
Loss in extinguishment of debt
|
| | | | — | | | | | | | | | | | | | | |
|
Total other income (expense), net
|
| | | | (2,680) | | | | | | | | | | | | | | |
|
Net income before taxes
|
| | | | 10,344 | | | | | | | | | | | | | | |
|
Income tax expense
|
| | | | 108 | | | | |
|
(1)
|
| | | | | | | |
|
Net income
|
| | | | 10,236 | | | | | | | | | | | | | | |
|
Net income (loss) attributable to noncontrolling interests
|
| | | | — | | | | |
|
(2)
|
| | | | | | | |
|
Net income (loss) attributable to Centinel Holdco.
|
| | | | 10,236 | | | | | ||||||||||
| Other comprehensive income: | | | | | | | | | | | | | | | |||||
|
Foreign currency translation
|
| | | | 396 | | | | | | | | | | | | | | |
|
Comprehensive income
|
| | | $ | 10,632 | | | | | $ | | | | | | $ | | | |
| Pro Forma Loss Per Share | | | | | | | | | | | | | | | | | | | |
|
Basic
|
| | | | | | | | |
|
(3)
|
| | | | | | | |
|
Diluted
|
| | | | | | | | |
|
(3)
|
| | | | | | | |
|
Pro Forma Number of Shares Used in Computing Loss Per Share
|
| | | | | | | | | | | | | | | | | | |
|
Basic
|
| | | | | | | | |
|
(3)
|
| | | | | | | |
|
Diluted
|
| | | | | | | | |
|
(3)
|
| | | | | | | |
See accompanying notes to unaudited pro forma consolidated statement of operations and
comprehensive income (loss).
comprehensive income (loss).
121
Notes To Unaudited Pro Forma Consolidated Statement of Operations and Comprehensive Income (Loss)
(1)
In 2025, Centinel LLC financial statements included a tax provision of $ million attributable to minimal state and foreign taxes and federal and state taxes of a regarded corporation that is entirely owned as of December 31, 2025. For the six months ended June 30, 2026, Centinel LLC financial statements included a tax provision of $ million attributable to minimal state and foreign taxes and federal and state taxes of a regarded corporation that is entirely owned as of June 30, 2026. Following the Organizational Transactions, Centinel Holdco. will be subject to U.S. federal, state and local income taxes with respect to its allocable share of taxable income generated by Centinel LLC. As a result, the unaudited pro forma condensed consolidated statement of operations reflects adjustments to record Centinel Holdco’s. income tax expense attributable to its allocable share of income, at a blended U.S. federal and state statutory tax rate of %, resulting in a pro forma adjustment of $ million to reflect total tax expense of $ million.
(2)
Following the Organizational Transactions, Centinel Holdco. will become the sole managing member of Centinel LLC, and upon consummation of this offering, Centinel Holdco. will initially own approximately % of the economic interest in Centinel LLC but will have 100% of the voting power and control the management of Centinel LLC. The ownership percentage held by the noncontrolling interest, the Continuing Equity Owners, will be approximately %. Net income attributable to the noncontrolling interest will represent approximately % of net income.
(3)
The weighted average number of shares underlying the basic earnings per share calculation reflects only the shares of Class A common stock outstanding after the offering as they are the only outstanding shares which participate in distributions or dividends by Centinel Holdco. The net proceeds from the sale of shares of Class A common stock in this offering will be used to (i) acquire newly-issued Series A Common Units directly from Centinel LLC and, (ii) pay our Principal Stockholder $ million as consideration for the Blocker Merger. Pro forma diluted earnings per share is computed by adjusting pro forma net income attributable to Centinel Holdco. and the weighted average shares of Class A common stock outstanding to give effect to potentially dilutive securities that qualify as participating securities using the treasury stock method, as applicable. Shares of Class B common stock are not participating securities and therefore are not included in the calculation of pro forma basic earnings per share. LLC Units, together with an equal number of shares of Class B common stock, may be exchanged, at our option, for shares of our Class A common stock or for cash. After evaluating the potential dilutive effect under the if-converted method, the outstanding LLC Units for the assumed exchange of noncontrolling interests were determined to be antidilutive and thus were excluded in the computation of diluted earnings per share. The following table sets forth a reconciliation of the numerators and denominators used to compute pro forma basic and diluted earnings per share.
| | | |
Twelve months
ended December 31, 2025 |
| |||
| Earnings (loss) per share of common stock | | | | | | | |
| Numerator: | | | | | | | |
|
Net income (loss) attributable to Centinel Holdco’s stockholders (basic and diluted)
|
| | | $ | | | |
| Denominator: | | | | | | | |
|
Weighted average of shares of common stock outstanding (basic)
|
| | | | | | |
|
Incremental common shares attributable to dilutive instruments
|
| | | | | | |
|
Weighted average of shares of common stock outstanding (diluted)
|
| | | | | | |
|
Basic earnings (loss) per share
|
| | | $ | | | |
|
Diluted earnings (loss) per share
|
| | | $ | | | |
| | | |
Six months
ended June 30, 2026 |
| |||
| Earnings (loss) per share of common stock | | | | | | | |
| Numerator: | | | | | | | |
|
Net income (loss) attributable to Centinel Holdco’s stockholders (basic and diluted)
|
| | | $ | | | |
| Denominator: | | | | | | | |
|
Weighted average of shares of common stock outstanding (basic)
|
| | | | | | |
|
Incremental common shares attributable to dilutive instruments
|
| | | | | | |
|
Weighted average of shares of common stock outstanding (diluted)
|
| | | | | | |
|
Basic earnings (loss) per share
|
| | | $ | | | |
|
Diluted earnings (loss) per share
|
| | | $ | | | |
122
MANAGEMENT’S DISCUSSION AND ANALYSIS OF FINANCIAL CONDITION AND RESULTS OF OPERATIONS
The following discussion should be read in conjunction with our financial statements and the related notes included elsewhere in this prospectus. In addition to historical information, this discussion contains forward-looking statements that involve risks, uncertainties and assumptions that could cause actual results to differ materially from management’s expectations. See the section titled “Special Note Regarding Forward-Looking Statements.” Factors that could cause or contribute to such differences include, but are not limited to, those discussed in the section titled “Risk Factors.” Our historical results are not necessarily indicative of the results that may be expected for any period in the future. We are not undertaking any obligation to update any forward-looking statements or other statements we may make in the following discussion or elsewhere in this prospectus even though these statements may be affected by events or circumstances occurring after the forward-looking statements or other statements were made. The following discussion does not give effect to the Organizational Transactions. See “Organizational Structure” included elsewhere in this prospectus for a description of the Organizational Transactions and their effect on our historical results of operations.
Overview
We are a commercial-stage medical technology company with a singular mission to transform spine surgery by advancing motion-preserving solutions for the cervical and lumbar spine. We are exclusively focused on total disc replacement (“TDR”), which we believe represents a fundamentally different and increasingly important approach to spine surgery compared to traditional fusion techniques that permanently eliminate motion. Our prodisc platform is designed to improve the long-term quality of life for patients suffering from chronic neck and back pain while preserving the spine’s natural movement. As a pure-play company dedicated solely to TDR, we believe our depth of experience, exclusive focus, and long history of clinical success uniquely position us to lead the continued evolution of spine surgery toward solutions designed to preserve motion.
The surgical treatment of degenerative disc disease (“DDD”) presents a significant and expanding opportunity within the global spine market. Our initial market focus is on patients who can be most effectively treated by our TDR technologies. We have established a scaled commercial organization dedicated exclusively to TDR, with broad reach across the United States and selected international markets. In the United States, our commercial organization includes 48 sales management and clinical support professionals as of June 30, 2026, supported by more than 400 distributors, enabling engagement with the over 1,500 surgeons that performed a TDR procedure with prodisc in 2025. Internationally, we operate in 35 countries as of June 30, 2026, supported by 11 direct commercial employees and a network of distributors. Our commercial infrastructure is complemented by structured surgeon education programs and targeted direct-to-patient initiatives designed to reduce adoption barriers, expand appropriate patient selection, and support increased utilization across both cervical and lumbar applications.
We rely on third-party contract manufacturers, some of which are single source, to produce and package our products pursuant to multi-year supply agreements. We believe this outsourcing strategy provides the necessary expertise and capacity for a capital efficient business model. We work closely with each manufacturing partner and provide demand forecasts to support capacity planning and production scheduling, to manage our single-source supplier risk. We generally seek to maintain sufficient supply levels to help mitigate any supply interruptions and enable us to find and qualify another source of supply. For certain products, we estimate that it could take up to 24 months to find and qualify a second source. See “Risk Factors—Risks Related to Our Business and Industry—We depend on third-party contract manufacturers, some of which are single source, to produce and package our products, and if these manufacturers fail to supply us with our products in sufficient quantities or at all, or in accordance with applicable regulatory requirements and our specifications, it will have a material adverse effect on our business, financial condition, and results of operations.”
We have experienced significant growth in recent years as adoption and utilization of prodisc has accelerated. For the six months ended June 30, 2026, we generated net revenue of $85.2 million, representing growth of 42% compared to the six months ended June 30, 2025. We recognized gross margin of 82% for the six months ended June 30, 2026, compared to a gross margin of 80% for the six months ended June 30, 2025. We had net income of $10.2 million for the six months ended June 30, 2026 compared to net loss of $0.5 million for the six months ended June 30, 2025. We also achieved Adjusted EBITDA of $15.5 million for the six months ended
123
June 30, 2026, representing an increase of 137% compared to $6.6 million for the six months ended June 30, 2025. For the year ended December 31, 2025, we generated net revenue of $132.2 million, representing growth of 39% compared to 2024. We recognized gross margin of 80% for the year ended December 31, 2025, compared to a gross margin of 77% for the year ended December 31, 2024. We had net loss of $4.3 million for the year ended December 31, 2025 compared to net loss of $12.1 million for the year ended December 31, 2024. We also achieved Adjusted EBITDA of $20.2 million for the year ended December 31, 2025, representing an increase of 241% compared to $5.9 million for the year ended December 31, 2024. Adjusted EBITDA is not a financial measure under GAAP. See the subsection titled “—Non-GAAP Financial Measures” below for an explanation of how we compute this non-GAAP financial measure and for the reconciliation to the most directly comparable GAAP financial measure.
Our primary sources of capital have been private placements of our securities, debt financing agreements and net revenue from the sale of our products. Since inception, we have raised a total of $133.4 million in net proceeds from private placements of our convertible preferred stock. As of June 30, 2026, we had cash and cash equivalents of $25.1 million, an accumulated deficit of $188.4 million, and $136.1 million of the aggregate amount outstanding under our debt financing agreements.
Key Factors Affecting Our Results of Operations
We believe the following important factors have impacted and will continue to impact our results of operations for the foreseeable future. While these factors may present significant opportunities for us, they also pose risks and challenges that we must address, as well as those described in the section titled “Risk Factors.”
Market awareness and adoption. The growth of our business depends on increasing surgeon awareness of, adoption of, and utilization of TDR using prodisc. While many spine surgeons treat patients with DDD, a significant portion perform TDR procedures infrequently or not at all. As a result, our revenue growth is influenced by our ability to educate surgeons, expand comfort with patient selection and procedural execution, and support increased procedural activity over time. To support deeper adoption, we intend to continue investing in targeted education and clinical support initiatives focused on patient selection, identification of appropriate use cases, and expansion of utilization across cervical and lumbar applications. The pace at which surgeons adopt TDR, progress along the utilization curve, and expanded use across cervical and lumbar indications will materially impact procedure volumes and our results of operations. We evaluate the success of our market awareness and market adoption by the growing number of surgeons who perform TDR with prodisc, as well as the increasing utilization of prodisc among these surgeons. The chart below shows the number of active surgeons in the United States, which we define as any surgeon who performed at least one TDR procedure with prodisc in the preceding four quarters, as well as high volume users of prodisc. We define high volume users as active surgeons who performed twelve or more TDR procedures with prodisc over the prior four quarters, which we believe is indicative of deeper platform adoption within a surgeon’s clinical practice.
124
Expansion and Effectiveness of Our Commercial Organization. Our financial performance depends in part on the effectiveness and scalability of our U.S. commercial organization and distributor network. As adoption of prodisc expands, we continue to invest in sales leadership, field coverage, clinical and technical support, distributor alignment, and instrument set availability to maintain consistent execution and high service levels. These investments are intended to support surgeon engagement and increasing procedure volumes; however, they may increase operating expenses in the near term. Our results of operations will be influenced by our ability to scale our commercial infrastructure efficiently, optimize distributor performance, and allocate resources toward the highest-impact markets and surgeon relationships.
Continued investments in product development, innovation and growth. We continue to invest in research and development to enhance our product portfolio, improve procedural efficiency, expand clinical evidence, and pursue additional indications. These efforts are intended to broaden the addressable patient population, reinforce surgeon confidence, and support long-term adoption of TDR. Research and development and regulatory initiatives require significant time and capital, and may adversely affect operating results in the near term; however, we believe these investments are critical to sustaining growth and maintaining our competitive position.
Seasonality. Sales of our products may fluctuate on a seasonal basis, which affects the comparability of our results between periods. We have experienced and expect to continue to experience seasonality in our business. For example, we have traditionally experienced lower sales volumes in the months in and surrounding summer vacation and winter holiday periods as elective procedures generally decline during the summer months due to warmer weather and its corresponding impact on individual lifestyles, as well as during winter holidays for the international business. We expect these seasonal factors to become more pronounced in the future as our business grows.
Organizational Transactions
Centinel Holdco was incorporated in Delaware and formed for the purpose of this offering and has engaged to date only in activities in contemplation of this offering. Centinel Holdco will be a holding company and will have no material assets other than its ownership of equity interests in Centinel LLC. For more information regarding our reorganization and holding company structure, see “Organizational Structure.” Upon completion of this offering, all of our business will be conducted through Centinel LLC and its consolidated subsidiaries, and the financial results of Centinel LLC and its consolidated subsidiaries will be included in the consolidated financial statements of Centinel Holdco.
Centinel LLC is a U.S. limited liability company classified as a partnership for U.S. federal income tax purposes, and as such it is generally not a taxable entity in the U.S. and in many state jurisdictions. Accordingly,
125
the members generally include the profits and losses of Centinel Spine, LLC in their respective U.S. federal income tax returns. In addition, certain subsidiaries of Centinel Spine, LLC are treated as disregarded entities for U.S. federal income tax purposes, and therefore, the profits and losses of Centinel Spine, LLC includes the profits and losses of such subsidiaries. Finally, one of the subsidiaries of Centinel LLC is a “controlled foreign corporation” for U.S. federal income tax purposes, and therefore, certain of the members of Centinel LLC may include certain earnings of that subsidiary under applicable U.S. federal income tax laws. Centinel LLC is subject to state income taxes imposed directly on partnerships in certain state jurisdictions and Centinel LLC’s foreign subsidiaries are subject to corporate income taxes in their respective country of organization.
Centinel Holdco will be subject to U.S. federal, state and local income taxes at the prevailing corporate tax rates with respect to our taxable income. After the consummation of this offering, Centinel LLC will continue to be treated as a pass-through entity for U.S. federal income tax purposes, and certain subsidiaries will continue to be taxed in the same manner as they were prior to the consummation of this offering. As a result of its ownership of Series A Common Units in Centinel LLC, Centinel Holdco will become subject to U.S. federal, state and local income taxes with respect to its allocable share of any taxable income of Centinel LLC (including any profits and losses of any subsidiaries of Centinel LLC and including its share of earnings of any controlled foreign corporation directly or indirectly held by Centinel LLC) and will be taxed at the prevailing corporate tax rates.
In addition to tax expenses, we also will incur expenses related to our operations and we will be required to make payments under the Tax Receivable Agreement to the Continuing Equity Owners and the Blocker Stockholders. We expect that payments that we may make under the Tax Receivable Agreement will be substantial. In connection with the consummation of this offering, we will enter into a Tax Receivable Agreement with Centinel LLC, Continuing Equity Owners and the Blocker Stockholders that provides for the payment by us to such Continuing Equity Owners and Blocker Stockholders of 85% of certain tax benefits, if any, that we actually realize, or are deemed to realize (calculated using certain assumptions), as a result of (i) our allocable share of existing tax basis in Centinel LLC’s assets acquired in this offering, (ii) increases in our allocable share of existing tax basis and tax basis adjustments to the tangible and intangible assets of Centinel LLC as a result of sales or exchanges of LLC Units in connection with or after this offering, (iii) our utilization of certain tax attributes (including any existing tax basis) of the Blocker Companies, which Centinel Holdco acquires in connection with this offering, and (iv) certain other tax benefits related to our entering into the Tax Receivable Agreement, including tax benefits attributable to payments under the Tax Receivable Agreement. We will be required to make such payments to the Continuing Equity Owners and the Blocker Stockholders even if all of the Continuing Equity Owners were to exchange or redeem their remaining Series B Common Units. We intend to cause Centinel LLC to make distributions in an amount sufficient to allow us to pay our tax obligations and operating expenses, including distributions to fund any ordinary course payments due under the Tax Receivable Agreement. See “Organizational Structure—Amended and Restated Operating Agreement of Centinel Spine, LLC” and “Organizational Structure—Tax Receivable Agreement.”
Components of Our Results of Operations
We manage our business globally within one operating segment, which is consistent with how our management reviews our business, makes investment and resource allocation decisions and assesses operating performance.
Net Revenue
We recognize revenue from sales when our performance obligations with our customers have been satisfied. In contracts with our customers, we have identified a single performance obligation to provide motion preservation products, for which revenue is recognized at a point in time.
We sell our products through a distributor network, the majority of which do not take title to the inventory but facilitate the sale to the end customer (non-stocking distributors) and others who hold inventory of our products (stocking distributors in international markets). For sales through non-stocking distributors, we have determined hospitals or ambulatory surgical centers are our customer and recognize revenue at the time the product is used or implanted. For these sales, we have determined we are the principal in the transaction as we have the ability to direct the use of our products prior to transfer to the end customer, we are responsible for fulfilling the promise to the end customer, we have latitude in establishing price and control the relationship with the end customer. Accordingly, revenues are recognized at the gross amount charged to the end customer
126
with expense recognized for commissions paid to distributors classified as selling and marketing expenses in the Statement of Comprehensive Income (Loss). For sales through stocking distributors, we have determined the distributor is the customer and we recognize revenue upon shipment as control of the product transfers based on the contractual terms.
No single customer accounted for more than 10% of our net revenue during the six months ended June 30, 2026 and 2025 and the years ended December 31, 2025 and 2024.
Net revenue from sales of our products fluctuates based on the volume of procedures performed, discounts, and mix of international and U.S. sales. Although our business is generally not seasonal in nature, sales of our products may be influenced by summer vacation and winter holiday periods, during which we have experienced fewer surgeries taking place, with more surgeries taking place later in the year when patients have met the deductibles under their insurance plans. In addition, our sales can vary from quarter to quarter due to a variety of other factors, including reimbursement, sales force changes, and physician activities. Our net revenue is also impacted by changes as we respond to the competitive landscape and price differences at different medical facilities, such as hospitals and ASCs. Our net revenue from international sales is impacted by fluctuations in foreign currency exchange rates between the U.S. dollar (our reporting currency) and the local currency.
Cost of Sales, Gross Profit and Gross Margin
We utilize third-party manufacturers for production of our implants and instrument sets. Cost of sales consists primarily of costs of the components of our implants, instrument set depreciation, amortization of intangible assets, royalties, scrap and inventory obsolescence, as well as distribution-related expenses such as logistics and shipping costs. Commissions resulting from sales are included in operating expenses within selling and marketing. We anticipate our operational cost of sales will increase in the future as our operations continue to grow.
We calculate gross profit as net revenue less cost of sales, and gross margin as gross profit divided by net revenue. Our gross profit and gross margin are affected by factors impacting net revenue and cost of sales. In addition, our gross margins are typically higher on products that we sell in the U.S. market compared to the international markets due to varying pricing environments. As a result, changes in the geographic mix can directly influence our gross margins.
Operating Expenses
Our operating expenses consist of selling and marketing, general and administrative and research and development expenses. Personnel costs are the most significant component of operating expenses and consist of salaries, sales commissions and other cash and equity-based compensation related expenses. We anticipate operating expenses will continue to increase to support our operations.
Selling and Marketing Expenses
Our selling and marketing expenses primarily consist of salaries, benefits and other related costs, including equity-based compensation, for personnel employed in sales and marketing, and commissions, generally based on a percentage of sales, to direct sales representatives and distributors. We expect our selling and marketing expenses will generally increase with our planned investments in our sales force and surgeon training to capture future revenue growth opportunities.
General and Administrative Expenses
Our general and administrative expenses consist primarily of salaries and other personnel costs, and stock-based compensation for our finance, human resources and general management, as well as professional services, such as legal, audit, consulting, public relations and accounting services. We expect these expenses to increase as the company continues to grow. We also expect our administrative expenses to increase to support our operations as a public company, including increased expenses related to audit, legal, regulatory and tax-related services associated with being a public company, compliance with exchange listing and SEC requirements, director and officer insurance premiums and investor relations costs. We also expect to see an
127
increase in our stock-based compensation expense with the establishment of a new publicly-traded company equity plan and to the extent of grants in the form of restricted stock units or options.
Research and Development Expenses
Our research and development expenses include pre-approval regulatory and clinical study expenses, third-party expenses, personnel and consultants’ compensation, employee benefits, equity-based compensation expense and other headcount-related expenses associated with product development. Research and development costs are expensed as they are incurred.
Based upon our product development initiatives and the stage of the underlying projects, we expect to continue to make investments in research and development. As such, we anticipate that research and development expenses will increase in the future.
Other (Expense) Income
Other (Expense) Income, Net
Other (expense) income, net consists primarily of gains and losses associated with warrant and embedded derivative instruments that are remeasured at fair value at each reporting date as well as gains and losses associated with other non-operating related items.
Foreign Currency Gain (Loss)
Our reporting currency is the U.S. dollar. Certain of our transactions are conducted in currencies different from our functional currency and the gains and losses from these foreign currency transactions are included in income as they occur.
Interest Expense
Interest expense consists of interest expense associated with our outstanding borrowings and the amortization of deferred issuance costs and debt discounts associated with such arrangements.
Loss on Extinguishment of Debt
Loss on extinguishment of debt consists primarily of costs related to extinguishment of debt, see “—Debt Obligations” for additional details regarding our debt instruments.
128
Results of Operations
Comparison of Six Months Ended June 30, 2026 and 2025
The table below sets forth our results of operations for the periods presented:
| | | |
Six Months Ended
June 30, |
| |
Change
|
| ||||||||||||||||||
|
(in thousands)
|
| |
2026
|
| |
2025
|
| |
Amount
|
| |
%
|
| ||||||||||||
|
Net revenue
|
| | | $ | 85,244 | | | | | $ | 60,058 | | | | | $ | 25,186 | | | | | | 42% | | |
|
Cost of sales
|
| | | | 15,159 | | | | | | 12,083 | | | | | | 3,076 | | | | | | 25% | | |
|
Gross profit
|
| | | | 70,085 | | | | | | 47,975 | | | | | | 22,110 | | | | | | 46% | | |
| Operating expenses: | | | | | | | | | | | | | | | | | | | | | |||||
|
Selling and marketing
|
| | | | 42,151 | | | | | | 31,801 | | | | | | 10,350 | | | | | | 33% | | |
|
General and administrative
|
| | | | 12,092 | | | | | | 9,234 | | | | | | 2,858 | | | | | | 31% | | |
|
Research and development
|
| | | | 2,818 | | | | | | 2,469 | | | | | | 349 | | | | | | 14% | | |
|
Total operating expense
|
| | | | 57,061 | | | | | | 43,504 | | | | | | 13,557 | | | | | | 31% | | |
|
Operating income
|
| | | | 13,024 | | | | | | 4,471 | | | | | | 8,553 | | | | | | 191% | | |
| Other income (expense): | | | | | | | | | | | | | | | | | | | | | |||||
|
Other income (expense), net
|
| | | | 3,885 | | | | | | 34 | | | | | | 3,851 | | | | | | NM | | |
|
Foreign currency gain (loss)
|
| | | | (1,058) | | | | | | 4,089 | | | | | | (5,147) | | | | | | (126)% | | |
|
Interest expense
|
| | | | (5,507) | | | | | | (5,489) | | | | | | (18) | | | | | | 0% | | |
|
Loss on extinguishment of debt
|
| | | | — | | | | | | (3,458) | | | | | | 3,458 | | | | | | 100% | | |
|
Total other income (expense), net
|
| | | | (2,680) | | | | | | (4,824) | | | | | | 2,144 | | | | | | 44% | | |
|
Net income (loss) before taxes
|
| | | | 10,344 | | | | | | (353) | | | | | | 10,697 | | | |
NM
|
| |||
|
Income tax expense (benefit)
|
| | | | 108 | | | | | | 150 | | | | | | (42) | | | | | | (28)% | | |
|
Net income (loss)
|
| | | $ | 10,236 | | | | | $ | (503) | | | | | $ | 10,739 | | | |
NM
|
| |||
NM—Not Meaningful.
The table below sets forth our revenue by geographic area, based on the location of the customer, for the periods presented:
| | | |
Six Months Ended
June 30, |
| |
Change
|
| ||||||||||||||||||
|
(in thousands)
|
| |
2026
|
| |
2025
|
| |
Amount
|
| |
%
|
| ||||||||||||
|
U.S
|
| | | $ | 72,879 | | | | | $ | 49,542 | | | | | $ | 23,337 | | | | | | 47% | | |
|
International
|
| | | | 12,365 | | | | | | 10,516 | | | | | | 1,849 | | | | | | 18% | | |
|
Total revenue
|
| | | $ | 85,244 | | | | | $ | 60,058 | | | | | $ | 25,186 | | | | | | 42% | | |
Net Revenue
Net Revenue increased by $25.2 million, or 42%, for the six months ended June 30, 2026, compared to the six months ended June 30, 2025. The increase in revenue was primarily driven by a 37% increase in unit volume worldwide, due to increased sales in the United States, which accounted for 93% of the increase in net revenue.
U.S. revenue increased $23.3 million, or 47%, for the six months ended June 30, 2026, compared to the six months ended June 30, 2025. The increase in U.S. revenue was primarily attributable to a 56% increase in unit volume and growing base of active surgeons, including high volume surgeons. We had 1,736 active surgeons, including 334 high volume surgeons, as of June 30, 2026, representing an increase of 33% in active surgeons, including a 39% increase in high volume surgeons, compared to June 30, 2025. The volume increases were partially offset by a slight decline in our average selling price.
129
International revenue increased $1.8 million, or 18%, for the six months ended June 30, 2026, compared to the six months ended June 30, 2025. The International revenue increase was primarily attributed to further market penetration with a 13% increase in unit volume. These volume increases were augmented by an increase in our average selling price.
Cost of Sales and Gross Margin
Cost of sales was $15.2 million for the six months ended June 30, 2026, compared to $12.1 million for the six months ended June 30, 2025. The increase of $3.1 million, or 25%, was primarily attributable to the increase in sales that we attribute to our focus on accelerated growth. Gross margin for the six months ended June 30, 2026 was 82% compared to 80% for the six months ended June 30, 2025. The increase in gross margin was primarily due to revenue growth over fixed costs.
Operating Expenses
Selling and marketing
Selling and marketing expenses were $42.2 million for the six months ended June 30, 2026, compared to $31.8 million for the six months ended June 30, 2025. The increase of $10.4 million, or 33%, was primarily driven by a $7.0 million increase in commissions and a $2.7 million increase in employee-related costs due to sales headcount and incentive expenses, both attributable to higher sales volume.
General and administrative
General and administrative expenses were $12.1 million for the six months ended June 30, 2026, compared to $9.2 million for the six months ended June 30, 2025. The increase of $2.9 million, or 31%, was primarily attributable to higher professional fees, including increased accounting, audit and tax costs associated with public company readiness and ongoing compliance activities, increased sales and use tax expense, and higher personnel-related costs resulting from increased headcount and related compensation. General and administrative expenses also increased due to higher consulting, logistics and other operational support costs. These increases were partially offset by lower expenditures on certain regulatory, quality assurance and development projects.
Research and development
Research and development expenses were $2.8 million for the six months ended June 30, 2026, compared to $2.5 million for the six months ended June 30, 2025. The increase of approximately $0.3 million, or 14%, was primarily due to increased spend for further expansion of our current product offering and funding of clinical studies such as the hybrid indication (TDR adjacent to fusion) for the prodisc C TDR product family during the six months ended June 30, 2026.
Other Income (Expense)
Other (expense) income, net
Other (expense) income, net was $3.9 million for the six months ended June 30, 2026, compared to $0.0 million for the six months ended June 30, 2025. The increase in other income of $3.9 million was primarily driven by the adjustment to fair value of warrants and embedded derivatives that are remeasured to fair value at the end of each reporting period.
Foreign currency gain (loss)
Foreign currency gain (loss) for the six months ended June 30, 2026 and 2025 was $(1.1) million and $4.1 million, respectively. The change was driven by the fluctuations in the Euro relative to the U.S. dollar.
Interest expense
Interest expense did not change materially for the six months ended June 30, 2026, compared to the six months ended June 30, 2025.
130
Income Tax Expense (Benefit)
Income tax expense did not change materially for the six months ended June 30, 2026, compared to the six months ended June 30, 2025.
Comparison of Years Ended December 31, 2025 and 2024
The table below sets forth our results of operations for the periods presented:
| | | |
Years Ended
December 31, |
| |
Change
|
| ||||||||||||||||||
|
(in thousands)
|
| |
2025
|
| |
2024
|
| |
Amount
|
| |
%
|
| ||||||||||||
|
Net revenue
|
| | | $ | 132,163 | | | | | $ | 95,056 | | | | | $ | 37,107 | | | | | | 39% | | |
|
Cost of sales
|
| | | | 26,143 | | | | | | 22,232 | | | | | | 3,911 | | | | | | 18% | | |
|
Gross profit
|
| | | | 106,020 | | | | | | 72,824 | | | | | | 33,196 | | | | | | 46% | | |
| Operating expenses: | | | | | | | | | | | | | | | | | | | | | | | | | |
|
Selling and marketing
|
| | | | 67,497 | | | | | | 49,370 | | | | | | 18,127 | | | | | | 37% | | |
|
General and administrative
|
| | | | 19,157 | | | | | | 16,749 | | | | | | 2,408 | | | | | | 14% | | |
|
Research and development
|
| | | | 3,660 | | | | | | 4,954 | | | | | | (1,294) | | | | | | (26)% | | |
|
Total operating expense
|
| | | | 90,314 | | | | | | 71,073 | | | | | | 19,241 | | | | | | 27% | | |
|
Operating income
|
| | | | 15,706 | | | | | | 1,751 | | | | | | 13,955 | | | | | | 797% | | |
| Other (expense) income: | | | | | | | | | | | | | | | | | | | | | | | | | |
|
Other expense, net
|
| | | | (9,359) | | | | | | (5) | | | | | | (9,354) | | | | |
|
NM
|
| |
|
Foreign currency gain (loss)
|
| | | | 4,089 | | | | | | (1,830) | | | | | | 5,919 | | | | | | 323% | | |
|
Interest expense
|
| | | | (11,070) | | | | | | (12,141) | | | | | | 1,071 | | | | | | 9% | | |
|
Loss on extinguishment of debt
|
| | | | (3,458) | | | | | | — | | | | | | (3,458) | | | | | | (100)% | | |
|
Total other expense, net
|
| | | | (19,798) | | | | | | (13,976) | | | | | | (5,822) | | | | | | (42)% | | |
|
Net loss before taxes
|
| | | | (4,092) | | | | | | (12,225) | | | | | | 8,133 | | | | | | 67% | | |
|
Income tax expense (benefit)
|
| | | | 229 | | | | | | (102) | | | | | | 331 | | | | | | 325% | | |
|
Net loss
|
| | | $ | (4,321) | | | | | $ | (12,123) | | | | | $ | 7,802 | | | | | | 64% | | |
NM—Not Meaningful.
The table below sets forth our revenue by geographic area, based on the location of the customer, for the periods presented:
| | | |
Years Ended
December 31, |
| |
Change
|
| ||||||||||||||||||
|
(in thousands)
|
| |
2025
|
| |
2024
|
| |
Amount
|
| |
%
|
| ||||||||||||
|
U.S
|
| | | $ | 110,455 | | | | | $ | 76,618 | | | | | $ | 33,837 | | | | | | 44% | | |
|
International
|
| | | | 21,708 | | | | | | 18,438 | | | | | | 3,270 | | | | | | 18% | | |
|
Total revenue
|
| | | $ | 132,163 | | | | | $ | 95,056 | | | | | $ | 37,107 | | | | | | 39% | | |
Net Revenue
Net Revenue increased by $37.1 million, or 39%, for the year ended December 31, 2025, compared to the year ended December 31, 2024. The increase in revenue was primarily driven by a 30% increase in unit volume worldwide, due to increased sales in the United States, which accounted for 91% of the increase in net revenue.
U.S. revenue increased by $33.8 million, or 44%, for the year ended December 31, 2025, compared to the year ended December 31, 2024. The increase in U.S. revenue was primarily attributable to a 43% increase in unit volume and growing base of active surgeons, including high volume surgeons. We had 1,541 active surgeons, including 284 high volume surgeons as of December 31, 2025, representing an increase of 38% in active surgeons, including a 49% increase in high volume surgeons, compared to December 31, 2024.
131
International revenue increased by $3.3 million, or 18%, for the year ended December 31, 2025, compared to the year ended December 31, 2024. The international revenue increase was primarily attributed to further market penetration with a 15% increase in unit volume.
Cost of Sales and Gross Margin
Cost of sales was $26.1 million for the year ended December 31, 2025, compared to $22.2 million for the year ended December 31, 2024. The increase of $3.9 million, or 18%, was primarily attributable to the increase in sales that we attribute to our focus on accelerated growth. Gross margin for the year ended December 31, 2025 was 80% compared to 77% for the year ended December 31, 2024, the increase is primarily due to revenue growth over fixed costs.
Operating Expenses
Selling and marketing
Selling and marketing expenses were $67.5 million for the year ended December 31, 2025, compared to $49.4 million for the year ended December 31, 2024. The increase of $18.1 million, or 37%, was primarily driven by a $11.3 million increase in commissions and a $4.6 million increase in employee-related costs primarily incentive expenses due to higher sales volume and commercial expansion. The increase also reflects increases in freight and shipping costs of $0.6 million, travel expenses of $0.4 million and increases in costs associated with marketing and medical education to support the expansion of our sales and marketing activities.
General and administrative
General and administrative expenses were $19.2 million for the year ended December 31, 2025, compared to $16.7 million for the year ended December 31, 2024. The increase of $2.4 million, or 14%, was primarily attributable to higher employee incentive expenses.
Research and development
Research and development expenses were $3.7 million for the year ended December 31, 2025, compared to $5.0 million for the year ended December 31, 2024. The decrease of approximately $1.3 million, or 26%, was primarily due to lower spend on two-level prodisc C SK and Vivo IDE study due to the approval that was received in October 2025.
Other Income (Expense)
Other (expense) income, net
Other (expense) income, net was $(9.4) million expense for the year ended December 31, 2025, compared to $0.0 million for the year ended December 31, 2024. The increase in other expense of $9.4 million was primarily driven by the adjustment to fair value of warrants and embedded derivatives that are remeasured to fair value at the end of each reporting period.
Foreign currency gain (loss)
Foreign currency gain (loss) for the years ended December 31, 2025 and 2024 was $4.1 million and $(1.8) million, respectively. The change was driven by the fluctuations in the Euro relative to the U.S. dollar.
Interest expense
Interest expense was $11.1 million for the year ended December 31, 2025, compared to $12.1 million for the year ended December 31, 2024, representing a decrease of $1.1 million, or 9%. This decrease was primarily attributed to the refinancing of our indebtedness in February 2025 with a more favorable interest rate.
Income Tax Expense (Benefit)
Income tax expense increased to $0.2 million for the year ended December 31, 2025, compared to income tax benefit of $0.1 million for the year ended December 31, 2024. The effective tax rate was (5.6)% for the year ended December 31, 2025, and 0.8% for the year ended December 31, 2024. For both tax years, the effective
132
tax rate was lower than the U.S. statutory tax rate primarily due to partnership income not subject to taxation, the recognition of valuation allowances against net operating loss carryforwards and temporary differences, and foreign income subject to tax at lower statutory tax rates.
Unaudited Quarterly Results of Operations Data
The following table sets forth our selected unaudited quarterly consolidated statements of operations data for each of the four fiscal quarters in each of the years ended December 31, 2025 and 2024 and the fiscal quarters ended March 31, 2026 and June 30, 2026. The information for each of these quarters has been prepared in accordance with GAAP, on the same basis as our audited consolidated financial statements included elsewhere in this prospectus and includes, in our opinion, all normal recurring adjustments necessary for the fair presentation of the results of operations for the periods presented. Our historical quarterly results are not necessarily indicative of the results that may be expected in the future and these quarterly results are not necessarily indicative of our operating results for a full year. The following quarterly financial information should be read in conjunction with our consolidated financial statements and related notes thereto included elsewhere in this prospectus.
| | | |
Three Months Ended
|
| |||||||||||||||||||||||||||||||||||||||||||||||||||||||||
| | | |
Mar 31,
2024 |
| |
Jun 30,
2024 |
| |
Sep 30,
2024 |
| |
Dec 31,
2024 |
| |
Mar 31,
2025 |
| |
Jun 30,
2025 |
| |
Sep 30,
2025 |
| |
Dec 31,
2025 |
| |
Mar 31,
2026 |
| |
Jun 30,
2026 |
| ||||||||||||||||||||||||||||||
| (In thousands, except per share amounts) | | | | | | | | | | | | | | | | | | | | | | | | | | | | | | | | | | | | | | | | | | | | | | | | | | | | | | | | | | | | | |
|
Net revenue
|
| | | $ | 20,851 | | | | | $ | 22,039 | | | | | $ | 22,495 | | | | | $ | 29,671 | | | | | $ | 27,681 | | | | | $ | 32,377 | | | | | $ | 31,935 | | | | | $ | 40,170 | | | | | $ | 40,505 | | | | | $ | 44,739 | | |
|
Cost of sales
|
| | | | 5,041 | | | | | | 4,871 | | | | | | 5,308 | | | | | | 7,012 | | | | | | 5,747 | | | | | | 6,336 | | | | | | 6,292 | | | | | | 7,768 | | | | | | 7,279 | | | | | | 7,880 | | |
|
Gross profit
|
| | | | 15,810 | | | | | | 17,168 | | | | | | 17,187 | | | | | | 22,659 | | | | | | 21,934 | | | | | | 26,041 | | | | | | 25,643 | | | | | | 32,402 | | | | | | 33,226 | | | | | | 36,859 | | |
| Operating expenses: | | | | | | | | | | | | | | | | | | | | | | | | | | | | | | | | | | | | | | | | | | | | | | | | | | | | | | | | | | | | | |
|
Selling and marketing
|
| | | | 10,661 | | | | | | 11,770 | | | | | | 11,817 | | | | | | 15,122 | | | | | | 14,745 | | | | | | 17,056 | | | | | | 16,412 | | | | | | 19,284 | | | | | | 20,342 | | | | | | 21,809 | | |
|
General and administrative
|
| | | | 4,434 | | | | | | 4,485 | | | | | | 3,993 | | | | | | 3,837 | | | | | | 4,283 | | | | | | 4,951 | | | | | | 4,651 | | | | | | 5,272 | | | | | | 5,745 | | | | | | 6,347 | | |
|
Research and development
|
| | | | 1,452 | | | | | | 1,216 | | | | | | 1,206 | | | | | | 1,080 | | | | | | 1,084 | | | | | | 1,385 | | | | | | 1,209 | | | | | | (18) | | | | | | 1,389 | | | | | | 1,429 | | |
|
Total operating expenses
|
| | | | 16,547 | | | | | | 17,471 | | | | | | 17,016 | | | | | | 20,039 | | | | | | 20,112 | | | | | | 23,392 | | | | | | 22,272 | | | | | | 24,538 | | | | | | 27,476 | | | | | | 29,585 | | |
|
Operating income (loss)
|
| | | | (737) | | | | | | (303) | | | | | | 171 | | | | | | 2,620 | | | | | | 1,822 | | | | | | 2,649 | | | | | | 3,371 | | | | | | 7,864 | | | | | | 5,750 | | | | | | 7,274 | | |
| Other income (expense): | | | | | | | | | | | | | | | | | | | | | | | | | | | | | | | | | | | | | | | | | | | | | | | | | | | | | | | | | | | | | |
|
Other income (expense), net
|
| | | | (14) | | | | | | (18) | | | | | | (100) | | | | | | 127 | | | | | | 14 | | | | | | 20 | | | | | | 7 | | | | | | (9,400) | | | | | | 81 | | | | | | 3,804 | | |
|
Foreign currency (loss) gain
|
| | | | (594) | | | | | | (187) | | | | | | 1,145 | | | | | | (2,194) | | | | | | 1,367 | | | | | | 2,722 | | | | | | (41) | | | | | | 41 | | | | | | (741) | | | | | | (317) | | |
|
Interest expense
|
| | | | (3,066) | | | | | | (2,886) | | | | | | (3,105) | | | | | | (3,084) | | | | | | (2,819) | | | | | | (2,670) | | | | | | (2,797) | | | | | | (2,784) | | | | | | (2,733) | | | | | | (2,774) | | |
|
Loss on extinguishment of debt
|
| | | | — | | | | | | — | | | | | | — | | | | | | — | | | | | | (3,458) | | | | | | — | | | | | | — | | | | | | — | | | | | | — | | | | | | — | | |
|
Total other income (expense), net
|
| | | | (3,674) | | | | | | (3,091) | | | | | | (2,060) | | | | | | (5,151) | | | | | | (4,896) | | | | | | 72 | | | | | | (2,831) | | | | | | (12,143) | | | | | | (3,393) | | | | | | 713 | | |
|
Net income (loss) before taxes
|
| | | | (4,411) | | | | | | (3,394) | | | | | | (1,889) | | | | | | (2,531) | | | | | | (3,074) | | | | | | 2,721 | | | | | | 540 | | | | | | (4,279) | | | | | | 2,357 | | | | | | 7,987 | | |
|
Income tax expense (benefit)
|
| | | | 47 | | | | | | 110 | | | | | | (64) | | | | | | (195) | | | | | | 114 | | | | | | 36 | | | | | | (17) | | | | | | 96 | | | | | | 47 | | | | | | 61 | | |
|
Net income (loss)
|
| | | $ | (4,458) | | | | | $ | (3,504) | | | | | $ | (1,825) | | | | | $ | (2,336) | | | | | $ | (3,188) | | | | | $ | 2,685 | | | | | $ | 557 | | | | | $ | (4,375) | | | | | $ | 2,310 | | | | | $ | 7,926 | | |
Non-GAAP Financial Measures
In addition to our results and measures of performance determined in accordance with U.S. GAAP, we believe that non-GAAP financial measures can be useful in evaluating and comparing our financial and operational performance over multiple periods, identifying trends affecting our business, formulating business plans and making strategic decisions. We utilize and present Adjusted EBITDA and Adjusted EBITDA margin for these purposes. We define Adjusted EBITDA as net income (loss) before interest expense, income tax expense (benefit), depreciation and amortization, currency gain (loss), and other income (expense) as well as certain non-recurring items. Adjusted EBITDA margin is calculated as Adjusted EBITDA as a percentage of net revenue. We believe that Adjusted EBITDA and Adjusted EBITDA margin, together with a reconciliation to net income (loss) and net income (loss) margin, provides meaningful supplemental information regarding our performance by excluding certain items that may not be indicative of our business, results of operations, or outlook. However, Adjusted EBITDA has limitations as an analytical tool, and you should not consider this
133
measure in isolation or as a substitute for analysis of our financial results as reported under U.S. GAAP. Some of these potential limitations include:
•
other companies, including companies in our industry which have similar business arrangements, may report Adjusted EBITDA, or similarly titled measures but calculate them differently, which reduces their usefulness as comparative measures;
•
although depreciation and amortization expenses are non-cash charges, the assets being depreciated and amortized may have to be replaced in the future, and Adjusted EBITDA does not reflect cash capital expenditures for such replacements or for new capital expenditure requirements;
•
Adjusted EBITDA also does not reflect changes in, or cash requirements for, our working capital needs or the potentially dilutive impact of stock-based compensation; and
•
Adjusted EBITDA does not reflect the interest expense, or the cash requirements necessary to service interest or principal payments, on existing or future debt that we may incur.
Because of these and other limitations, you should consider Adjusted EBITDA only as supplemental to other GAAP-based financial measures.
The following table presents a reconciliation of Adjusted EBITDA to the most comparable GAAP financial measure, net income (loss), for each of the periods indicated (in thousands):
| | | |
Six Months Ended
June 30, |
| |
Year Ended
December 31, |
| ||||||||||||||||||
| | | |
2026
|
| |
2025
|
| |
2025
|
| |
2024
|
| ||||||||||||
|
Net income (loss)
|
| | | $ | 10,236 | | | | | $ | (503) | | | | | $ | (4,321) | | | | | $ | (12,123) | | |
|
Interest expense
|
| | | | 5,507 | | | | | | 5,489 | | | | | | 11,070 | | | | | | 12,141 | | |
|
Income tax expense (benefit)
|
| | | | 108 | | | | | | 150 | | | | | | 229 | | | | | | (102) | | |
|
Depreciation and amortization expense
|
| | | | 2,490 | | | | | | 2,080 | | | | | | 4,447 | | | | | | 4,155 | | |
|
Foreign currency gain (loss)(1)
|
| | | | 1,058 | | | | | | (4,089) | | | | | | (4,089) | | | | | | 1,830 | | |
|
Other (income) expense(2)
|
| | | | (3,885) | | | | | | (34) | | | | | | 9,359 | | | | | | 5 | | |
|
Loss on extinguishment of debt(3)
|
| | | | — | | | | | | 3,458 | | | | | | 3,458 | | | | | | — | | |
|
Adjusted EBITDA(4)
|
| | | $ | 15,514 | | | | | $ | 6,551 | | | | | $ | 20,153 | | | | | $ | 5,906 | | |
|
Net revenue
|
| | | $ | 85,244 | | | | | $ | 60,058 | | | | | $ | 132,163 | | | | | $ | 95,056 | | |
|
Net income (loss) margin
|
| | | | 12% | | | | | | (1)% | | | | | | (3)% | | | | | | (13)% | | |
|
Adjusted EBITDA margin
|
| | | | 18% | | | | | | 11% | | | | | | 15% | | | | | | 6% | | |
(1)
Foreign currency gain (loss) consists of gains and losses resulting from changes in foreign currency exchange rates. We provide an adjustment for foreign currency gain (loss) because these amounts are affected by exchange rate movements and are not directly reflective of the operating performance of our business.
(2)
Other (income) expense relates to change in fair value of warrant and derivative liabilities, and consists of non-cash gains or losses resulting from the remeasurement of warrant and derivative liabilities. We provide an adjustment for these amounts because they are non-cash and are driven by changes in valuation assumptions and market factors rather than the operating performance of our business.
(3)
Loss on extinguishment of debt consists of charges recognized in connection with the extinguishment or modification of debt obligations. We provide an adjustment for these amounts because they relate to financing transactions and do not reflect the operating performance of our business.
(4)
Adjusted EBITDA is defined as net income (loss) before interest expense, income tax expense (benefit), depreciation and amortization, foreign currency gain (loss), and other income (expense) as well as certain non-recurring items such as loss on extinguishment of debt.
Liquidity and Capital Resources
Our principal sources of liquidity to date have been private placements of our securities, debt financing agreements and net revenue from the sale of our products. We had net income of $10.2 million for the six months ended June 30, 2026 compared to net loss of $0.5 million for the six months ended June 30, 2025. We generated losses from our operations since our inception until the six months ended June 30, 2026, as reflected in our accumulated deficit of $188.4 million as of June 30, 2026. We had net loss of $4.3 million for the year
134
ended December 31, 2025 compared to net loss of $12.1 million for the year ended December 31, 2024. Our losses primarily resulted from the costs incurred in the development, sales, and marketing of our products and providing support for our operations. We expect to continue to expend significant amounts of cash for the foreseeable future as we continue to scale our business, increase sales and marketing, medical education and product development expenses to support the expansion of our commercial organization, and increase general and administrative expenses to support being a publicly-traded company.
Tax Receivable Agreement
After the consummation of this offering, Centinel Holdco will be a holding company and will have no material assets other than its ownership of equity interests in Centinel LLC. Centinel Holdco will have no independent means of generating revenue or cash flow. Under the terms of the LLC Operating Agreement and the Tax Receivable Agreement that will be in effect at the time of the consummation of this offering, Centinel LLC is obligated to make tax distributions to the LLC Unitholders, including us. To the extent that Centinel LLC has available cash, we intend to cause Centinel LLC to make cash distributions to the owners of LLC Units, including us, in amounts sufficient to (i) fund all or part of their tax obligations in respect of taxable income allocated to them and (ii) cover our operating expenses, including payments under the Tax Receivable Agreement.
Estimated Tax Receivable Agreement Payments
We expect that the payments we will be required to make under the Tax Receivable Agreement will be substantial. Based on current assumptions regarding future taxable income and applicable tax rates, assuming all exchanges would occur immediately after this offering, we currently estimate that payments under the Tax Receivable Agreement would fall within the following ranges:
|
Period
|
| |
Estimated TRA
Payments |
|
|
Next 12 months
|
| |
$0 – $
|
|
|
Years 2 – 5
|
| |
$ – $
|
|
|
Years 6 – 15
|
| |
$ – $
|
|
The estimated payment profile should not be viewed as a forecast of actual annual Tax Receivable Agreement payments. Rather, the allocation among periods is based on the simplifying assumption that all exchanges occur immediately following the offering and that the resulting tax benefits are realized evenly over the assumed 15-year period of time from the date of this offering. Under this assumption, approximately 1/15th of the aggregate estimated Tax Receivable Agreement payments would be expected to occur during the first 12 months, approximately 4/15ths during years 2 through 5, and the remaining 10/15ths during years 6 through 15. The foregoing estimates are inherently uncertain and should not be considered a prediction of actual future payments.
Sensitivity of Expected Tax Receivable Agreement Payments
The actual amount and timing of payments under the Tax Receivable Agreement may differ materially from current expectations and can vary depending upon a number of factors, including the timing of exchanges by the LLC Unitholders, the amount of gain recognized by the LLC Unitholders, the amount and timing of the taxable income we generate in the future and the federal tax rates then applicable. For example, the estimated Tax Receivable Agreement payments above are sensitive to changes in key assumptions, including the following:
•
lower taxable income would generally defer realization of tax benefits and reduce near-term Tax Receivable Agreement payments;
•
higher taxable income would generally accelerate realization of tax benefits and increase near-term Tax Receivable Agreement payments;
•
accelerated exchanges of Series B Common Units would generally accelerate future tax basis adjustments and result in accelerated aggregate Tax Receivable Agreement payments;
135
•
deferred exchanges would generally delay future Tax Receivable Agreement obligations; and
•
higher interest accruals on any unpaid Tax Receivable Agreement obligations would increase the amount of future payments.
We cannot predict the impact of any changes in any key assumptions identified above. By way of example, assuming (i) a price of $ per share of our Class A common stock (the midpoint of the estimated price range set forth on the cover page of this prospectus); (ii) a constant corporate tax rate of % ; (iii) we will have sufficient taxable income to fully utilize the tax benefits; and (iv) no material changes in tax law, if the Continuing Equity Owners were to exchange all of the Series B Common Units that they will hold immediately following this offering, we estimate that we would, as a result of the Organizational Transactions and such hypothetical exchange, record a deferred tax asset of approximately $ million and that the aggregate noncurrent liability we would record based on our estimate of the aggregate amount that we would pay under the Tax Receivable Agreement is approximately $ million, generally payable over a 15-year period. Further, if the Continuing Equity Owners were to exchange all of the Series B Common Units they will hold immediately following the completion of this offering and assuming all other facts above are unchanged, for each 5% increase (decrease) in the price per share of our Class A Common Stock following the date of this offering (and therefore the value of the Series B Common Units exchanged), our deferred tax asset would increase (decrease) by approximately $ million and the related liability for payments under the Tax Receivable Agreement would increase (decrease) by approximately $ million. These amounts are estimates and have been prepared for informational purposes only. The actual amount of deferred tax assets and related noncurrent liabilities that we will recognize as a result of any such future exchanges will differ based on, among other things: (i) the amount and timing of future exchanges of Series B Common Units by Continuing Equity Owners, and the extent to which such exchanges are taxable; (ii) the price per share of our Class A Common Stock at the time of the exchanges; (iii) the amount and timing of future income against which to offset the tax benefits; and (iv) the tax rates then in effect.
Impact of Tax Receivable Agreement Payments
We expect to satisfy our obligations under the Tax Receivable Agreement primarily through:
•
distributions from Centinel LLC; or
•
other financing sources that may be available from time to time.
However, there can be no assurance that Centinel LLC will be able to generate cash from operations, have existing cash balances, or borrow under its existing credit facilities to make distributions to us in amounts sufficient to fund our obligations under the Tax Receivable Agreement or that alternative financing sources will be available to us on acceptable terms. To the extent that we are unable to make payments under the Tax Receivable Agreement for any reason, the unpaid amounts generally will be deferred and will accrue interest until paid by us. If we do not have sufficient funds to pay taxes, payments under the Tax Receivable Agreement or other liabilities or to fund our operations, we may have to borrow funds, which could materially adversely affect our liquidity and financial condition and subject us to various restrictions imposed by any such lenders.
Although we expect to realize tax benefits that are expected to exceed the related Tax Receivable Agreement payments, the timing of realization of such tax benefits may differ from the timing of required payments under the Tax Receivable Agreement. Accordingly, the Tax Receivable Agreement may have a material impact on our liquidity and capital resources in particular periods.
In addition, we will not be reimbursed for any cash payments previously made to the TRA Parties under the Tax Receivable Agreement in the event that any Tax Benefits initially claimed by us and for which payment has been made to a TRA Party are subsequently challenged by a taxing authority and are ultimately disallowed. Instead, any excess cash payments made by us to a TRA Party will be netted against future cash payments, if any, that we might otherwise be required to make to such TRA Party, under the terms of the Tax Receivable Agreement. However, we might not determine that we have effectively made an excess cash payment to a TRA Party for a number of years following the initial time of such payment. Moreover, the excess cash payments we made previously under the Tax Receivable Agreement could be greater than the amount of future cash payments against which we would otherwise be permitted to net such excess. As a result, payments could be made under the Tax Receivable Agreement significantly in excess of any actual cash tax savings that we realize
136
in respect of the Tax Benefits with respect to a TRA Party that are the subject of the Tax Receivable Agreement. See “Risk Factors—Risks Related to Our Organizational Structure—We will not be reimbursed for any payments made under the Tax Receivable Agreement in the event that any Tax Benefits are disallowed.”
In addition to payments required by the Tax Receivable Agreement, our expected primary uses of cash on a short and long-term basis are for working capital requirements, capital expenditures, research and development, debt service requirements, potential acquisitions, and other general corporate purposes. See “—Future Funding Requirements.”
Debt Obligations
As of June 30, 2026, we had cash and cash equivalents of $25.1 million, and the aggregate outstanding amount of our indebtedness was $136.1 million.
Loan Agreement and 2025 Credit Agreement
We entered into a Loan and Security Agreement, dated as of February 25, 2025 (the “Loan Agreement”), with SLR Investment Corp. (“SLR”), and the other lenders party thereto, pursuant to which we borrowed an aggregate principal amount of $60.0 million (the “Term Loan”). We also entered into a Credit Agreement, dated as of February 25, 2025 (the “2025 Credit Agreement”), with Gemino Healthcare Finance, LLC d/b/a SLR Healthcare ABL (“Gemino”), pursuant to which we may borrow up to $5 million in revolving loans and may request Gemino to increase the amount we may borrow up to $10.0 million. The obligations under the Loan Agreement and the 2025 Credit Agreement are secured by substantially all of our assets. As of June 30, 2026, the aggregate amount outstanding under the Loan Agreement was approximately $61.4 million.
In addition, on February 25, 2025, in connection with entering into the Loan Agreement, we repaid in full our Loan and Security Agreement with Innovatus with an outstanding principal balance of $36.5 million and accumulated paid-in-kind interest of $3.5 million. In connection with this transaction, we also incurred total debt extinguishment costs of $2.1 million. We entered into the Loan and Security Agreement with Innovatus in March 2021, and we borrowed an aggregate principal amount of $54.0 million under such Loan and Security Agreement, comprised of the term loan in the principal amount of $44.0 million and additional term loans in the aggregate principal amount of $10.0 million. The principal amount under the loan accrued interest at a floating per annum rate of interest equal to the sum of (i) the greater of the prime rate of interest or 3.25% and (ii) 7.25% if we have not fully satisfied all of our equity raise obligations and 6.5% if we have fully satisfied all of our equity raise obligations.
Each of the Loan Agreement and the 2025 Credit Agreement has a term of five years. The loans outstanding under the 2025 Credit Agreement accrue interest at a floating interest rate per annum equal to the Term SOFR plus 3.95% and the Term Loan accrues interest at a floating interest rate per annum equal to the Term SOFR plus 5.30%. Beginning March 1, 2028, we will be required to make monthly principal payments of $2.5 million through the maturity date on March 1, 2030. The Loan Agreement and the 2025 Credit Agreement include customary affirmative and negative covenants, imposing certain financial obligations on us, such as maintaining minimum revenue requirements, as well as limiting our ability to engage in specified types of transactions without the lenders’ prior consent, including, among other things, our ability to: (i) pay dividends, (ii) sell, lease, transfer, assign or dispose of all or any part of our business or property, subject to certain exceptions, (iii) engage in any business other than the businesses currently engaged in by us and our subsidiaries or reasonably related to such businesses, (iv) merge or consolidate with, or acquire all or substantially all of the capital stock, shares or property of, another entity, (v) create, incur, assume, or be liable for any indebtedness, except for certain permitted indebtedness, (vi) create, incur, allow, or suffer any lien on any of our property, except for certain permitted liens, and (vii) make any investment other than certain permitted investments. The Loan Agreement and the 2025 Credit Agreement also include customary events of default, including (i) payment defaults, (ii) breaches of covenants, some of which have grace periods, (iii) insolvency events, (iv) cross defaults to other indebtedness, (v) judgments for the payment of money, (vi) breaches of representations and warranties, and (vii) the revocation or suspension of governmental approvals or the initiation of regulatory actions with respect to our products. Upon the occurrence and the continuance of an event of default, the lenders may demand immediate repayment of all principal and unpaid interest under the Loan Agreement and the 2025 Credit Agreement and exercise remedies against us and the collateral securing
137
the obligations outstanding under the Loan Agreement and the 2025 Credit Agreement. As of June 30, 2026, we were in compliance with all covenants contained in the Loan Agreement and the Credit Agreement.
2023 Credit Agreement
We also entered into a Credit Agreement, dated as of April 18, 2023, as amended by Amendment No. 1, dated as of February 25, 2025 (the “2023 Credit Agreement”), with entities and trust controlled by some of our equity holders and board observers, pursuant to which we borrowed an aggregate principal amount of approximately $5.25 million. As of June 30, 2026, the aggregate amount outstanding under the 2023 Credit Agreement was approximately $12.5 million. Each lender under the 2023 Credit Agreement was issued warrants (“Class B Warrants”) to purchase Class B Preferred Units at an exercise price of $0.01. The Class B Warrants provide the lenders holding such warrants the right to purchase, in the aggregate, 564,779 Class B Preferred Units. The term notes issued under the 2023 Credit Agreement bear interest at 10% per annum, payable by adding accrued interest to principal annually on each loan’s anniversary date. The term notes issued under the 2023 Credit Agreement have a maturity date of September 30, 2030, and are unsecured and subordinated to our obligations under the Loan Agreement and the 2025 Credit Agreement. In the event of any repayment of the term notes or the occurrence of a Repayment Trigger Event (defined below), but subject to the terms of the subordination agreement related to the Loan Agreement and the 2025 Credit Agreement, in addition to the obligation to pay the outstanding principal amount of the loans and unpaid interest thereon, we will have to pay the lenders party to the 2023 Credit Agreement the Make-Whole Amount (defined below). A Repayment Trigger Event is (i) the sale of the company, (ii) an initial public offering of the company or its successor, or (iii) a refinancing of the Loan Agreement and the 2025 Credit Agreement. The “Make-Whole Amount” is defined as the product of $5.25 million and the Make-Whole Multiple then in effect, less $5.25 million, less the aggregate amount of interest accrued on the loans from origination to the repayment date. The “Make Whole Multiple” is (i) from April 18, 2023 to August 31, 2026, 2.50, (ii) from September 1, 2026 to August 31, 2027, 2.75, (iii) from September 1, 2027 to August 31, 2028, 3.00, (iv) from September 1, 2028 to August 31, 2029, 3.25, and (v) from and after August 31, 2029 until the loans are paid in full, 3.50. Notwithstanding the foregoing, no principal, interest, or Make-Whole Amounts are payable until the obligations outstanding under the Loan Agreement and the 2025 Credit Agreement are paid in full.
The consummation of this offering will constitute a Repayment Trigger Event under the 2023 Credit Agreement. Although the Make-Whole Amount is not payable upon the consummation of this offering because the outstanding obligations under the Loan Agreement and the 2025 Credit Agreement will not be paid in full with the net proceeds from this offering, with the consent of the lenders party to the Loan Agreement and the 2025 Credit Agreement, we intend to use the net proceeds from this offering to repay loans outstanding under the 2023 Credit Agreement, accrued and unpaid interest on such loans and the Make-Whole Amount, and if such loans are repaid prior to December 31, 2026, the Make-Whole Amount will be approximately $7.2 million depending on the date of such repayment.
The effective interest rates on the term notes range from 10.44% to 10.78%.
Convertible Note Purchase Agreement
We entered into a Convertible Note Purchase Agreement, dated as of March 29, 2021, as amended, with Vision BioBanc Holdings LLC (“Vision BioBanc”), pursuant to which we issued a convertible note in the principal amount of $10.0 million (“6% Convertible Note”), which may be prepaid without the consent of Vision Biobanc upon a 14-day prior written notice to Vision Biobanc. As of June 30, 2026, the aggregate amount outstanding under the 6% Convertible Note was approximately $10.1 million. The 6% Convertible Note has a maturity date of September 1, 2030, is unsecured and is subordinated to our obligations under the Loan Agreement and the 2025 Credit Agreement. The outstanding principal amount of the 6% Convertible Note accrues interest at 6.0% per year, compounded and payable quarterly. Vision Biobanc has the option of converting the outstanding principal amount of the 6% Convertible Note and accrued and unpaid interest thereon into our Class B Preferred Units at a price per unit equal to $1.39435. On February 20, 2025, Vision Biobanc converted the accrued and unpaid interest of $1.453 million into 1,042,384 Class B Preferred Units at a conversion price of $1.39435 per unit, and elected to have accrued and unpaid interest convert to Class B Preferred Units each quarter in lieu of the quarterly cash payments of accrued interest (the “Interest Conversion Election”). During the fiscal year ended December 31, 2025, Vision BioBanc converted an
138
aggregate of $1.842 million of accrued and unpaid interest into 1,321,572 Class B Preferred Units at a conversion price of $1.39435 per unit pursuant to the Interest Conversion Election. During the six months ended June 30, 2026, Vision BioBanc converted an aggregate of $0.3 million of accrued and unpaid interest into 215,154 Class B Preferred Units at a conversion price of $1.39435 per unit pursuant to the Interest Conversion Election. Vision BioBanc can terminate the Interest Conversion Election upon written notice to us at least fifteen days prior to the date of the quarterly issuance of Class B Preferred Units.
Subordinated Convertible Promissory Note Purchase Agreement
We entered into a Subordinated Convertible Promissory Note Purchase Agreement (the “Note Agreement”), dated November 17, 2021, as amended, and from that date to May 2024, we issued Subordinated Convertible Promissory Notes (“4.42% Convertible Notes”) to various investors, including certain of our officers, directors, and entities controlled by certain of our directors under the form of such Note Agreement. The maturity date of the 4.42% Convertible Notes ranges from November 2030 to May 2033. 4.42% Convertible Notes had an initial interest rate of 1.08%, subject to increases to match any greater interest rate that we agreed to in subsequent issuances of 4.42% Convertible Notes. As of June 30, 2026, the interest rate on 4.42% Convertible Notes was 4.42%. As of June 30, 2026, the aggregate principal amount of the 4.42% Convertible Notes issued under the Note Agreement was $46.0 million, and the accrued interest on the 4.42% Convertible Notes was $6.9 million.
Our obligations under the 2023 Credit Agreement, the 6% Convertible Note and 4.42% Convertible Notes are unsecured and subordinated to our obligations under the Loan Agreement and the 2025 Credit Agreement. As part of the Organizational Transactions, the outstanding principal amount of the 6% Convertible Note and the 4.42% Convertible Notes and accrued interest thereon will convert into shares of Class A Common Stock in connection with the completion of this offering.
Obligations Under Our Lease Agreement
We lease warehouse and office space in West Chester, Pennsylvania pursuant to the Lease Agreement, which we renewed until June 30, 2027, with an option to extend until June 30, 2028. We also entered into other operating leases. Our leases have initial lease terms ranging from one year to three years. Certain leases contain options to extend terms beyond the lease termination date. As of June 30, 2026, remaining aggregate payments due for the full terms of our leases were approximately $0.5 million.
Future Funding Requirements
Based on our current operating plan, we believe that the estimated net proceeds from this offering, together with the expected cash generated from the sale of our products, our existing cash and cash equivalents and amounts under our Loan Agreement and Credit Agreement will be sufficient to fund our planned operating expenses and capital expenditure requirements for at least the next 12 months. We have based this estimate on assumptions that may prove to be wrong, and we could deplete our capital resources sooner than we expect. We may experience lower than expected cash generated from operating activities or greater than expected capital expenditures, cost of sales, or operating expenses, and may need to raise additional capital to fund operations, increase our commercial organization and efforts, further research and development activities, or acquire, invest in, or in-license other businesses, assets, or technologies.
Our future capital needs will depend upon many factors, including:
•
the market awareness and adoption of our products;
•
the scope, timing and costs of supporting the growth and expansion of our commercial organization and efforts;
•
the cost and pace of our research and development activities;
•
the costs associated with any product recall that has occurred or may occur;
•
the costs associated with the manufacture and supply of our products at increased production levels;
•
the costs associated with securing additional suppliers and service providers;
139
•
the costs associated with complying with regulatory requirements;
•
the cost and timing of additional regulatory clearances or approvals;
•
the costs associated with export and import restrictions, including unexpected changes in tariffs;
•
the costs related to complexities of foreign value-added tax systems;
•
the costs of attaining, defending, and enforcing our intellectual property rights;
•
whether we acquire third-party products or technologies;
•
the terms and timing of any other distribution, collaborative, licensing, and other arrangements that we may establish;
•
the emergence of competing technologies or other adverse market developments;
•
our ability to raise additional funds to finance our operations;
•
debt service requirements;
•
the rate at which we expand internationally; and
•
the costs associated with being a public company.
We may seek to raise any necessary additional capital through public or private equity offerings or debt financings, credit or loan facilities or a combination of one or more of these or other funding sources. Additional funds may not be available to us on acceptable terms or at all. If we fail to obtain necessary capital when needed on acceptable terms, or at all, we could be forced to delay, limit, reduce or terminate our product development programs, commercialization efforts or other operations. If we raise additional funds by issuing equity securities or convertible debt, our stockholders will suffer dilution and the terms of any financing may adversely affect the rights of our stockholders. In addition, as a condition to providing additional funds to us, future investors may demand, and may be granted, rights superior to those of existing stockholders. If we raise additional capital through collaborations agreements, licensing arrangements or marketing and distribution arrangements, we may have to relinquish valuable rights, future revenue streams, research programs or product or grant licenses that may not be favorable to us. Debt financing, if available, is likely to involve restrictive covenants limiting our flexibility in conducting future business activities, and, in the event of insolvency, debt holders would be repaid before holders of our equity securities received any distribution of our corporate assets.
Cash Flows
The following table sets forth our primary sources and uses of cash for each of the periods presented (in thousands):
| | | |
Six Months Ended
June 30, |
| |
Change
Amount |
| ||||||||||||
| | | |
2026
|
| |
2025
|
| ||||||||||||
|
Net cash provided by (used in) operating activities
|
| | | $ | 7,705 | | | | | $ | (4,554) | | | | | $ | 12,259 | | |
|
Net cash used in investing activities
|
| | | | (3,806) | | | | | | (2,815) | | | | | | (991) | | |
|
Net cash provided by financing activities
|
| | | | — | | | | | | 19,228 | | | | | | (19,228) | | |
|
Effect of the exchange rate on cash
|
| | | | (82) | | | | | | (50) | | | | | | (32) | | |
|
Net increase in cash and cash equivalents
|
| | | $ | 3,817 | | | | | $ | 11,809 | | | | | $ | (7,992) | | |
| | | |
Year Ended
December 31, |
| |
Change
Amount |
| ||||||||||||
| | | |
2025
|
| |
2024
|
| ||||||||||||
|
Net cash provided by (used in) operating activities
|
| | | $ | 1,655 | | | | | $ | (6,961) | | | | | $ | 8,616 | | |
|
Net cash used in investing activities
|
| | | | (5,644) | | | | | | (3,816) | | | | | | (1,828) | | |
|
Net cash provided by financing activities
|
| | | | 19,255 | | | | | | 7,448 | | | | | | 11,807 | | |
|
Effect of the exchange rate on cash
|
| | | | (123) | | | | | | (60) | | | | | | (63) | | |
|
Net increase (decrease) in cash and cash equivalents
|
| | | $ | 15,143 | | | | | $ | (3,389) | | | | | $ | 18,532 | | |
140
Net Cash Provided by (Used in) Operating Activities
For the six months ended June 30, 2026, net cash provided by operating activities was $7.7 million, consisting primarily of net income of $10.2 million and $3.1 million of non-cash charges, partially offset by $5.6 million of net cash used by changes in operating assets and liabilities. The non-cash charges primarily consisted of depreciation and amortization of $2.5 million, paid in kind interest of $1.5 million, foreign currency remeasurement losses of $1.1 million, and amortization of debt discount and issuance costs of $1.1 million, partially offset by $3.8 million of unrealized and realized gains on warrant and derivative liabilities. Net cash used by changes in operating assets and liabilities primarily consisted of increases in accounts receivable of $3.9 million, prepaid expenses and other assets of $3.4 million, and inventory of $2.0 million, partially offset by changes in accounts payable and accrued expenses of $3.7 million.
For the six months ended June 30, 2025, net cash used in operating activities was $4.6 million, consisting primarily of $9.1 million of cash used by changes in operating assets and liabilities and a net loss of $0.5 million, partially offset by $5.1 million of non-cash charges. Significant non-cash charges included a $3.5 million loss on extinguishment of debt, $2.1 million of depreciation and amortization, $1.4 million of paid-in-kind interest, and $1.2 million of amortization of debt discount and issuance costs, partially offset by $4.1 million of foreign currency remeasurement gains. Cash used by changes in operating assets and liabilities was primarily driven by a decrease in accrued expenses of $5.3 million and increases in inventory of $2.3 million, accounts receivable of $1.7 million, and prepaid expenses and other assets of $1.6 million, partially offset by an increase in accounts payable of $1.7 million.
For the year ended December 31, 2025, net cash provided by operating activities was $1.7 million, consisting primarily of a net loss of $4.3 million and net cash used by changes in operating assets and liabilities of $15.3 million, fully offset by non-cash charges of $21.3 million. The non-cash charges primarily consisted of net losses on warrant and derivative liabilities of $9.4 million, depreciation and amortization of $4.4 million, loss on extinguishment of debt of $3.5 million, paid in kind interest of $2.8 million, and amortization of debt discount and issuance costs of $2.4 million, partially offset by foreign currency remeasurement gains of $4.1 million. Net cash used by changes in operating assets and liabilities primarily consisted of increases in accounts receivable of $6.6 million, inventory of $4.8 million, and changes in accounts payable and accrued expenses of $4.1 million.
For the year ended December 31, 2024, net cash used in operating activities was $7.0 million, consisting primarily of a net loss of $12.1 million and net cash used by changes in operating assets and liabilities of $8.9 million, partially offset by non-cash charges of $14.0 million. The non-cash charges primarily consisted of depreciation and amortization of $4.2 million, paid in kind interest of $3.0 million, amortization of debt discount and issuance costs of $2.9 million, and foreign currency remeasurement losses of $1.8 million, partially offset by net gains on warrant and derivative liabilities of $0.2 million. Net cash used by changes in operating assets and liabilities primarily consisted of increases in accounts receivable and inventory, in addition to changes in accounts payable and accrued expenses.
Net Cash Used in Investing Activities
During the six months ended June 30, 2026, net cash used in investing activities was $3.8 million, consisting of $3.9 million in purchases of property and equipment. During the six months ended June 30, 2025, net cash used in investing activities was $2.8 million, consisting of purchases of property and equipment.
During the year ended December 31, 2025, net cash used in investing activities was $5.6 million, consisting of $5.8 million in purchases of property and equipment, partially offset by $0.2 million in proceeds from the sale of property and equipment. During the year ended December 31, 2024, net cash used in investing activities was $3.8 million, consisting of purchases of property and equipment.
Net Cash Provided by Financing Activities
For the six months ended June 30, 2026, there were no cash flows from financing activities. During the six months ended June 30, 2025, net cash provided by financing activities was $19.2 million, consisting primarily of net proceeds of $60.0 million from the long-term debt refinance, which was partially offset by $36.5 million of payments on long-term debt and notes payable, $2.3 million of debt issuance costs, and $2.0 million of debt extinguishment costs.
141
During the year ended December 31, 2025, net cash provided by financing activities was $19.3 million, consisting primarily of net proceeds of $60.0 million from the long-term debt refinance, which was partially offset by $40.8 million of payments to repay our Loan and Security Agreement with Innovatus and debt extinguishment costs and debt financing costs. During the year ended December 31, 2024, net cash provided by financing activities was $7.4 million, constituting proceeds from the issuance of convertible promissory notes.
Off-Balance Sheet Arrangements
We did not have during the periods presented, and we currently do not have, any off-balance sheet arrangements, as defined in the SEC rules and regulations.
Critical Accounting Policies and Estimates
Management’s discussion and analysis of our financial condition and results of operations are based on our consolidated financial statements, which have been prepared in accordance with GAAP. The preparation of these consolidated financial statements requires us to make estimates and judgments that affect the reported amounts of assets, liabilities, revenues, expenses, and related disclosures. We base our estimates on historical experience, known trends and events and various other factors that we believe are reasonable under the circumstances, the results of which form the basis for making judgments about the carrying values of assets and liabilities that are not readily apparent from other sources. By their nature, these judgments are subject to an inherent degree of uncertainty. We evaluate our estimates and assumptions on an ongoing basis. Our actual results may differ from these estimates under different assumptions or conditions, and any such differences may be material.
While our significant accounting policies are described in more detail in the section titled “Notes to Financial Statements—Note 2” included in our audited and unaudited consolidated financial statements appearing elsewhere in this prospectus, we believe that the following accounting policies are those most critical to the judgments and estimates used in the preparation of our consolidated financial statements.
Revenue Recognition
We recognize revenue from sales when our performance obligations with our customers have been satisfied. In contracts with our customers, we have identified a single performance obligation to provide motion preservation products, for which revenue is recognized at a point in time.
We sell our products through a distributor network, the majority of which do not take title to the inventory but facilitate the sale to the end customer (non-stocking distributors) and others who hold inventory of our products (stocking distributors in international markets). For sales through non-stocking distributors, we have determined hospitals or ambulatory surgical centers are our customer and recognize revenue at the time the product is used or implanted. For these sales, we have determined we are the principal in the transaction as we have the ability to direct the use of our products prior to transfer to the end customer, we are responsible for fulfilling the promise to the end customer, we have latitude in establishing price and control the relationship with the end customer. Accordingly, revenues are recognized at the gross amount charged to the end customer with expense recognized for commissions paid to distributors classified as selling and marketing expenses in the Statement of Comprehensive Income (Loss). For sales through stocking distributors, we have determined the distributor is the customer and we recognize revenue upon shipment as control of the product transfers based on the contractual terms.
We invoice our customers after control of the product has transferred to the customer and invoice payments are generally due within 30 days of invoice date. In determining the transaction price, a significant financing component does not exist since the timing from when we deliver our products to when the customers pay for the products is typically less than one year. We do not have any material variable consideration, including discounts and rebates.
The nature of our products and services does not give rise to contract assets as costs are not incurred to fulfill a contract before a product or service is provided to a customer. Costs to obtain contracts are in the form of commissions paid to employees or third-party agents. We expense commissions associated with obtaining a
142
contract at the time of sale or as incurred, which is typically less than one year from the date of sale. We present these costs within selling and marketing expenses. As such, we did not have any contract assets as of June 30, 2026 and 2025.
Inventory
Inventory is recorded at the lower of cost or net realizable value. Cost is determined on a first-in, first- out basis. Our inventory is comprised primarily of finished goods available for sale.
We periodically evaluate the carrying value of inventory in relation to estimated forecasts of product demand, which takes into consideration the life cycle of product releases. When quantities on hand exceed estimated sales forecasts, we record a reserve for such excess inventory. Once inventory has been written down, it creates a new cost basis for inventory that is not subsequently written up.
Goodwill and Other Intangible Assets
Goodwill represents the excess of purchase price over the fair values of the identifiable assets acquired less the liabilities assumed in the acquisition of a business. Goodwill is not amortized but is evaluated for impairment annually or when indicators of a potential impairment are present by assessing qualitative factors or performing a quantitative analysis in determining whether it is more likely than not that the fair value of net assets is below the carrying amounts. The annual evaluation for impairment is based on valuation methods that incorporate assumptions and internal projections of expected future cash flows and operating plans. We believe such assumptions are also comparable to those that would be used by other market participants. We perform our annual impairment test of goodwill in the fourth quarter of each year.
Intangible assets, net consist of trademarks/trade names, intellectual property and surgeon relationships acquired in business combinations, which are reported at acquisition date fair value, less accumulated amortization. Intangible assets with finite lives are amortized over their estimated useful lives using either the straight-line or an accelerated method.
Unit-Based Compensation
We account for unit-based employee and nonemployee compensation arrangements in accordance with provisions of ASC, 718, Compensation—Unit Compensation. ASC 718 requires the recognition of compensation expense, using a fair-value based method, for costs related to all unit-based payments including unit options. ASC 718 requires companies to estimate the fair value of unit-based payment awards on the date of grant using an option-pricing model, which uses both historical and current market data to estimate fair value. We use the Black-Scholes option-pricing model (“Black Scholes”) to determine the fair value of options granted. Our unit-based awards are subject to service-based vesting conditions and compensation expense is recognized on an accelerated basis.
Black-Scholes requires inputs based on certain subjective assumptions, including (i) the expected volatility of the price of our common units, (ii) the expected term of the option, (iii) the risk-free interest rate and (iv) expected dividends. Due to the lack of a public market for our common unit and lack of company-specific historical and implied volatility data, we have based our computation of expected volatility on the historical volatility of a representative group of public companies with similar characteristics to us, including stage of product development and life science industry focus. The historical volatility is calculated based on a period of time commensurate with expected term assumption. We use the simplified method to calculate the expected term for options granted to employees and nonemployees whereby the expected term equals the arithmetic average of the vesting term and the original contractual term of the options due to its lack of sufficient historical data. The risk-free interest rate is based on U.S. Treasury securities with a maturity date commensurate with the expected term of the associated option. The expected dividend yield is assumed to be zero as we have never paid dividends and have no current plans to pay any dividends on our common units. Forfeitures are recognized as they occur.
Due to the absence of an active market for our common units, we utilized methodologies in accordance with the framework of the American Institute of Certified Public Accountants Technical Practice Aid, Valuation of Privately-Held Company Equity Securities Issued as Compensation, to estimate the fair value of our
143
common unit. In determining the exercise prices for options granted, we have considered the estimated fair value of the common unit as of the measurement date. The estimated fair value of the common unit has been determined at each grant date based upon a variety of factors, including the illiquid nature of the common unit, arm’s-length sales of the common units, the effect of the rights and preferences of the preferred unitholders, and the prospects of a liquidity event. Among other factors is our financial position and historical financial performance, the status of technological developments within our research, the composition and ability of the current research and management team, an evaluation or benchmark of our competition, and the current business climate in the marketplace. Significant changes to the key assumptions underlying the factors used could result in different fair values of common units at each valuation date. Following the closing of this offering, the fair market value of our Class A Common Stock will be the closing price of our Class A Common Stock on the date of grant on the primary stock exchange on which our Class A Common Stock is traded.
Recent Accounting Pronouncements
For a discussion of recent accounting pronouncements, see the section titled “Notes to Financial Statements—Note 2” included in our audited consolidated financial statements appearing elsewhere in this prospectus.
Quantitative and Qualitative Disclosures about Market Risks
Market risk is the potential loss arising from adverse changes in the financial markets. We are exposed to various market risks, which may result in potential losses arising from adverse changes in market rates, such as interest rates and foreign exchange rates. We do not enter into derivatives or other financial instruments for trading or speculative purposes and do not believe we are exposed to material market risk with respect to our cash and cash equivalents.
Interest Rate Risk
We are exposed to interest rate risks related to our cash and cash equivalents. We had cash and cash equivalents of $25.1 million as of June 30, 2026, which consisted of bank deposits and money market funds. Such interest-earning instruments carry a degree of interest rate risk; however, historical fluctuations in interest income have not been significant. We had outstanding debt of $136.1 million as of June 30, 2026. The interest rate in effect as of June 30, 2026 ranged from 4.42% to 10.78%, and a hypothetical 1.0% increase of interest rates would result in an increase in our annual interest expense of approximately $1.2 million.
Foreign currency exchange risk
We operate in countries outside of the United States and, therefore, we are exposed to foreign currency risk. Most of our direct sales outside of the United States are invoiced in local currencies, which is primarily comprised of the Euro. Operating expenses related to these sales are largely denominated in the same respective currency, thereby limiting our transaction risk exposure. We do not believe that a 10% change in foreign currency exchange rates would have a significant impact on our consolidated financial statements. We do not currently hold derivatives to hedge our exposure to foreign currency exchange rate fluctuations; however, we may choose to hedge our exposure in the future.
Emerging Growth Company and Smaller Reporting Company Status
We are an emerging growth company, as defined in the JOBS Act. The JOBS Act permits an “emerging growth company” such as us to take advantage of an extended transition period for complying with new or revised accounting standards. This provision allows an emerging growth company to delay the adoption of some accounting standards until those standards would otherwise apply to private companies. We have elected to use the extended transition period for any other new or revised accounting standards during the period in which we remain an emerging growth company; however, we may adopt certain new or revised accounting standards early. As a result, we will not be subject to the same new or revised accounting standards as other public companies that are not emerging growth companies and our financial statements may not be comparable to other public companies that comply with new or revised accounting pronouncements as of public company effective dates. The JOBS Act also exempts us from having to provide an attestation and
144
report from our independent registered public accounting firm on the assessment of our internal control over financial reporting pursuant to the Sarbanes-Oxley Act.
We will remain an emerging growth company until the earliest of: (i) the last day of the fiscal year following the fifth anniversary of the consummation of this offering; (ii) the last day of the fiscal year in which we have total annual gross revenue of at least $1.235 billion; (iii) the last day of the fiscal year in which we are deemed to be a “large accelerated filer” as defined in Rule 12b-2 under the Exchange Act, which would occur if the market value of our common stock held by non-affiliates exceeded $700.0 million as of the last business day of the second fiscal quarter of such year; or (iv) the date on which we have issued more than $1.0 billion in non-convertible debt securities during the prior three-year period.
We are also a “smaller reporting company” as defined in the Exchange Act. We may continue to be a smaller reporting company even after we are no longer an emerging growth company. We may take advantage of certain of the scaled disclosures available to smaller reporting companies and will be able to take advantage of these scaled disclosures for so long as our voting and non-voting common stock held by non-affiliates is less than $250.0 million measured on the last business day of our second fiscal quarter, or our annual revenue is less than $100.0 million during the most recently completed fiscal year and our voting and non-voting common stock held by non-affiliates is less than $700.0 million measured on the last business day of our second fiscal quarter. We cannot predict if investors will find our shares of common stock less attractive because we may rely on these exemptions. If some investors find our shares of common stock less attractive as a result, there may be a less active trading market for shares of our Class A common stock and our share price may be more volatile.
145
BUSINESS
Overview
We are a commercial-stage medical technology company with a singular mission to transform spine surgery by advancing motion-preserving solutions for the cervical and lumbar spine. We are exclusively focused on Total Disc Replacement (TDR), which we believe represents a fundamentally different and increasingly important approach to spine surgery compared to traditional fusion techniques that permanently eliminate motion. Our prodisc platform is designed to improve the long-term quality of life for patients suffering from chronic neck and back pain while preserving the spine’s natural movement. As a pure-play company dedicated solely to TDR, we believe our depth of experience, exclusive focus, and long history of clinical success uniquely position us to lead the continued evolution of spine surgery toward solutions designed to preserve motion.
Spine disorders are among the most common medical conditions in the United States, with chronic neck and back pain affecting approximately 100 million people each year. Individuals living with degenerative disc disease (DDD) represent a significant subset of this population. Surgical intervention, including spinal fusion, is commonly performed for patients with DDD, with approximately 750,000 instrumented cervical and lumbar spinal fusion procedures performed in the United States in 2025. While spinal fusion is widely utilized, it permanently eliminates motion at the treated spinal segment and alters natural spinal biomechanics. We believe a meaningful portion of these fusion procedures, approximately 275,000 annually, could instead utilize TDR. Despite this opportunity, only approximately 58,000 TDR procedures were performed in the United States in 2025, which we believe highlights the significant underpenetration of these motion preserving procedures. Based on these combined procedure volumes, average selling price of approximately $5,500 per implant and approximately 1.34 levels treated per procedure, we estimate that the total addressable market for cervical and lumbar TDR in the United States is approximately $2.5 billion. Based on data provided by Grand View Research for the TDR market and data provided by iData Research for fusion market, the TDR and fusion markets grew at an estimated compound annual growth rate (“CAGR”) of approximately 7.7% and 0.6%, respectively, from 2022 to 2025. Based on this data and our analysis and knowledge of our industry, we believe this growth trend will continue over the near to medium term.
Despite its widespread use, spinal fusion has inherent clinical limitations that we believe can contribute to less favorable outcomes for many patients. Fusion permanently eliminates movement at the treated level or levels of the cervical or lumbar spine, which can reduce patient flexibility and impact their ability to perform certain routine activities. By eliminating movement across one or more levels of the spine, the forces and stresses that would normally be distributed across the entire spinal column are instead concentrated on the adjacent, unfused segments of the spine. This altered motion and increased mechanical load on the adjacent discs may accelerate degeneration at these adjacent levels of the spine, a condition known as adjacent segment disease (ASD). Spinal lumbar fusion procedures are associated with higher rates of postoperative complications compared to TDR (Bai et. Al, Medicine, 2019). In addition, spinal fusion procedures can require longer recovery periods (Perez Albela et al, Spine, 2025), as the bone graft must fully incorporate and solidify to achieve structural stability, which can result in significant time away from work and daily activities and place a considerable burden on patients while contributing to higher indirect healthcare costs.
While TDR offers advantages over spinal fusion, some TDR offerings on the market may have drawbacks associated with their design or permitted applications. For example, some TDR implants employ a mobile core, where free translation (or disc movement) may occur upon the application of shear forces, potentially leading to instability. Some TDR implant offerings also utilize materials that may be susceptible to accelerated wear, particle generation, and long-term implant degradation. Other cervical TDR offerings include a narrow range of implant sizes and configurations and other lumbar TDR offerings include a narrow range of indications (notably lacking FDA-approved two-level lumbar TDR implants), which may limit applicability across patient populations. In addition, we believe that certain surgical instrumentation used by other TDR offerings lacks ease of use, which may result in inconsistent surgical technique, steeper learning curves for adopting surgeons, longer operative times, and an increased risk of inadequate implant positioning.
From its inception, we developed the prodisc platform using a first-principles design approach intended to preserve spinal motion in a controlled and durable manner, avoiding both the permanent rigidity of spinal fusion and potential for excessive mobility of discs. The prodisc platform has four core advantages that we
146
believe are essential for durable adoption of TDR: advanced kinematics, durable materials, a broad and configurable implant portfolio, and streamlined instrumentation.
The prodisc platform has been developed over more than 35 years as a comprehensive set of systems designed to give surgeons flexibility in addressing patient-specific anatomy, disease severity, and procedural objectives. Our portfolio includes four cervical TDR systems and one lumbar TDR system, all derived from a common motion-preserving design philosophy and supported by streamlined instrumentation. In the United States, our portfolio of five Class III devices is supported by two pre-market approval (PMA) approvals and two Panel-track PMA supplements supported by IDE clinical studies, along with 49 additional PMA supplements, reflecting a long history of successful regulatory execution and continuous product innovation. PMA-designated products require successful human trials and long-term follow-up as opposed to the majority of orthopedic devices, which are approved through the 510(k) pathway. prodisc has received FDA approval for both one-level and two-level procedures across cervical and lumbar indications, making it the only TDR platform with FDA-approved multi-level indications in both regions of the spine. Across the platform, surgeons can select from close to 100 distinct implant configurations spanning fixation methods, endplate geometries, footprint shapes, disc heights, and surgical techniques. We refer to this as our Match-the-Disc philosophy, which we believe supports optimized patient fit, broader surgeon adoption, repeat utilization, and expansion from single-region use to both cervical and lumbar applications within the same clinical practice.
Underlying the prodisc platform is our proprietary prodisc CORE Technology, a fixed-core design that is engineered to deliver stable, predictable spinal kinematics while preserving motion at the treated level. This design incorporates a fixed center of rotation and an optimized curvature that is intended to maintain natural movement while avoiding unrestricted or uncontrolled motion that can place excess stress on nearby anatomy. By balancing stability with controlled movement, we believe CORE Technology supports normal spinal biomechanics and consistent implant performance over time. This foundational technology is deployed across our cervical and lumbar systems and is complemented by time-tested implant materials, including cobalt-chromium endplates, ultra-high molecular weight polyethylene inlays, and titanium surface coatings that have been used successfully for decades in spine and large-joint arthroplasty applications.
The prodisc platform is supported by what we believe is the most extensive body of peer-reviewed clinical evidence in TDR. More than 300,000 prodisc implantations have been performed worldwide, generating real-world clinical data published in over 590 peer-reviewed clinical papers evaluating outcomes, biomechanics, and long-term performance. This evidence base spans more than 35 years and includes over 60 studies reporting extended long-term follow-up outcomes. Published data demonstrate revision rates of less than 1% for prodisc L TDR over 7 to 21 year follow-up period (Marnay et al., JBJS, 2025), radiographic motion maintenance within a normal functional range in approximately 94% of patients following prodiscL TDR (Zigler JE et al., Spine, 2007), and, in a head-to-head study against spinal fusion, approximately four-fold fewer adjacent-level surgical interventions at seven years following prodisc C TDR compared to spinal fusion (Janssen et al., JBJS, 2015). In addition, TDR studies comparing prodisc L TDR with lumbar fusion demonstrate higher (91% versus 81%) neurological success rates (Zigler JE et al., Spine, 2007) and greater long-term improvement (73% versus 60%) in disability scores (Delamarter et al., JBJS, 2011), and a TDR study comparing multiple lumbar TDR solutions with lumbar fusion showed a 48% relative reduction in the risk of reoperations (Zigler JE et al., Global Spine Journal, 2018). Robust long-term clinical success of prodisc L TDR has also been demonstrated with maintained reductions in disability and pain scores observed through up to 21 years of postoperative follow-up of 1,187 patients with chronic lumbar DDD who underwent lumbar total disc arthroplasty (Marnay et al., JBJS, 2025). We believe the breadth, duration, and consistency of this evidence support physician confidence, payor engagement, and broader adoption of TDR.
We believe the evolution of spine surgery toward motion preserving solutions mirrors historical adoption patterns observed in other large orthopedic markets, including knee, hip, and shoulder, where treatment approaches have evolved over time from fusion- or fixation-based procedures to joint-preserving or joint-replacing solutions that restore or preserve motion. In each of these markets, motion-preserving solutions ultimately became the standard of care as patient preference, clinical evidence, surgeon familiarity, and the reimbursement landscape all matured. We believe the spine market is undergoing a similar transition, with increasing acceptance of TDR as a durable, motion-preserving alternative to fusion.
We have established a scaled commercial organization dedicated exclusively to TDR, with broad reach across the United States and selected international markets. In the United States, our commercial organization
147
includes 48 sales management and clinical support professionals as of June 30, 2026, supported by more than 400 distributors, enabling engagement with the over 1,500 surgeons that performed a TDR procedure with prodisc in 2025. Internationally, we operate in 35 countries as of June 30, 2026, supported by 11 direct commercial employees and a network of stocking and non-stocking distributors. Our commercial infrastructure is complemented by structured surgeon education programs and targeted direct-to-patient initiatives designed to reduce adoption barriers, expand appropriate patient selection, and support increased utilization across both cervical and lumbar applications.
We have experienced significant growth in recent years as adoption and utilization of prodisc has accelerated. For the six months ended June 30, 2026, we generated net revenue of $85.2 million, representing increase of 42% compared to the six months ended June 30, 2025. We recognized gross margin of 82% for the six months ended June 30, 2026, compared to a gross margin of 80% for the six months ended June 30, 2025. We reported net income of $10.2 million for the six months ended June 30, 2026 compared to net loss of $0.5 million for the six months ended June 30, 2025. We also achieved Adjusted EBITDA of $15.5 million for the six months ended June 30, 2026, representing an increase of 137% compared to $6.6 million for the six months ended June 30, 2025. As of June 30, 2026, we had an accumulated deficit of approximately $188.4 million. For the year ended December 31, 2025, we generated net revenue of $132.2 million, representing growth of 39% compared to 2024. We recognized gross margin of 80% for the year ended December 31, 2025, compared to a gross margin of 77% for the year ended December 31, 2024. We had net loss of $4.3 million for the year ended December 31, 2025 compared to net loss of $12.1 million for the year ended December 31, 2024. We also achieved Adjusted EBITDA of $20.2 million for the year ended December 31, 2025, representing an increase of 241% compared to $5.9 million for the year ended December 31, 2024. Adjusted EBITDA is not a financial measure under GAAP. See the section titled “Management’s Discussion and Analysis of Financial Condition and Results of Operations—Non-GAAP Financial Measures” for an explanation of how we compute this non-GAAP financial measure and for the reconciliation to the most directly comparable GAAP financial measure.
Our Success Factors
We believe that several key factors will lead to our success in improving spine care as the leading TDR company:
Large and Growing Market Opportunity with Significant Unmet Need for Motion Preserving Spine Surgery
Approximately 750,000 instrumented cervical and lumbar spinal fusion procedures were performed in the United States in 2025, according to the Orthopedic Network News 2025 Spinal Surgery Update. While spinal fusion is widely utilized, we believe it presents important limitations for many patients because it eliminates motion at the treated spinal segment and alters natural spinal biomechanics. This alteration may contribute to ASD and increase the likelihood of additional surgical intervention over time. We believe that a meaningful portion of patients who undergo spinal fusion procedures would be better treated with TDR, which is designed to preserve motion and maintain spinal biomechanics. Approximately 58,000 TDR procedures are currently performed each year in the United States, and we estimate that approximately 275,000 spinal fusion procedures per year could be better addressed by TDR, which we believe highlights the significant underpenetration of motion preserving solutions in the spine market today. Based on these combined procedure volumes, average selling price of approximately $5,500 per implant and approximately 1.34 levels treated per procedure, we estimate our total addressable market opportunity for TDR in cervical and lumbar spine in the United States to be approximately $2.5 billion. Based on data provided by Grand View Research for the TDR market and data provided by iData Research for fusion market, the TDR and fusion markets grew at an estimated compound annual growth rate (“CAGR”) of approximately 7.7% and 0.6%, respectively, from 2022 to 2025. Based on this data and our analysis and knowledge of our industry, we believe this growth trend will continue over the near to medium term.
We believe this growth is supported by several converging factors that have created an inflection point for rapid TDR adoption, including supportive clinical evidence, increasing awareness of the benefits of motion preservation among physicians and patients, surgeon adoption and training infrastructure, payor alignment, and favorable facility and physician economics. We believe the market dynamics driving adoption of TDR are directionally consistent with the dynamics that supported adoption of motion preserving approaches in other
148
large orthopedic markets, such as hip, knee, and shoulder, where treatment approaches have evolved over time toward solutions designed to restore or preserve joint motion. We believe we are well positioned to participate in and benefit from these trends in the spine market. Additionally, as the spine market further embraces motion preserving approaches, we believe it has the potential to inform treatment decisions across a broader portion of spine surgery beyond fusion.
Broad and Deep Portfolio of Disruptive TDR Solutions to Address the Limitations of Spine Surgery
We believe we offer the broadest and deepest portfolio of differentiated solutions for TDR, designed to address what we believe is a fundamental unmet need in spine surgery: preserving spinal motion. Over more than 35 years of continuous innovation, we have developed the prodisc portfolio into a comprehensive platform that includes five TDR systems across cervical and lumbar indications, each purpose-built around the principle of preserving spinal motion. In the United States, we have prodisc products that are approved for both one-level and two-level use across cervical and lumbar indications. We believe this combination of products and indications provides the most comprehensive set of options among approved single-offering TDR solutions. Our portfolio is designed around a Match-the-Disc philosophy, and provides surgeons with close to 100 combinations of fixation methods, endplate geometries, footprint shapes, implant heights, and surgical techniques, allowing the surgeon to tailor implant selection to individual patient anatomy and procedural objectives rather than rely on a single standardized design. Our systems are supported by a streamlined set of instrumentation designed to reduce procedural complexity and support reproducible workflows across care settings. We believe this combination of portfolio breadth, configurability, and operational simplicity supports consistent surgeon experience, repeat utilization, and long-term platform durability. As a pure-play company dedicated to TDR with multiple systems approved across anatomies and indications, and a broad set of configurable options, we believe we provide a true one-stop platform for TDR, positioning us to be the leading provider to spine surgeons as awareness and adoption of motion preservation continues to expand.
Proprietary prodisc CORE Technology Platform Underpins Portfolio Differentiation
The prodisc portfolio is built on our prodisc CORE Technology platform, which incorporates a fixed center of rotation and intentionally designed curvature to maintain stable, natural motion at the treated spinal segment. This fixed-core design is intended to preserve normal spinal biomechanics while avoiding unrestricted or uncontrolled movement at the treated level. Managing excessive movement is an important design objective, as increased stress on nearby anatomy from such movement may contribute to joint degeneration over time. The curvature radius of the disc is a critical design parameter, as both undersized and oversized disc cores can result in abnormal movement patterns, including unwanted contact between spinal structures or excessive motion. The prodisc CORE addresses these challenges through an optimized curvature radius designed to support stable, predictable kinematics. This technology is a foundational element of the prodisc platform and is incorporated consistently across all cervical and lumbar systems, enabling a unified motion-preservation approach. Additionally, prodisc implants utilize time-tested materials, including cobalt-chromium endplates, ultra-high molecular weight polyethylene inlays, and titanium surface coatings, which have been used successfully in large joint implants and TDR for decades. We believe this combination of differentiated fixed-core technology with optimized kinematics and proven materials underpins the durability, consistency, and portfolio-wide differentiation of the prodisc platform.
Substantial Body of Peer Reviewed Clinical Evidence Prove Benefits for Patients
We believe our portfolio is the most studied TDR system in the world, supported by a substantial and durable body of peer-reviewed clinical evidence generated from more than three decades of clinical use. The safety and efficacy of our key cervical and lumbar TDR systems have been evaluated through prospective clinical studies, randomized studies, and other peer-reviewed research across a range of indications and patient populations. In addition, more than 300,000 implantations have been performed worldwide using the prodisc platform, resulting in extensive real-world clinical data sets that have been published in over 590 peer-reviewed clinical papers evaluating outcomes, biomechanics, and long-term performance. This body of evidence includes numerous long-term follow-up publications, including over 60 studies reporting extended follow-up outcomes. Published data demonstrate revision rates of less than 1% for prodiscL TDR over 7 to 21 year follow-up period (Marnay et al., JBJS, 2025), radiographic motion maintenance within a normal functional range in approximately 94% of patients following prodiscL TDR (Zigler JE et al., Spine, 2007), and, in a head-to-head
149
study against spinal fusion, approximately four-fold fewer adjacent-level surgical interventions at seven years following prodisc C TDR compared to spinal fusion (Janssen et al., JBJS, 2015). In addition, TDR studies comparing prodisc L TDR with lumbar fusion demonstrate higher (91% versus 81%) neurological success rates (Zigler JE et al., Spine, 2007) and greater long-term improvement (73% versus 60%) in disability scores (Delamarter et al., JBJS, 2011), and a TDR study comparing multiple lumbar TDR solutions with lumbar fusion showed a 48% relative reduction in the risk of reoperations (Zigler JE et al., Global Spine Journal, 2018). Robust long-term clinical success of prodiscL TDR has also been demonstrated with maintained reductions in disability and pain scores observed through up to 21 years of postoperative follow-up of 1,187 patients with chronic lumbar DDD who underwent lumbar total disc arthroplasty (Marnay et al., JBJS, 2025). Reported perioperative outcomes in a published study include shorter operative times of approximately 40%, lower blood loss of approximately 30%, and shorter hospital stays of approximately 24% for prodiscL TDR compared with spinal fusion (Delamarter et al., JBJS, 2011). These findings represent selected examples from a much broader body of published clinical evidence supporting prodisc. We believe the scale, duration, and depth of this clinical evidence base provide important support for physician confidence, payor engagement, and broader adoption. For additional detail on the peer-reviewed articles discussed above, please see section titled “—Relevant Peer-Reviewed Publications.”
Significant Regulatory Barriers to Entry Supported by PMA and PMA Supplement Approvals, and Robust IP
We believe we have the most comprehensive PMA-approved portfolio of TDR systems in the United States, supported by extensive regulatory experience and a robust intellectual property portfolio. TDR systems are regulated as Class III medical devices, which are deemed by the FDA to pose the greatest risks to patients and thus require approval through a PMA. Our product portfolio includes four cervical TDR systems and one lumbar TDR system. In addition, our portfolio includes products with approvals for both single-level and two-level procedures in cervical and lumbar indications, which required additional long-term data generation to support approval. We have received two pre-market approval (PMA) approvals and two Panel-track PMA supplements supported by IDE clinical studies, along with 49 additional PMA supplements, which have enabled meaningful portfolio advancement through indication expansion, product design evolution, and manufacturing updates. We believe this history demonstrates deep institutional expertise in successfully navigating the PMA process. The PMA process typically involves multi-year clinical studies, extended patient enrollment and follow-up periods, and comprehensive FDA review of clinical data, manufacturing processes, and quality systems. This process can take more than five years from study design to approval, creating significant barriers to entry for new market participants. In addition, we have proactively protected our product portfolio through intellectual property, with approximately 32 issued and pending patents and patent cooperation treaty filings. We believe the breadth of our PMA approved devices, the scale of our PMA supplements, and our intellectual property portfolio collectively create durable regulatory barriers to entry and support the long-term sustainability of our TDR platform.
Established Commercial Organization with Broad Customer Reach
We have one of the largest commercial organizations primarily dedicated to TDR, providing broad customer reach and market access across the United States and internationally. In the United States, our commercial presence includes a sales management team of 46 professionals supported by more than 400 distributors, enabling targeted engagement with the more than 3,100 surgeons who have performed a TDR procedure in the last two years nationwide. As of June 30, 2026, our products were used by 1,736 surgeons in the United States who performed at least one TDR procedure with prodisc in the preceding four quarters, representing an increase of 33% compared to June 30, 2025. As of December 31, 2025, our products were used by 1,541 surgeons in the United States who performed at least one TDR procedure with prodisc in the preceding four quarters, an increase of 38% compared to December 31, 2024, reflecting broad adoption of our portfolio. Internationally, we maintain a sales management team of 11 professionals supported by distributors across 35 geographies, providing access to key international markets. We believe the scale, focus, and reach of our commercial organization support efficient surgeon targeting, consistent clinical and technical support, and broad market access, and are important contributors to our ability to expand adoption of TDR and support continued growth.
150
Established Reimbursement with Favorable Site-of-Care Economics
TDR benefits from established and increasingly supportive reimbursement across sites of care, which has reduced patient access barriers and supports broader adoption. In the United States, reimbursement coverage for cervical TDR is well established, with commercial payor coverage policies covering a near-universal percentage of covered lives for both one-level and two-level procedures. Coverage for lumbar TDR is also broadly available, including coverage policies covering approximately 95% of covered lives for one-level procedures and approximately 45% of covered lives for two-level procedures. These include commercial payor coverage policies that have positive coverage or have not issued negative coverage for cervical and/or lumbar TDR. In addition to coverage, most TDR procedures are supported by favorable facility economics relative to spinal fusion across sites of care, including inpatient, hospital outpatient, and ambulatory surgery center settings. As surgical procedures continue to migrate toward lower-cost outpatient settings, we believe the ability to perform TDR across multiple sites of care further enhances its economic attractiveness to care providers. Taken together, we believe the widespread availability of reimbursement coverage across covered lives, the expansion of multi-level indication reimbursement, and favorable site-of-care economics provide an important foundation for sustained utilization and continued growth of TDR.
Experienced Management Team with Track Record of Value Creation
Our experienced management team has a demonstrated track record of value creation across the medical device and spine sectors, with experience spanning company building, strategic transactions, and operational execution. Members of our senior leadership team have been involved in growing spinal and broader medical device businesses through a range of strategic initiatives, including public and private company sale transactions, strategic equity investments, and significant acquisitions and integrations. In addition, our team brings deep experience across the full product lifecycle, including product development, operations, clinical study design and execution, regulatory strategy and engagement with regulatory authorities, and the successful commercialization and launch of new products, including Class III devices. Our leadership team has also managed and scaled both direct and distributor-based commercial organizations across domestic and international markets. We believe this combination of strategic, regulatory, operational, clinical, and commercial expertise supports effective execution and long-term value creation as we continue to scale our TDR platform.
Our Growth Strategies
We intend to pursue the following growth strategies to expand our leadership as a pure-play TDR platform
Expand Surgeon Education and Training on prodisc TDR
We estimate that approximately 7,300 spine surgeons in the United States routinely treat degenerative disc disease and have patient populations that could benefit from TDR, yet only approximately 3,100 of these surgeons have performed at least one TDR procedure within the past two years. Among those surgeons with experience, the vast majority, or approximately 85%, perform TDR procedures infrequently, with fewer than one procedure per month. We believe this gap between surgeons who treat degenerative disc disease, those who infrequently use TDR, and those who are active, high volume users is driven primarily by limited procedural comfort and conservative, narrow interpretations of patient eligibility criteria. Our experience indicates that structured surgeon education focused on patient selection, procedural proficiency, and expanded clinical use cases can meaningfully influence surgeon behavior. For example, in 2025, approximately 800 surgeons participated in one of our training programs in the U.S., representing an increase of approximately 23% compared to 2024. Of the surgeons who participated in one of our training programs in 2025, approximately 70% have performed at least one prodisc procedure since completing training. As a result, we intend to continue investing in surgeon education initiatives designed to expand awareness, clinical confidence and appropriate patient selection for TDR, including cadaveric bioskills courses, symposia, peer-to-peer education, and other training programs. In parallel, we plan to continue investing in distributor education initiatives, including our “Winning with prodisc” program, which we believe enhances distributor effectiveness in engaging and supporting surgeons. Through these combined efforts, we aim to broaden the base of surgeons trained and active in TDR and to support continued expansion of prodisc adoption, with the ultimate goal of establishing prodisc as the standard of care.
151
Increase Utilization and Broaden Use Among our Existing Surgeon Base
We believe increasing utilization among our existing surgeon base represents a significant opportunity to drive durable growth. As of June 30, 2026, our products were used by 1,736 surgeons in the United States in the preceding four quarters, of whom 334 surgeons would be classified as high volume users because they performed twelve or more TDR procedures with prodisc in the preceding four quarters. In the year ended December 31, 2025, 1,541 surgeons performed a TDR procedure using prodisc; however, only 284 of these surgeons would be classified as high volume users, defined as performing twelve or more prodisc procedures during the year. While the number of high volume users has almost doubled over the past two years, we believe there remains a meaningful opportunity to move a larger portion of our surgeon base further along the adoption curve. Our experience indicates that as surgeons increase procedure frequency, they tend to expand patient selection, utilize TDR across a broader set of indications, and deepen their engagement with our platform. In addition, a number of surgeons currently use prodisc in either cervical or lumbar procedures but not both, representing an opportunity to expand utilization across anatomies. To support deeper adoption, we intend to continue investing in targeted education and clinical support initiatives focused on patient selection, identification of appropriate use cases, and expansion of utilization across cervical and lumbar applications. We believe these efforts can increase procedure frequency among existing users, broaden portfolio utilization, and support sustained growth driven by repeat adoption.
Expand and Scale Our U.S. Commercial Organization
We intend to expand and scale our U.S. commercial organization to support continued growth, build on our consistent execution, and deliver high-quality service to surgeons and distributors as adoption of prodisc expands. We plan to continue building out our internal commercial infrastructure by selectively adding regional sales managers, district sales managers, clinical account managers, and market development managers to enhance geographic coverage, surgeon engagement, deepen care site access, and provide consistent clinical and technical support across our customer base. In parallel, we intend to further optimize our distributor network by strengthening coverage in underpenetrated geographies, improving alignment and performance standards, and rationalizing or exiting underperforming distributor relationships where appropriate. We also intend to continue investing in instrument set availability and deployment to ensure timely case coverage and maintain our best-in-class service as adoption and procedure volumes expand. We believe this balanced approach to commercial expansion will allow us to scale efficiently, support increasing surgeon adoption and utilization, and maintain disciplined growth in a capital-efficient manner.
Continue to Invest in Product Portfolio Expansion and Evidence Generation
We intend to continue investing in research and development to enhance our existing product offerings, expand our portfolio, and add new capabilities designed to broaden the patient populations that can be addressed with TDR. In the near-term, we plan to advance additional sizing options for both cervical and lumbar applications, develop new and updated instrumentation to support procedural efficiency and reproducibility, and invest in enabling technologies intended to assist surgeons with implant selection and procedural consistency. We also intend to pursue additional clinical and regulatory initiatives to expand indications, including hybrid (TDR adjacent to fusion) and additional two-level approvals across our cervical portfolio, primarily through PMA supplements. Over the longer term, we plan to continue developing market-enhancing products, new technologies, and expanding indications supported by clinical evidence consistent with our motion preservation philosophy, with the objective of expanding addressable patient populations, supporting broader surgeon adoption, and reinforcing the durability of our product platform. We believe this disciplined approach to portfolio expansion and evidence generation supports sustained long-term growth as motion preservation becomes available for a wider set of patients and indications.
Increase Patient Awareness Through Targeted Direct-to-Patient Education Initiatives
Our direct-to-patient awareness and education program has the mission of changing the way spine surgery is perceived and empowering patients who suffer from neck and back pain to pursue proven surgical options. We intend to continue investing in direct-to-patient education initiatives designed to increase awareness and benefits of TDR, including the benefits of motion preservation. Our strategy is centered on the rediscover platform, a patient education and support platform that provides prospective patients with educational
152
content, procedural information, patient testimonials, and access to patient advocates who share their experiences with prodisc. We also intend to continue supporting patient education through informational materials made available on physician practice websites and within physician offices, which are designed to increase patient awareness and understanding of TDR. We will also invest in targeted digital outreach and public awareness initiatives to drive engagement with this platform earlier in the patient care pathway, as well as invest in public awareness campaigns with our key patient ambassadors. We believe these efforts support informed patient consultations, reinforce surgeon adoption by generating patient demand, and complement our surgeon education and commercial initiatives by creating a demand-pull dynamic that supports broader adoption of TDR.
Pursue Disciplined International Expansion in Selected Markets
Approximately 15% and 16% of our revenue was derived from markets outside of the United States for the six months ended June 30, 2026 and the year ended December 31, 2025, respectively. We have established our international presence over many years with a dedicated team building local commercial infrastructure, distributor and surgeon relationships, and market-specific expertise. We believe this foundation positions us well to continue competing effectively and expanding adoption of TDR in these geographies. In markets where we already operate, we seek to deepen penetration by leveraging our existing relationships and experience through increased commercial engagement and surgeon education, and we expect to continue to assess and improve our commercial model over time. As we continue to scale, we also intend to pursue disciplined international expansion into additional selected markets where we believe healthcare infrastructure, medical education, reimbursement dynamics, and long-term market potential support adoption of our motion preservation technologies. We believe our experience operating across diverse international markets, combined with a measured approach to market selection and investment, positions us to expand internationally while maintaining operational and financial discipline.
Industry Background
Spine Anatomy
The spine is a large, complex and important anatomical structure that acts as the body’s main structural support, facilitates balance, sensation and movement, and protects the spinal cord. The spine consists of interlocking bones, called vertebrae, stacked on top of one another, extending from the base of the skull to the pelvis. Vertebrae are separated from each other by intervertebral discs and are connected to each other by facet joints, which provide constraint. Supportive soft tissues, including ligaments, tendons and muscles, are attached to two laminae that stabilize the vertebral segment. The spinal cord runs through the center of the spine, or spinal canal, carrying nerves that exit through openings between the vertebrae and deliver sensation and control to the entire body.
There are three primary segments of the spine: the cervical, thoracic and lumbar segments. The cervical segment consists of the first seven vertebrae (C1-C7) that extend from the base of the skull to the shoulders and facilitate movement of the head and neck. The thoracic segment consists of the 12 vertebrae in the middle of the back (T1-T12) and each vertebra in this region is connected to two ribs that protect the body’s vital organs. The lumbar segment consists of five vertebrae in the lower back (L1-L5) and is the primary load-bearing region of the spine. In addition to the primary segments, the other two regions of the spine, the sacrum (S1-S5) and coccyx, consist of naturally fused vertebrae connected to the hip bones to provide support and protect organs in the pelvic area. The L5-S1 joint, which connects the L5 and S1 vertebrae, is also commonly referred to as a lumbar segment. The images below depict the segments and a cross section of the spine:
153
| |
Sections of the Human Spine
|
| |
Vertebral Body & Spinal Disc Anatomy
|
|
| |
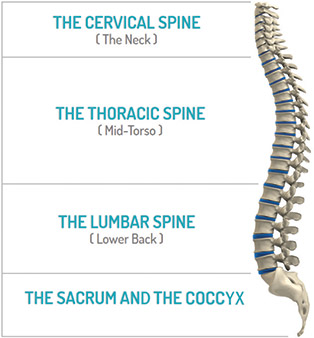
|
| |
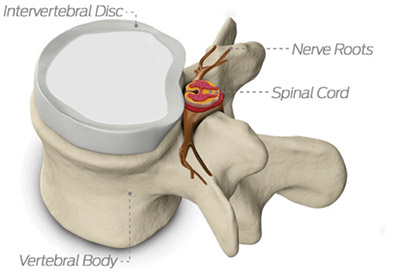
|
|
Spine Disorders
Spine disorders are one of the most common medical conditions in the United States, with chronic neck and back pain affecting approximately 100 million people according to the National Spine Health Foundation. The symptoms of spine disorders range in severity from mild pain and loss of feeling to extreme pain and paralysis. These disorders are primarily caused by degenerative disc disease (DDD), stenosis, deformity, osteoporosis, tumors and trauma, and contribute to rising healthcare costs. In the United States, back pain results in an estimated $250 billion in healthcare costs and lost productivity annually, according to the National Spine Health foundation.
Degenerative Disc Disease
DDD is a condition that can result when the intervertebral discs break down due to age, injury or wear and tear. DDD can result from the normal aging process and as the inner cores of intervertebral discs dehydrate, lose elasticity and shrink. Over time, this disc dehydration can cause the discs to lose their normal height, leading to nerve root compression, which in turn leads to pain and reduced flexibility. The continued progression of DDD often results in worsening symptoms as disc degeneration can initiate a negative reinforcement cycle by damaging vertebral endplates, compressing nerve roots and impairing nutrient supply, leading to accelerated disc deterioration. DDD can cause debilitating pain, physical and psychological disability, and a reduced ability to work, significantly impacting quality of life for people with the condition. DDD can occur in any region of the spine; however, it is most common in the cervical and lumbar regions. Cervical disc disease generally refers to deterioration of the discs in the neck, whereas lumbar disc disease generally refers to deterioration of the discs in the lower back. DDD often affects two or more adjacent discs, or intervertebral levels. In general, multi-level disease exhibits a similar pathology to single level disease and is treated via similar surgical techniques and technologies. The image below depicts a healthy intervertebral disc and an intervertebral disc with DDD:
154
Spinal Disc Anatomy—Healthy Disc Compared to Degenerated Disc
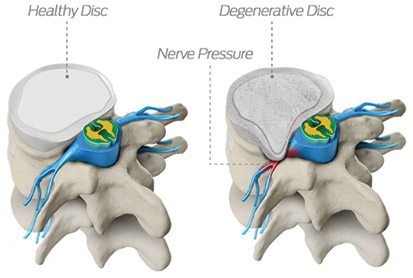
Treatments for DDD
Treatment alternatives for DDD range from conservative, non-surgical therapies to surgical interventions, each addressing different phases of disease progression and patient needs.
Non-Surgical and Minimally Invasive Surgical Intervention
DDD is typically first managed with non-surgical and minimally invasive treatments. These methods usually involve a combination of physical therapy, medications for pain relief, injected therapeutics, spinal cord stimulators, and changes in daily habits and lifestyle modifications, all aimed at slowing progression of the disease and managing symptoms before resorting to more invasive treatments. However, these conservative approaches primarily focus on relieving pain and other symptoms rather than addressing or correcting the underlying structural damage to the disc. As the condition of the disc worsens, the loss of disc height and the resulting instability in the affected joint can become permanent, leading to increased damage and pain that may ultimately necessitate surgical treatment.
Surgical Intervention
When non-surgical interventions fail to adequately improve a patient’s quality of life, surgical interventions may be used to treat the pain. Surgical treatments can be instrumented, which include the use of implants, or non-instrumented, which forego the use of any such implants. The most common instrumented treatments for DDD include: (i) spinal fusion, a procedure in which two or more adjacent vertebrae are connected together with implants to restore disc height, relieve nerve root compression, and provide stability, and (ii) total disc replacement (TDR), a procedure in which the damaged disc is replaced with a motion-preserving implant to restore disc height, relieve nerve root compression, provide stability as well as preserve motion. For decades, orthopedic solutions for degenerated joints (e.g. hips, knees and vertebrae) focused on the fixation and fusion of the respective joints. As a result, spinal fusion is the most common instrumented surgical treatment for DDD. As orthopedic solutions in other areas have advanced over time to facilitate motion (i.e. knee and shoulder), we believe that clinical research and surgical treatment of DDD increasingly focuses on motion preservation as well.
Spinal Fusion
Spinal fusion involves permanently fusing together two or more levels of the spine to eliminate motion between the vertebrae or to realign them. Spinal fusions are typically performed on the cervical or lumbar regions of the spine, and implants may include devices such as plates, pedicle screw and rod systems and interbody spacers. The two main types of cervical spinal fusion include anterior cervical discectomy and fusion (ACDF) surgery and posterior fusion. ACDF surgery is the most common cervical fusion approach in which the spine is accessed via an anterior approach and typically includes the use of an integrated interbody device implemented along with a plate for supplemental fixation. Posterior fusion is a less common surgery in which the spine is accessed via a posterior approach and typically includes the use of pedicle screws, rods, cross
155
connectors and bone graft. The two main types of lumbar spinal fusion include posterolateral fusion surgery and interbody fusion surgery.
We believe cervical and lumbar spinal fusion procedures are clinically limited compared to TDR in several ways, including:
•
Reduced range of motion—Fusion permanently eliminates movement at the treated level or levels of the cervical or lumbar spine. This permanent fixation of the joint alters normal biomechanics and reduces the patient’s flexibility, which may impact the patient’s ability to perform certain routine physical activities (Marnay et al., JBJS, 2025).
•
Longer recovery time—Spinal fusion may require a longer recovery period as post-operative protocols commonly include immobilization and activity restriction to support the fusion process. In a systematic review and meta-analysis of 16 randomized controlled trials comparing cervical TDR to ACDF, patients undergoing TDR returned to work an average of 10 days sooner and had significantly greater odds of returning to work during the first postoperative year (Perez-Albela et al, Spine, 2025).
•
Increased reoperation rates—By removing movement across one or more levels, the forces and stresses that would normally be distributed across the entire spinal column are instead concentrated on the adjacent, unfused segments. The altered motion and increased mechanical load on the adjacent discs may accelerate disc degeneration at adjacent spinal levels, a condition known as adjacent segment disease (ASD). A prospective, multicenter, randomized controlled FDA IDE trial comparing prodisc C cervical TDR with ACDF demonstrated approximately four-fold fewer adjacent-level surgical interventions at seven years (Janssen et al., JBJS, 2015).
•
Higher complication rates—We believe spinal fusion procedures are associated with higher rates of post- operative complications compared to TDR. According to a systematic review and meta-analysis of six randomized controlled trials comparing lumbar TDR with lumbar fusion, patients undergoing TDR experienced approximately 56% lower risk of complications compared with fusion (Bai et al., Medicine, 2019).
Total Disc Replacement (TDR)
Total disc replacement is the replacement of the damaged disc with a motion-preserving implant. TDR is a form of motion preservation surgery used in a variety of disease states for degenerative discs. It is currently more commonly performed as an alternative to spinal fusion, especially in the cervical region of the spine where the correction of multiple levels is sometimes required. TDR is becoming increasingly common in treating cervical and lumbar degenerative diseases, as it can preserve more natural biomechanics and maintain mobility. In contrast to cervical spinal fusion, which has been shown to result in increased pressure in adjacent disc spaces, TDR has not been shown to produce similar adjacent-level disc pressure (Delamarter et al., Spine, 2013). The implant in TDR usually consists of a middle synthetic material, acting as an artificial disc. This artificial disc is inserted between two metal components anchored into the vertebral bodies, securing the assembly between vertebrae.
We believe that TDR has many advantages over spinal fusion that in many cases can help to deliver more optimal treatment for patients suffering from DDD and a more cost-effective solution for the healthcare system:
•
Preservation of motion—TDR allows for the motion of the spine to be preserved in the spinal section where the implant has been placed (Marnay et al., JBJS, 2025). We believe this ability to preserve motion, which can help to minimize adjacent segment degeneration (Janssen et al., JBJS, 2015), represents an important advantage for patients seeking to preserve spinal function and motion while treating DDD.
•
Superior patient outcomes—In a prospective, randomized, multicenter FDA IDE clinical trial evaluating patients with lumbar DDD, those treated with prodisc L TDR at one-level demonstrated significantly higher neurological success than those treated with lumbar fusion (91% vs. 81%) at 24 months (Zigler JE et al., Spine, 2007). In a subsequent analysis from the same FDA IDE clinical trial, patients treated with prodisc L TDR at two-levels experienced greater long-term improvement in disability, with 73% achieving Oswestry Disability Index (ODI) success compared with 60% of fusion
156
patients (Delamarter et al., JBJS, 2011). We believe that the ability of TDR to preserve spinal motion and biomechanics contributes to these better long-term outcomes.
•
Lower reoperation rates—By maintaining motion at the treated level, TDR can reduce the incidence of ASD, a complication of spinal fusion that may necessitate additional surgeries (Janssen et al., JBJS, 2015). According to a systematic review and meta-analysis of six randomized controlled trials comparing lumbar TDR with lumbar fusion, patients undergoing TDR experienced approximately 56% lower risk of complications compared with fusion (Bai et al., Medicine, 2019). Another systematic review and meta-analysis from randomized controlled trials comparing lumbar TDR 5-year outcomes with lumbar fusion over a similar time period found a 48% reduction in reoperation risk for TDR (Zigler JE et al., Global Spine Journal, 2018). These findings suggest the durability of TDR and its potential to slow the rate of adjacent-level disease.
•
Faster recovery times—TDR patients may experience shorter recovery periods and quicker return to normal activities because the procedure preserves the spine motion and avoids immobilization and activity restriction commonly required in fusion (Perez-Albela et al, Spine, 2025). Reported perioperative outcomes from a prospective, randomized, multicenter FDA IDE clinical trial comparing prodiscL lumbar TDR with lumbar fusion for two-level indications include lower blood loss of approximately 30% for TDR and shorter hospital stays of approximately 24% for prodisc L TDR (Delamarter et al., JBJS, 2011). According to a systematic review and meta-analysis of 16 randomized controlled trials comparing cervical TDR to ACDF, patients undergoing TDR have significantly higher odds of returning to work at six weeks, three months, and one year postoperatively compared with fusion and can return to work on average 10 days earlier (Perez-Albela et al, Spine, 2025).
•
High patient satisfaction—Patients who undergo TDR consistently report greater satisfaction than fusion patients in clinical studies. For example, a systematic review and meta-analysis of six independent randomized controlled trials comparing lumbar TDR with lumbar fusion demonstrated that lumbar TDR was associated with significantly greater patient satisfaction than lumbar fusion (Bai et al., Medicine, 2019).
•
Superior procedure economics—Reduced reoperations, shorter recovery periods, and lower long-term healthcare utilization generally result in more favorable overall cost-effectiveness. According to a trial-based cost-effectiveness analysis of a prospective, randomized, multicenter FDA IDE trial comparing prodisc C cervical TDR with ACDF over a 7-year follow-up, a probabilistic modeling analysis predicted approximately 30% lower payor costs over a seven-year period for single-level TDR versus fusion, resulting primarily from reduced rates of secondary surgical intervention (Radcliff et al., Journal of Neurosurgery: Spine, 2016).
We believe that while TDR offers many advantages over spinal fusion in the treatment of DDD, other TDR offerings on the market may have drawbacks. These include:
•
Unconstrained mobile core—Implant design influences how motion is restored and how loads are transferred across the spine (Rousseau M, et al, Spine. 2008). Other TDR offerings generally rely on an unconstrained mobile-core disc prostheses, which can permit independent translation and can adopt multiple centers of rotation. Under shear loading, unconstrained prostheses do not resist shear through the implant itself, instead relying on the facet joints and surrounding spinal structures to resist these forces (Sears, R., et al., Seminars in Spine Surg, 2006). This study is a non-clinical analysis of the biomechanical principles and kinematics underlying the normal spine and non-device specific TDR.
•
Inadequate materials— A material science non-clinical article reviewing some of the common materials used in cervical TDR devices indicated that some other TDR implant designs utilize bearing materials that may generate wear debris over time, which has been associated with inflammatory reactions, osteolysis, implant loosening, and potential device failure (Pham, M. H., et al., BioMed Research International, 2015). In head-to-head studies that compare different TDR devices, some other implant offerings may yield less than optimal results, including revision rates (Scott-Young, M, et al., European Spine Journal, 2022; Nunley, P, et al., International Journal of Spine Surgery, 2025). These studies are not based on IDE trials, rather they are limited retrospective comparisons based on patient follow-up and reported complaint data.
157
•
Limited breadth of implant portfolio—Based on our review of marketing materials, Surgical Technique Guides (“STGs”) or Instructions for Use (“IFUs”), we believe that other competing TDR systems have an implant portfolio with a limited breadth of approved implant options.
•
Limited lumbar indications—Based on our review of marketing materials, STGs or IFUs, we believe that the only other lumbar TDR system currently available in the United States does not have the FDA-approved two-level lumbar TDR.
•
Complex instrumentation process—Early cervical TDR systems may be more difficult to assemble and implant.
Large, Underpenetrated, Fast-Growing Market Opportunity for TDR
The surgical treatment of degenerative disc disease (DDD) presents a significant and expanding opportunity within the global spine market. Based on data from the Orthopedic Network News 2025 Spinal Surgery Update, approximately 750,000 instrumented cervical and lumbar fusion procedures were performed in the United States in 2025. We believe this large procedural base represents a significant opportunity for TDR. Our initial market focus is on patients who we believe can be most effectively treated by our TDR technologies. Most targeted fusion procedures are for patients eligible for motion-preserving technology through an anterior surgical approach. Fusion procedures generally considered ineligible for TDR include, among others, cases involving trauma, severe facet joint disease or degeneration, osteoporosis or elevated risk of osteoporosis (defined as a DEXA T-score of -1.5 or lower), and certain types of cancer. Based on our analysis of the subset of spinal fusion procedures performed with an anterior approach as well as the clinical profile of patients eligible for TDR, we estimate that approximately 275,000 of these 750,000 annual instrumented cervical and lumbar fusion procedures could be addressable by TDR. In addition to these fusion procedures that we believe can be addressed by TDR, according to data from the Orthopedic Network News 2025 Spinal Surgery Update, approximately 58,000 TDR procedures were performed in the United States in 2025, which we believe highlights the significant current under penetration of TDR. Based on these combined procedure volumes, average selling price of approximately $5,500 per implant and approximately 1.34 levels treated per procedure, we estimate our total addressable market opportunity for TDR in cervical and lumbar spine in the United States to be approximately $2.5 billion, of which approximately two-thirds is in cervical spine and approximately one-third is in lumbar spine.
Based on data provided by Grand View Research for the TDR market and data provided by iData Research for fusion market, the TDR and fusion markets grew at an estimated compound annual growth rate (“CAGR”) of approximately 7.7% and 0.6%, respectively, from 2022 to 2025. Based on this data and our analysis and knowledge of our industry, we believe this growth trend will continue over the near to medium term. We believe this growth is supported by several converging factors that have created an inflection point for rapid TDR adoption, including clinical evidence, growing patient awareness, surgeon adoption and training infrastructure, payor alignment, and favorable facility and physician economics. We also believe that market dynamics are directionally consistent with historical adoption patterns of motion preservation approaches observed in other large orthopedic markets, such as hip, knee, and shoulder arthroplasty, where treatment approaches evolved over time from a single solution phase toward multiple implant options which became the preferred standard of care. We believe the market for TDR will follow a similar trend and that we are well positioned to participate in and benefit from this transition.
Additionally, we believe there also exists an opportunity outside of the United States to address the unmet need in the surgical treatment of DDD. We have a developing commercial presence internationally, selectively operating across 34 markets with sales channels spanning direct, hybrid agent, and indirect distributor models in regions including EMEA, Asia-Pacific, and Latin America. Our international growth strategy is focused on leveraging our clinical evidence and outcomes data to gain market share in established markets, expanding surgeon education on TDR in underpenetrated geographies such as Southeast Asia, Latin America, and the Middle East.
Our Technology Platform and Products
We believe we offer the broadest and deepest portfolio of clinically proven and differentiated solutions for TDR. We are dedicated exclusively to advancing motion-preserving solutions with our prodisc technology.
158
The prodisc platform is the most comprehensive TDR platform and is supported by two pre-market approval (PMA) approvals and two Panel-track PMA supplements supported by IDE clinical studies, along with 49 additional PMA supplements spanning cervical and lumbar solutions for patients suffering from degenerative disc disease. The prodisc platform is organized to achieve defined treatment objectives: eliminating pain, providing stability, restoring function, and preserving motion across the entire spinal column. The prodisc platform achieves this through:
•
Advanced kinematics—The foundation of the prodisc platform is prodisc CORE, a novel application of the ball-and-socket design with a fixed center of rotation and an optimized curvature radius. Together, these two critical design features uniquely provide stability, resist shear forces, and facilitate controlled motion to protect the facet complex at the treated level. The fixed nature of the core helps ensure the center of rotation remains stable throughout the life of the implant.
•
Durable materials—prodisc systems are constructed from time-tested, trusted materials with a proven track record in spine TDR and decades of success in large joint replacements.
•
Broad portfolio offering—Our portfolio features four distinct cervical systems and a lumbar system with multiple anatomical variations. Notably, prodisc is the only TDR platform to achieve FDA approval for both single- and two-level indications in the cervical and lumbar spine. Engineered with multiple size and height variations and endplate designs to precisely match the targeted vertebral level, the platform provides surgical optionality resulting in close to 100 configurations based on the combination of fixation methods, endplate geometries, footprint shapes and sizes, and disc heights. The multi-level capabilities and device variations enable surgeons to Match-the-Disc to address diverse patient anatomies, varying degrees of disease severity, and individual surgeon preferences.
•
Streamlined instrumentation—The prodisc platform is supported by simplified, streamlined instrumentation, with just one instrument set supporting all configurations for the majority of our cervical portfolio, and one set supporting all configurations for our lumbar portfolio. This instrumentation model is designed to reduce procedural complexity and support reproducible workflows across hospital and ambulatory surgery center settings.
Our Solution: The prodisc TDR Technology Platform
Developed as a differentiated TDR platform to enable predictable, controlled motion while maintaining spinal stability, prodisc has proven to be a highly effective solution to treat the root cause of neck and back pain and preserve motion for the patient. Patients treated with prodisc C TDR have been shown to be four times less likely to require subsequent spine surgery at seven years compared to patients treated with ACDF, and ACDF patients had approximately three to four times higher risk of adjacent-level surgery compared to TDR patients. Our prodisc TDR revision rate of less than 1% across more than 300,000 implantations worldwide compares favorably to revision rates of hip and knee arthroplasty, where revision rates within 20 years are approximately 15% and 10%, respectively. With 590 published clinical papers, we believe prodisc is the most extensively studied TDR technology in the world.
159
prodisc CORE Technology
| |
The foundation of our prodisc platform is prodisc CORE, a standardized ball-and-socket mechanism designed to preserve physiologic motion. prodisc CORE consists of an ultra-high molecular weight polyethylene, or UHMWPE, inlay that is fixed to the inferior endplate of the device. prodisc endplates are constructed from cobalt chromium molybdenum, or CoCrMo, alloy, with a titanium plasma spray, or TPS, surface coating to promote bone adherence and long-term fixation. The superior endplate articulates on the convex surface of the core, enabling motion that is both controlled and biomechanically consistent across the full range of spinal movement. This mechanism of action delivers precise kinematics—specifically, a fixed center of rotation with controlled translation coupled with flexion-extension—that remain exactly the same across the full product line. By maintaining a center of rotation concentric with the facet joints, prodisc offloads those joints, supports controlled motion, and resists the shear forces that can damage both the implant and surrounding anatomy.
|
| |
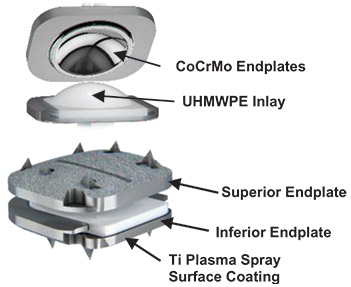
|
|
The images below depict the enhanced stability with the fixed prodisc CORE technology compared to the mobile core design utilized by competing TDR solutions:
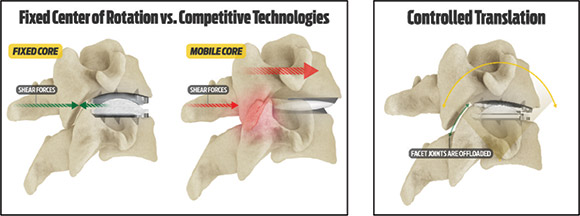
Match-the-Disc Philosophy
Spinal anatomy varies meaningfully across patients in terms of endplate geometry, disc height, bone health, and the nature and severity of disc degeneration, making a one-size-fits-all implant approach insufficient to meet the needs of the full patient population. Our Match-the-Disc philosophy is an organizing principle of the entire prodisc platform to meet surgeon preference, patient needs, and procedural objectives. Across the prodisc platform, the combination of fixation methods, endplate geometries, footprint shapes and sizes, disc heights, and surgical techniques offers close to 100 distinct implants to the surgeon. The prodisc system includes all implant variations for patient cervical or lumbar anatomy, such that the surgeon is not required to pre-select a specific implant configuration prior to the procedure. This intraoperative flexibility is a defining feature of the prodisc system and is enabled, in part, by prodisc’s streamlined instrument system. This results in reduced surgical complexity, often enabling the surgeon to preserve more of the patient’s preoperative bone structure.
160
The following table depicts the implant variations possible with the prodisc platform:
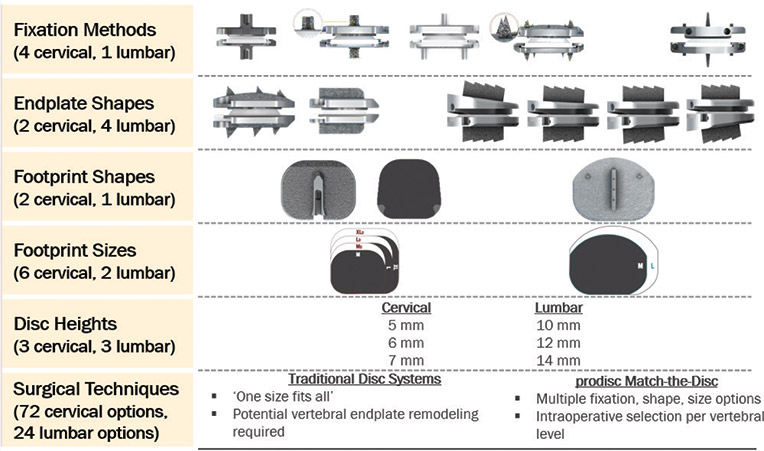
prodisc Cervical TDR Systems
We offer four Cervical TDR systems: prodisc C, prodisc C Vivo, prodisc C SK, and prodisc C Nova. While each system features a distinct endplate geometry and fixation mechanism, all four systems utilize our prodisc CORE technology.
The following table summarizes our prodisc Cervical TDR portfolio as of June 30, 2026:
| |
Products
|
| |
Description
|
| |
Regulatory Overview of Primary Markets(1)
|
|
| |
|
| |
•
Original cervical design
•
Flat endplate design
•
Large midline keel
|
| |
FDA PMA approved (single-level)
CE mark
|
|
| |
|
| |
•
Anatomically-designed domed endplate
•
Keel-less design with lateral spikes
•
One-step insertion
|
| |
FDA PMA approved (single-level and two-level)
CE mark
|
|
| |
|
| |
•
Flat endplate design
•
Low-profile tri-keel design
•
Optimized, simplified keel preparation
|
| |
FDA PMA approved (single-level and two-level)
CE mark
|
|
| |
|
| |
•
Flat endplate design
•
Low-profile “small” central keel
•
Optimized, simplified keel preparation
|
| |
FDA PMA approved (single-level and two-level)
|
|
The prodisc C product utilizes a flat endplate design along with a single central keel on each of the superior and inferior endplates. The prodisc C Vivo product utilizes a convex superior endplate configuration to match
161
more concave patient anatomy along with a keel-less design featuring lateral spikes that enable a one-step insertion technique. The prodisc C SK and prodisc C Nova implant designs utilize a flat endplate shape to better match flat patient anatomy along with a low-profile and thinner keel endplate configuration for enhanced mechanical implant fixation. Three of our four Cervical TDR systems, prodisc C Vivo, prodisc C SK and prodisc C Nova, received FDA PMA approval for two-level indications. With these approvals, we believe we offer the only TDR portfolio with multiple two-level cervical PMA approvals. We believe this offering represents a significant advantage given the average number of levels treated in anterior cervical fusion surgery in 2025 was 1.8 levels per surgery.
prodisc Lumbar TDR Systems
We offer one Lumbar TDR system: the prodisc L. The prodisc L implant features flat endplate surfaces and a large, stable central keel, with the polyethylene inlay assembled in the spine in a two-step insertion technique. The prodisc L platform includes the prodisc L Anatomic Endplates, which provides angulation in the inferior endplate, enabling the surgeon to better fit the disc to the patient’s anatomy. These additional endplate configurations allow surgeons more opportunity to address a broader range of patients by providing a customized fit throughout the entire range of indicated levels.
The following table summarizes our Lumbar TDR system portfolio as of June 30, 2026:
| |
Products
|
| |
Description
|
| |
Regulatory Overview of Primary Markets(1)
|
|
| |
|
| |
•
Flat endplate design
•
Large central keel
•
Two-step insertion (endplates + inlay)
|
| |
FDA PMA approved (single-level and two-level)
CE mark
|
|
| |
|
| |
•
Four endplate constructs
•
Designed to provide the majority of angulation in the inferior endplate, reducing sacral slope
|
| |
FDA PMA approved (single-level and two-level)
CE mark
|
|
The prodisc Lumbar TDR portfolio is the only PMA approved device for both single- and two- level indications, a regulatory distinction that we believe is a critical differentiator in the lumbar TDR market, where two-level payor coverage is growing and surgeon demand for multi-level TDR options is increasing.
Outside of the United States and countries accepting CE marked medical devices, our primary markets are Australia, South Korea, Switzerland and Taiwan, in which we have registrations for the following devices:
•
Australia: prodisc C Vivo, prodisc C Nova and prodisc L;
•
South Korea: prodisc C Vivo and prodisc L;
•
Switzerland: prodisc C Vivo, prodisc C Nova and prodisc L; and
•
Taiwan: prodisc C Vivo and prodisc L.
Instrument Systems
Our major products are supported by two instrument systems: one for cervical and one for lumbar. An instrument system contains all the instrumentation required to support the respective procedure. A single cervical system supports prodisc C Vivo, prodisc C SK, and prodisc C Nova across all configurations. The lumbar instrument system similarly covers all prodisc L procedures. Traditional spine fusion companies often require multiple systems. Our streamlined model reduces procedural complexity and ensures reproducible workflows in both hospitals and ambulatory surgical centers.
162
The images below depict a prodisc Cervical instrument system and a prodisc Lumbar instrument set:
| |
prodisc Cervical Instrument System
|
| |
prodisc Lumbar Instrument Set
|
|
| |
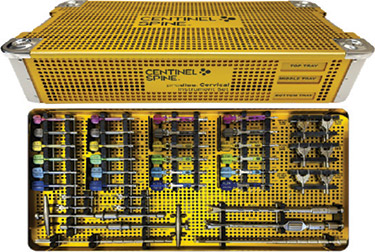
|
| |
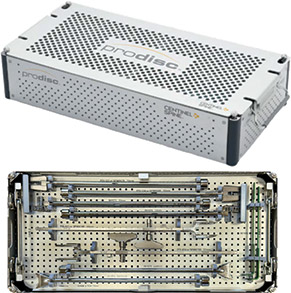
|
|
Regulatory, R&D and Pipeline
Our expertise and established PMA-approved technology platform enable us to pursue our product pipeline efficiently as we have proven the ability to do in a disciplined manner over many years. This foundation of regulatory depth, combined with a substantial body of clinical and real-world evidence developed over more than three decades of prodisc use, enables us to advance product enhancements and new indications primarily through PMA supplements, which are generally less time-intensive and capital-intensive than conducting a full IDE study. We believe our competency to efficiently execute on our pipeline is unique to us and one that would take a new market entrant years and significant capital to replicate.
Our research and development mission is to advance TDR technology that broadens patient selection across our prodisc portfolio, expands surgeon interest and usage, and extends our market leadership. We pursue this mission because we believe TDR represents the superior solution for the broadest possible range of patients suffering from DDD, and that continued innovation is essential to reinforcing our position at the forefront of TDR solutions. To execute this mission, we maintain a dedicated team of product development professionals, supported by a network of key opinion leaders and surgeon advisors who provide ongoing clinical insight to guide innovation across our prodisc portfolio.
Our near-term focus is on advancing additional implant sizing options for both cervical and lumbar applications, developing new and updated instrumentation to support procedural efficiency and reproducibility, and investing in enabling technologies intended to assist surgeons with implant selection and procedural consistency. We are also pursuing additional regulatory initiatives to expand indications, including hybrid (TDR adjacent to fusion) and additional two-level approvals across our cervical portfolio.
Our long-term focus is on continuing to develop market-enhancing products, new technologies, and expanding indications supported by clinical evidence consistent with our motion preservation philosophy, including next-generation implant designs and materials, and alternative surgical approach systems for both cervical and lumbar applications.
Sales and Marketing
We have built a scaled sales and marketing organization designed to support the adoption and utilization of TDR across the United States and selected international markets. Our commercial model is structured to combine direct sales leadership, clinical support, surgeon practice engagement and a broad distributor network to deliver consistent execution and high-quality service across care settings.
As of June 30, 2026, our commercial organization In the United States included 45 dedicated sales management and clinical support personnel, including regional sales managers, district sales managers, clinical account managers, and market development managers. This team is responsible for surgeon engagement, case planning and support, care site access, and distributor oversight, enabling consistent clinical and technical support throughout the surgeon adoption lifecycle, from initial engagement through ongoing utilization.
163
Our commercial organization in the United States is supported by a network of more than 400 independent distributors, providing broad geographic coverage and local market presence. We manage this network by assigning specific surgeons to distributors, which we believe promotes accountability, improves execution consistency, and supports high-quality service at the surgeon and care-site level. We work closely with distributors to support surgeon engagement and education through standardized training and performance programs, including our “Winning with prodisc” distributor enablement initiative. We believe this collaborative approach allows us to maintain strong alignment with our distributor network to deliver consistent execution and service quality.
We believe the success of our commercial organization is reflected in the growing number of surgeons who perform TDR with prodisc, as well as the increasing utilization of prodisc among these surgeons. The chart below shows the number of surgeons in the United States who performed at least one TDR procedure with prodisc in the preceding four quarters, as well as high-volume users of prodisc. We define high-volume users as surgeons who performed twelve or more TDR procedures with prodisc over the prior four quarters, which we believe is indicative of deeper platform adoption within a surgeon’s clinical practice. Among surgeons who performed at least one prodisc procedure during the four-quarter period ended Q4 2024, approximately 83% continued to perform prodisc procedures during the four-quarter period ended Q4 2025. Over the same period, approximately 99% of high volume users continued to perform prodisc procedures.
As adoption of TDR expands, we intend to continue scaling our commercial organization in the United States in a disciplined manner by selectively adding sales leadership and clinical support roles as well as increasing our distributor footprint to enhance geographic coverage, deepen care site access, and support increasing procedural demand.
Approximately 15% and 16% of our revenue was derived from markets outside of the United States for the six months ended June 30, 2026 and the fiscal year ended December 31, 2025, respectively. Our international commercial activities as of June 30, 2026 are supported by 11 direct employees and a network of stocking and non-stocking distributors with established local presence. Depending on the characteristics of each market, including healthcare infrastructure and reimbursement environment, we utilize direct, distributor-based, or hybrid commercial models to support surgeon engagement and procedural adoption. In markets where we already operate, our international team works closely with distributors to support ongoing surgeon education, case execution, and portfolio utilization. We believe this flexible and market-specific approach allows us to operate effectively across diverse international healthcare systems while maintaining consistency in execution and service as we scale our international presence.
164
Medical Education and Scientific Affairs
One of the core tenets that we believe will facilitate our growth is the delivery of high-quality, peer-to-peer continuing medical education and training focused on TDR, provided in formats and venues readily accessible to surgeons. Our medical education programs are designed to support surgeons across the adoption lifecycle, from initial exposure through advanced utilization, with a focus on successful outcomes through building of procedural confidence, expansion of appropriate patient selection, and increasing consistent use of TDR in clinical practice. We believe structured education is critical to addressing what have historically been conservative use patterns of TDR and enabling surgeons to progress from episodic use to more routine utilization, including expanding their patient selection criteria and expanding from cervical-only or lumbar-only procedures toward use across both anatomies.
Through our medical education programs, surgeons are educated on the clinical rationale for TDR, published clinical supporting evidence, prodisc design philosophy, patient selection considerations, and surgical technique. Our medical education programs include:
•
Hands-on Bioskills Courses, which are conducted in the form of an interactive lecture, delivered by experienced surgeon faculty, with hands-on cadaveric training;
•
Surgical Observation (SO) Visits, which provide the opportunity for technique training delivered by direct observation of live prodisc C or prodisc L surgical procedures, performed by experienced faculty; and
•
Peer-to-Peer Webinars or In-Person Lectures, which present an interactive lecture with hands-on instrumentation practice using demonstration kits and “Sawbones”-type models.
We also offer additional programs for prodisc continuing education, including:
•
Ongoing surgery support by our Clinical Account Managers;
•
peer-to-peer technique or case consultation with prodisc faculty;
•
lumbar anterior access courses or SO visits for prodisc surgeons and access surgeon partners;
•
educational side-events and user meetings at U.S. and International Spine Society Congresses;
•
global cervical and lumbar prodisc webinars with internationally respected faculty; and
•
advanced traveling surgical observation U.S. or international “mini-fellowships” for surgeons interested in becoming prodisc experienced faculty.
In 2025, approximately 800 surgeons participated in one of our training programs in the U.S., representing an increase of approximately 23% compared to 2024. Of the surgeons who participated in one of our training programs in 2025, approximately 70% have performed at least one prodisc procedure since completing training. We believe these data demonstrate the effectiveness of our education programs in translating structured training into clinical utilization and increased procedure frequency over time.
Beyond our medical education programs, our scientific affairs activities allow surgeons to participate in clinical research, publications, and podium presentations, supporting continued dissemination of TDR knowledge within the spine community.
Direct-to-Patient (DTP) Education Program
Although neck and back conditions are highly prevalent and often debilitating, the patient journey from diagnosis to recovery remains complex and difficult to navigate. Direct-to-patient awareness, education, and resources are critical to helping patients better understand when surgical intervention may be appropriate, navigate available treatment options, and assess whether TDR may be a suitable option. Our direct-to-patient initiatives are designed to reduce friction in the decision-making process by increasing awareness and understanding of the potential benefits of TDR and to support more informed discussions between patients and spine surgeons.
To better engage these patients, we have developed a patient education and support platform called rediscover, which serves as the center of our direct-to-patient education and engagement efforts. The platform was
165
developed in collaboration with spine surgeons and reflects ongoing input from the clinical community. The rediscover platform is designed to provide patients with educational content, practical guidance, and other patients’ perspectives to help them understand when and how TDR may be considered, how it differs from fusion, how to prepare for conversations with surgeons and what to expect after TDR surgery. The mission of the rediscover platform extends beyond just a spine-focused website, serving more as an inspirational spine community of current and former patients coming together to tell their stories of triumph over debilitating neck and back pain.
We utilize targeted outreach and public-facing initiatives to increase awareness of the rediscover platform, including both well-known individuals and everyday patient ambassadors who share first-hand experiences with TDR to help demystify motion-preserving surgery and reduce patient apprehension about implant-based spine procedures. In certain cases, these ambassadors include spine surgeons who have selected TDR for their own care, and who also dedicate time to participating in education and awareness efforts through the platform, further reinforcing awareness of motion preservation from both patient and clinician perspectives.
Our DTP program driven by the rediscover platform focuses on the following key elements, designed to help patients overcome common apprehensions related to spine surgery:
•
Awareness and Inspiration. The rediscover platform includes a community platform dedicated to providing pain sufferers with hope and support through access to real success stories of recovery from spine surgery.
•
Education on Surgical Options. The rediscover platform provides targeted educational resources focused on TDR, while also describing how motion preservation differs from fusion, enabling patients to better understand treatment options and engage in more informed discussions with their spine surgeons.
•
Access to Trained Surgeons—The rediscover platform helps patients identify and connect with proximate spine surgeons experienced in TDR, facilitating discussions with local providers to support informed care decisions.
We believe these direct-to-patient initiatives complement our surgeon-focused sales and medical education efforts by helping patients arrive at clinical consultations better informed about TDR and more comfortable considering it where clinically appropriate, thereby supporting adoption and utilization of the prodisc platform over time.
Clinical studies
We believe that the prodisc C and prodisc L TDR systems are the most widely studied motion preservation technologies in the world. More than 300,000 implantations have been performed worldwide using the prodisc platform, resulting in extensive real-world clinical data sets that have been published in over 590 peer-reviewed clinical papers evaluating outcomes, biomechanics, and long-term performance. These studies primarily focus on various patient-reported outcome measures related to pain relief, motion preservation, and complication rates, such as Composite Clinical Success (CCS) scores and secondary surgical interventions (SSIs). A CCS score is derived from a combination of a postoperative questionnaire used by surgeons to assess neck-related disability, measurement of neurological status, quantification of surgical interventions at the index level and quantification of device-related adverse events. We believe this extensive body of evidence presents the most robust data of any TDR system marketed in the United States, and globally.
This growing portfolio of clinical evidence includes our Select Match Artificial Disc Replacement Two-level (“SMART”) IDE clinical study, a nationwide multi-center, prospective, randomized controlled trial that we initiated in 2019 to evaluate the treatment of two-level symptomatic cervical DDD in 433 patients surgically enrolled across 31 sites in the United States. Eligible patients had to meet inclusion criteria specified for this clinical study. Generally, patients had to be adults who had been diagnosed with symptomatic cervical disc disease at two contiguous levels from C3 to C7, be unresponsive to non-operative treatment, be appropriate for treatment using an anterior surgical approach, and be medically cleared for surgery prior to enrollment in the clinical study. Two-year follow-up data was collected in approximately 93% of those expected due in the mITT patient population in the study. The clinical and non-clinical data of the SMART study supported the FDA’s approval of a PMA supplement in October 2025, expanding the indication for prodisc C SK and
166
prodisc C Vivo to include use at two contiguous cervical levels. We believe the SMART study was a landmark study in the field of TDR as the first FDA-approved cervical IDE study to utilize a TDR as the control as well as the first FDA-approved cervical IDE study with a stratified investigational arm, consisting of two investigational TDRs (prodisc C SK and prodisc C Vivo) evaluated versus the control (Mobi-C). Patients treated with prodisc implants demonstrated a CCS score of 87.1% compared to 83.7% for the control group. The rate of SSIs, such as revision, reoperation, disc removal, and supplemental fixation, was 3.1% in the investigational group, lower than 4.3% for the control group. The rate of serious adverse events (SAEs) that were considered implant or procedure related were similar between the investigational group and the control group, with 1.6% of prodisc C patients having experienced SAEs that were considered “definitely” device-related SAEs while 1.9% of the control group experienced SAEs that were considered “definitely” device-related SAEs. Of the 1.6% of prodisc C patients who experienced “definitely” device-related SAEs, such SAEs related to the device loosening, device subsidence, and device migration. We believe the strong clinical performance of our prodisc TDRs in the stratified investigational arm clinically validated our Match-the-Disc philosophy, leading physicians, patients and payors to closely examine and adopt motion preservation in the treatment of cervical DDD. We believe the results of this study will continue to lead to a meaningful increase in the awareness and commercial adoption of our products in the coming years.
Our ongoing and near-term focus includes introducing additional implant configurations for cervical and lumbar TDR, adding new and updated instrumentation for optimal implant preparation and placement, and investing in enabling technologies intended to assist surgeons with implant selection and procedural consistency. Our ongoing indication expansion initiatives relate to TDR adjacent to fusion and an additional two-level indication for prodisc C, where we plan to pursue approval through supplemental PMA. Over the longer term, we are committed to continuing to expand the indications for which our products are approved and to expand our portfolio of products, including next-generation implant designs and materials and alternative surgical approach systems, to continually improve our offerings for the benefit of patients and surgeons.
Relevant Peer-Reviewed Publications
The table below sets forth information regarding certain peer-reviewed publications that we believe provide additional helpful context regarding the clinical evidence in TDR.
|
Lead Author/ Title/
Source |
| |
Institution/ Study
Support |
| |
Patient Cohort
|
| |
Adverse Events
(Re-operation/ Revision) |
| |
Study Summary
|
|
|
Bai et al.
Total disc replacement versus fusion for lumbar degenerative diseases — a meta-analysis of
randomized controlled trials
Medicine
(2019) |
| |
Department of Orthopedics, Second Provincial People’s Hospital of GanSu, Lanzhou, Gansu Province
No Centinel Spine funding was provided for this work.
|
| |
Meta-analysis assessing 14 randomized controlled trials comprising a total of 1,890 patients comparing outcomes and safety data for one- or two-level lumbar TDR vs lumbar fusion.
|
| |
Pooled results from 6 trials indicated patients receiving lumbar TDR had approximately 56% relative reduction in complications compared with lumbar fusion. Reoperation rate pooled results in 7 trials indicated patients receiving lumbar TDR had approximately 47% lower relative risk of reoperation than lumbar fusion patients.
|
| |
Lumbar TDR is recommended to alleviate the pain of degenerative lumbar diseases, improve the state of lumbar function and the quality of life of patients, provide a high level of security, have better health economics benefits for one-level patients.
|
|
|
Delamarter et al.
Prospective, Randomized, Multicenter Food and Drug Administration Investigational Device Exemption Study of the ProDisc-L Total Disc Replacement Compared with Circumferential Arthrodesis for the
|
| |
The Spine Institute at Saint John’s Health Center, Santa Monica, CA
No Centinel Spine funding was provided for this work.
|
| |
237 patient prospective randomized IDE trial at 16 sites comparing 2-year outcomes for two-level prodisc L vs lumbar fusion
|
| |
Four (2.4%) prodisc L reoperations at the index level (one to treat implant migration, three to treat persistent foraminal/neural compression). Six (8.3%) lumbar fusion reoperations (5 due to persistent pain and one due to pseudoarthrosis).
|
| |
Despite the relatively short duration of follow-up and design limitations, the present study suggests that two-level lumbar TDR is an alternative to and offers clinical advantages in terms of pain relief and functional recovery in comparison with
|
|
167
|
Lead Author/ Title/
Source |
| |
Institution/ Study
Support |
| |
Patient Cohort
|
| |
Adverse Events
(Re-operation/ Revision) |
| |
Study Summary
|
|
|
Treatment of Two-Level Lumbar Degenerative Disc Disease: Results at Twenty-four Months
The Journal of Bone and Joint Surgery
(2011) |
| | | | | | | | | | |
lumbar fusion. Longer-term follow-up is needed to determine the risks for implant wear and/or degenerative segment changes.
|
|
|
Delamarter et al.
Five-Year Reoperation Rates, Cervical Total Disc Replacement Versus Fusion, Results of a Prospective Randomized Clinical Trial
Spine
(2013) |
| |
Cedars-Sinai Spine Center, Los Angeles, CA
No Centinel Spine funding was provided for this work.
|
| |
209 patient prospective randomized IDE trial at 13 sites comparing 5-year outcomes for one-level prodisc C vs cervical fusion
|
| |
Three (2.9%) prodisc C reoperations (one at the index level to treat pain and two at the index and adjacent levels for pain and adjacent-level degeneration). 16 (14.5%) cervical fusion reoperations (8 at the index level and 9 included an adjacent level).
|
| |
Five-year follow-up of a prospective randomized clinical trial revealed 5-fold difference in reoperation rates when comparing patients who underwent cervical fusion (14.5%) with patients who underwent cervical TDR (2.9%). These findings suggest the durability of cervical TDR and its potential to slow the rate of adjacent-level disease.
|
|
|
Janssen et al.
ProDisc-C Total Disc Replacement Versus Anterior Cervical Discectomy and Fusion for Single-Level Symptomatic Cervical Disc Disease: Seven-Year Follow-up of the Prospective Randomized U.S. Food and Drug Administration Investigational Device Exemption Study
The Journal of Bone and Joint Surgery
(2015) |
| |
Center for Spinal Disorders/Scientific Education and Research Institute, Thornton, CO
No Centinel Spine funding was provided for this work.
|
| |
209 patient prospective randomized IDE trial at 13 sites comparing 7-year outcomes for one-level prodisc C vs cervical fusion
|
| |
Seven prodisc C secondary surgical procedures (six to treat persistent symptoms and one to treat persistent neural compression) in 7 (7%) patients vs 30 cervical fusion secondary surgical procedures (19 to treat index level) in 19 (18%) patients.
|
| |
Total disc arthroplasty with prodisc C is a safe and effective surgical treatment of single-level symptomatic cervical degenerative disc disease. Clinical outcomes after prodisc C TDR were similar to those after cervical fusion. Patients treated with prodisc C had a lower probability of subsequent surgery, suggesting that cervical TDR provides durable results and has the potential to slow the rate of adjacent-level disease.
|
|
|
Marnay et al.
Clinical Outcomes After 1 and 2-Level Lumbar Total Disc Arthroplasty: 1,187 Patients with 7 to 21-Year Follow-up
The Journal of Bone and Joint Surgery
(2025) |
| |
Montpellier Spine Institute, Clinique du Parc, Castelnau-le-Lez, France
No Centinel Spine funding was provided for this work. Marnay is original prodisc L inventor and Centinel Spine consultant.
|
| | 1,187 prodisc L TDR patients assessed at 7 to 21 years postoperatively | | |
49 patients (4.13%) required reoperation at index level or a new surgery at another level (most commonly due to adjacent level surgery, posterior decompression, or surgical wound complication or hematoma reoperation). 8 patients (0.67%) required revision of the implanted prodisc L device (most commonly due to mis-centering of device, vertebral body fracture, or an unlocked polyethylene core).
|
| |
Retrospective comparison of long-term lumbar TDR results demonstrated that patients had dramatic and maintained reductions in disability and pain scores over time and low rates of index-level revision or reoperation and adjacent-level surgery relative to published long-term fusion data.
|
|
168
|
Lead Author/ Title/
Source |
| |
Institution/ Study
Support |
| |
Patient Cohort
|
| |
Adverse Events
(Re-operation/ Revision) |
| |
Study Summary
|
|
|
Nunley at al.
Rates of Osteolysis for Commercially Available CervicalDisc Arthroplasty Devices in the United States: A Manufacturer and User Facility Device Experience Database Analysis
International Journal of Spine Surgery
(2025) |
| |
Spine Institute of Louisiana, 1500 Line Ave, Suite 200, Shreveport, LA 71101
No Centinel Spine funding was provided for this work.
|
| |
Not a patient study, rather an analysis using the Manufacturer and User Facility Device Experience (MAUDE) FDA database assessing various cervical TDR brands.
|
| |
Osteolysis percentage was calculated as a proportion of a total number of valid MAUDE reports. The total number of osteolysis events reported in the MAUDE database for each disc was 2 Mobi-C, 1 Prodisc-C, 3 Bryan, 0 PCM, 0 Secure-C, 2 Prestige, 138 M6, and 16 Simplify. The highest rate of osteolysis was found in the M6 (36.2%) and Simplify discs (25.8%).
|
| |
MAUDE database reports from various cervical TDR brands such as “Mobi C,” “Prodisc C,” “Bryan,” “PCM,” “Secure-C,” “Prestige,” “M6,” and “Simplify” were evaluated from 1 January 2005 to 30 September 2024.
Osteolysis percentage was calculated as a proportion of a total number of valid reports. While acknowledging the limitations of the MAUDE database, the data presented give rise to substantial concerns regarding the association of osteolysis with the M6 implant. While the reports on the Simplify disc are recent, the current findings indicate a necessity for careful monitoring. The potential link between osteolysis and specific implants necessitate vigilance among health care professionals.
|
|
|
Park et al.
Are Controversial Issues in Cervical Total Disc Replacement Resolved or Unresolved?: A Review of Literature and Recent Updates
Asian Spine Journal (2018)
|
| |
Department of Neurosurgery, Good Doctor Teun Teun Hospital, Anyang, Korea
No Centinel Spine funding was provided for this work.
|
| | No patients, this is a literature review article. | | | N/A | | |
Cervical TDR implant technology has evolved considerably since its introduction. Early cervical TDR implants were often difficult for surgeons to assemble and implant. Improvements in implant design and instrumentation have simplified implantation and enhanced surgical usability while maintaining the clinical advantages of motion-preserving technology, although continued long-term follow-up remains important.
|
|
|
Perez-Albela et al.
Return to Work After Anterior Cervical Disk Replacement Versus Fusion: A Systematic Review and Meta-analysis of Randomized Controlled Trials
Spine
(2025) |
| |
Department of Orthopedic Surgery, Warren Alpert Medical School, Brown University, Providence, RI
No Centinel Spine funding was provided for this work.
|
| |
Meta-analysis assessing 16 randomized controlled trials comprising a total of 5,657 patients comparing return-to-work outcomes for one- or two-level cervical TDR vs cervical fusion.
|
| |
This return-to-work meta-analysis did not include an assessment of adverse events, revision, or reoperation rates.
|
| |
Cervical TDR facilitates earlier return to work compared with cervical fusion within the first postoperative year, reflecting the benefits of its motion-preserving design and reduced fusion-related recovery restrictions. These findings highlight the value of cervical TDR for
|
|
169
|
Lead Author/ Title/
Source |
| |
Institution/ Study
Support |
| |
Patient Cohort
|
| |
Adverse Events
(Re-operation/ Revision) |
| |
Study Summary
|
|
| | | | | | | | | | | | |
working-aged individuals, particularly those prioritizing a faster return to professional and social activities.
|
|
|
Pham et al.
Material Science in Cervical Total Disc Replacement
BioMed Research International
(2015) |
| |
Department of Neurosurgery, Keck School of Medicine, University of Southern California, Los Angeles, CA 90033, USA
No Centinel Spine funding was provided for this work
|
| | No patients, this is a review article. | | | N/A | | |
This review article evaluates the biomaterials used in FDA-approved cervical TDR systems, including implant bearing surfaces, material properties, wear characteristics, and the biological effects associated with long-term implantation. The article summarizes that implant material selection directly influences wear characteristics and biological response. Different bearing materials produce different types and quantities of wear particles, therefore, the selection of biomaterials in cervical TDR design is important.
|
|
|
Radcliff et al.
Seven-year cost-effectiveness of ProDisc-C total disc replacement: results from investigational device exemption and post-approval studies
J Neurosurg Spine
(2016) |
| |
Department of Orthopedic Surgery, Thomas Jefferson University, Egg Harbor Township, NJ
No Centinel Spine funding was provided for this work.
|
| |
7-year cost-effectiveness assessment of 209 patients from randomized multicenter one-level prodisc C IDE and post approval study comparing cervical TDR vs cervical fusion
|
| |
For prodisc C cervical TDR - 8 secondary surgeries in 8 patients (7.8%) vs 31 secondary cervical fusion surgeries in 20 patients (18.9%). This cost effectiveness analysis did not include detailed reoperation analysis.
|
| |
Based on modeling evaluation, cervical TDR was found to be more effective and less costly than cervical fusion over a 7-year time horizon for patients with single-level symptomatic degenerative disc disease. These results are robust across a range of scenarios and perspectives and are intended to support value-based decision making.
|
|
|
Rousseau et al.
Influence of the Geometry of a Ball-and-Socket Intervertebral Prosthesis at the Cervical Spine: A Finite Element Study
Spine
(2008) |
| |
LBM ENSAM CNRS UMR 8005, 151 bd de l’Hopital, Paris, France and Department of orthopaedics, LaPitié Salpétriére hospital,Assistance Publique-Hopitaux de Paris.
No Centinel Spine funding was provided for this work.
|
| |
No patients, this is a conceptual biomechanical analysis studying the influence of geometry on an articulated TDR prosthesis at the cervical level using a 3-dimensional nonlinear finite element model.
|
| | N/A | | |
Study data details the influence of the geometrical parameters of a ball-and-socket total disc replacement on the kinematics and constraints at the cervical functional spinal unit. Under experimental conditions, the facet forces were kept below their normal range in the case of the posterior center and a large radius TDR.
|
|
170
|
Lead Author/ Title/
Source |
| |
Institution/ Study
Support |
| |
Patient Cohort
|
| |
Adverse Events
(Re-operation/ Revision) |
| |
Study Summary
|
|
|
Scott-Young et al.
Midterm osteolysis-induced aseptic failure of the M6-C™ cervical total disc replacement secondary to polyethylene wear debris
European Spine Journal
(2022) |
| |
Gold Coast Spine, 27 Garden Street, Southport, Gold Coast,QLD 4215, Australia
No Centinel Spine funding was provided for this work.
|
| |
Prospective study involved 382 patients who received standalone cervical TDR or a hybrid procedure (ACDF/Cervical TDR).
|
| |
Fifty-three patients received M6-C cervical TDR. Eighteen patients (34%) were revised at an average of 67 months postoperatively for wear-induced osteolysis. The other cervical TDR cohort had an incidence of 3.3% at the equivalent time, and none of these were due to osteolysis or wear-related events.
|
| |
A retrospective comparison between different cervical TDR devices was conducted regarding patient-reported outcome measures (PROMs), failure scenarios, and revision surgeries. There is a concerning midterm failure rate related to ultra-high-molecular-weight-polyethylene wear-induced osteolysis in the M6-C. The study concludes that understanding the properties of implantable biomaterials is important, considering the movement within the implanted biomaterials and between the implanted biomaterial and the natural tissues under normal in vivo physiological loads.
|
|
|
Sears et al. / Kinematics of Cervical and Lumbar Total Disc Replacement
Seminars in Spine
Surgery (2006) |
| |
Sydney NeuroSpine Clinic and Departments of Neurosurgery, Royal North Shore, and Dalcross Private Hospitals, Sydney, Australia.
No Centinel Spine funding was provided for this work.
|
| |
No patients, this is a narrative review describing the biomechanical principles and kinematics underlying cervical and lumbar TDR.
|
| | N/A | | |
The authors conclude that restoration of normal spinal kinematics is a fundamental objective of TDR and that different prosthesis designs possess distinct biomechanical advantages. Constrained devices (fixed center of rotation) may be preferable where resistance to shear loading is important. These types of implants resist shear forces through the implant and help protect the facet joints. Unconstrained (mobile center of rotation) implants allow independent translation and may better accommodate the spine’s natural center of rotation but transfer shear forces to the facet joints rather than the implant-bone interface.
|
|
171
|
Lead Author/ Title/
Source |
| |
Institution/ Study
Support |
| |
Patient Cohort
|
| |
Adverse Events
(Re-operation/ Revision) |
| |
Study Summary
|
|
|
Zigler et al.
Results of the Prospective, Randomized, Multicenter Food and Drug Administration Investigational Device Exemption Study of the ProDisc-L Total Disc Replacement Versus Circumferential Fusion for the Treatment of 1-Level Degenerative Disc Disease
Spine
(2007) |
| |
Texas Back Institute, Plano, TX
No Centinel Spine funding was provided for this work.
|
| |
236 patient prospective randomized IDE trial at 17 sites comparing 2-year outcomes for one-level prodisc L vs fusion
|
| |
Six (3.7%) prodisc L reoperations at the index level (four to treat device migration, one technical error, one pain). Four (5.4%) lumbar fusion reoperations (two due to persistent pain and two due to device removal).
|
| |
prodisc L has been found to be safe and efficacious. In properly chosen patients, prodisc L has been shown to be superior to lumbar circumferential fusion by multiple clinical criteria.
|
|
|
Zigler et al.
Comparison of Lumbar Total Disc Replacement With Surgical Spinal Fusion for the Treatment of Single-Level Degenerative Disc Disease: A Meta-Analysis of 5-Year Outcomes From Randomized Controlled Trials
Global Spine Journal
(2018) |
| |
Texas Back Institute, Plano, TX
No Centinel Spine funding was provided for this work.
|
| |
Meta-analysis assessing 4 randomized controlled trials comprising of 1,325 patients comparing 5-year outcomes for one-level lumbar TDR vs lumbar fusion.
|
| |
Detailed adverse events not reported in this meta-analysis. In two included trials, adjacent segment degeneration was reported to be lower at 5 years with lumbar TDR (1.1% & 9%) vs lumbar fusion (4.7% & 14%).
|
| |
Lumbar TDR is an effective alternative to lumbar fusion for treatment of lumbar degenerative disc disease. Lumbar TDR offers several clinical advantages over the longer term that can benefit the patient and reduce health care burden, without additional safety consequences.
|
|
Coverage and reimbursement
Coverage and reimbursement for TDR procedures vary by payor, site of care and geography and are key determinants of commercial adoption for cervical and lumbar TDR implants. In the United States, providers that purchase our implants generally seek reimbursement from third-party payors, including Medicare, Medicaid and commercial insurers, for both the facility payment (which typically includes the implant) and the surgeon’s professional fee, with patients responsible for applicable deductibles and copayments. Our sales volumes and pricing therefore depend, in meaningful part, on the availability and adequacy of coverage and reimbursement for TDR procedures. We are strategically positioned at an inflection point for TDR adoption, propelled by increasingly aligned payor support and favorable facility payments relative to fusion procedures described below. Our comprehensive prodisc portfolio benefits from a reimbursement landscape that is not only established but actively expanding, particularly for lumbar TDR.
We believe the reimbursement environment for cervical TDR has reached a favorable maturity: commercial payor coverage is near universal for both one-level and two-level cervical TDR procedures, a testament to the long-term clinical evidence and superior patient outcomes. For lumbar TDR, commercial coverage has expanded significantly and is now approximately 95% of covered lives for one-level lumbar disc replacement and approximately 45% of covered lives (and growing) for two-level lumbar disc replacement. These include commercial payor coverage policies that have positive coverage or have not issued negative coverage for cervical and/or lumbar TDR. We believe this expanding coverage profile, together with increased clinical evidence supporting motion preservation and recent regulatory progress in two-level indications, has contributed to an inflection in surgeon and facility adoption. To further improve payor coverage in lumbar TDR, several initiatives are underway through a third-party partner to help surgeon practices navigate pre-authorizations, denials and appeals, provide patient self-advocacy guidance, and conduct ongoing outreach to payors regarding clinical outcomes and long-term evidence for lumbar disc replacement.
Reimbursement economics can also influence site-of-care decisions. The widespread reimbursement acceptance for cervical TDR translates into highly favorable economics for facilities performing cervical TDR
172
procedures compared to traditional cervical fusion procedures (e.g. anterior cervical discectomy and fusion, or ACDF). Under the 2026 Medicare national average payment rates cited in our internal reimbursement analyses, cervical TDR carries higher facility reimbursement than cervical fusion across hospital inpatient, hospital outpatient, and ambulatory surgery center (ASC) settings. Lumbar TDR is now covered by CMS in both hospital outpatient and ambulatory surgery center settings effective January 1, 2026, in addition to existing hospital inpatient coverage. A comparison of facility payments for cervical and lumbar TDR relative to fusion procedures is included below:
Summary of Facility Payments for Cervical Procedures
| |
Hospital Inpatient
|
| |||||||||
| |
DRG
|
| |
Description
|
| |
Medicare Avg Inpatient Payment
|
| |||
| |
518
|
| |
Cervical Total Disc Replacement
|
| | | $ | 27,195 | | |
| |
473
|
| |
ACDF Standalone or Interbody with Plate
|
| | | $ | 17,764 | | |
| |
Hospital Outpatient
|
| |||||||||
| |
APC
|
| |
Description
|
| |
Medicare Avg Hospital Outpatient
Payment |
| |||
| |
5116
|
| |
Cervical Total Disc Replacement
|
| | | $ | 17,913 | | |
| |
5115
|
| |
ACDF Standalone or Interbody with Plate
|
| | | $ | 13,116 | | |
| |
Ambulatory Surgery Center
|
| |||||||||
| |
Primary
CPT |
| |
Description
|
| |
Medicare Avg Ambulatory Surgery
Center Payment |
| |||
| |
22856
|
| |
Cervical Total Disc Replacement
|
| | | $ | 13,098 | | |
| |
22551
|
| |
ACDF Standalone or Interbody with Plate
|
| | | $ | 9,031 | | |
Summary of Facility Payments for Lumbar Procedures
| |
Hospital Inpatient
|
| |||||||||
| |
DRG
|
| |
Description
|
| |
Medicare Avg Inpatient Payment
|
| |||
| |
518
|
| |
Lumbar Total Disc Replacement
|
| | | $ | 27,195 | | |
| |
451
|
| |
ALIF Standalone or Interbody with Plate
|
| | | $ | 23,506 | | |
| |
Hospital Outpatient
|
| |||||||||
| |
APC
|
| |
Description
|
| |
Medicare Avg Hospital Outpatient
Payment |
| |||
| |
5116
|
| |
Lumbar Total Disc Replacement
|
| | | $ | 17,913 | | |
| |
5117
|
| |
ALIF Standalone or Interbody with Plate
|
| | | $ | 27,721 | | |
| |
Ambulatory Surgery Center
|
| |||||||||
| |
Primary
CPT |
| |
Description
|
| |
Medicare Avg Ambulatory Surgery
Center Payment |
| |||
| |
22857
|
| |
Lumbar Total Disc Replacement
|
| | | $ | 12,699 | | |
| |
22558
|
| |
ALIF Standalone or Interbody with Plate
|
| | | $ | 20,101 | | |
In terms of physician payment for TDR procedures, reimbursement amounts have historically been higher than cervical and lumbar fusion procedures, but this gap has been shrinking over time. We believe the gap will continue to close and that the ongoing transition of spine procedures to the ASC setting may make overall procedure economics more attractive for physicians.
We believe that procedure reimbursement and payor decisions governing this will remain an important factor for commercial adoption of TDR in the future. Payors continuously integrate long-term clinical evidence into their coverage criteria, resulting in a consistent trend toward expanded access and positive reimbursement for TDR.
173
Manufacturing and Supply
We rely on third-party manufacturers to produce substantially all of our implants and instruments pursuant to multi-year supply agreements. We work closely with each manufacturing partner and provide demand forecasts to support capacity planning and production scheduling. Our third-party manufacturers are required to comply with our specifications and quality requirements.
Hammill Manufacturing Co. is our single source supplier for machining and finishing endplates and inlays used in our prodisc C Vivo, prodisc C Nova and prodisc C SK products and Bricon is our sole supplier for machining prodisc C endplates. Both suppliers support distribution in the United States. Internationally, Medicoat (coating), Bricon (finishing) and Fruh (packaging and sterilization) are sole sourced for prodisc C Vivo and prodisc C Nova products. While there are other suppliers that could make or provide any one of our products, we seek to manage single-source supplier risk by regularly assessing the quality and capacity of our single source supplier, implementing supply and quality control protocols where appropriate and actively managing lead times and inventory levels. In addition, we are currently in the process of identifying and approving alternative suppliers to dual or multi-source certain cervical products for distribution in the United States. We generally seek to maintain sufficient supply levels to help mitigate any supply interruptions and enable us to find and qualify another source of supply. For certain products, we estimate that it could take up to 24 months to find and qualify a second source. Order quantities and lead times are based on internal forecasts, which are derived from historical demand and anticipated future demand. Lead times vary depending on the size of the order, time required to manufacture, specific supplier requirements and current market demand and dynamics for the raw materials, sub-assemblies and parts related to our products. For more information, please see the section titled “Risk Factors—We depend on third-party contract manufacturers, some of which are single source, to produce and package our products, and if these manufacturers fail to supply us with our products in sufficient quantities or at all, or in accordance with applicable regulatory requirements and our specifications, it will have a material adverse effect on our business, financial condition, and results of operations.”
We distribute our products from our facility located in West Chester, Pennsylvania. This facility has approximately 16,150 square feet of combined office and warehouse space. See “—Facilities.”
In the United States, products we sell are required to be manufactured in compliance with the FDA’s Quality Management System Regulation (“QMSR”), which covers the methods used in, and the facilities and controls used for, the design, testing, control, manufacturing, labeling, quality assurance, packaging, storage and shipping of medical devices. Outside the United States, we and our contract manufacturers are required to obtain and maintain various quality assurance and quality management certifications.
Compliance with applicable regulatory requirements is subject to continual review and is monitored through periodic inspections by the FDA and other regulatory authorities, including unannounced inspections of our facilities and those of our contract manufacturers.
Competition
The medical device industry is highly competitive, subject to change and significantly affected by new product introductions and market activities of industry participants. Our products compete directly against TDR products offered by Medtronic PLC, Highridge, Inc., Globus Medical Inc., Spineart SA, Spineway Group, and Synergy Spine Solutions, Inc. and numerous other companies offering spinal implant products. Many of our competitors are large, well-capitalized companies with significantly greater financial, technical, marketing, sales, manufacturing and distribution resources than we have. As a result, they may be able to devote greater resources to the development, regulatory approval, marketing and sale of their products than we can.
At any time, these or other market participants may develop alternative treatments, products or procedures that compete directly or indirectly with our products. They may also develop and patent processes or products earlier than we can or obtain regulatory clearance or approvals for competing products more rapidly than we can.
174
We believe that the principal competitive factors in our markets include:
•
product features, instrumentation, quality and design;
•
patient experience, including recovery time, level of discomfort and postoperative results;
•
acceptance by surgeons and other key stakeholders in the market;
•
surgeon learning curves and willingness to adopt new techniques;
•
economic benefits and efficiencies for hospitals, outpatient care centers, ASCs and surgeons;
•
effective distribution and marketing to surgeons and potential patients, including physician education and information sharing programs;
•
product quality and standards, including our reputation with customers and surgeons;
•
product price and qualification for reimbursement;
•
intellectual property; and
•
customer service and support capabilities.
Employee and Human Capital Resources
As of June 30, 2026, we had 138 full-time employees, none of whom were represented by a labor union or covered by collective bargaining agreements. Of our total workforce, 123 employees are located in the United States and 15 are located outside the United States, primarily in Europe. We have not experienced any work stoppages and we consider our relations with our employees to be good.
We value our employees and regularly benchmark total rewards we provide, such as short and long term compensation, health, welfare and quality of life benefits, paid time off and personal leave, against our industry peers to ensure we remain competitive for employee retention and attractive to potential new hires. We seek to create a workplace environment that fosters personal and business successes by offering professional growth opportunities and development, which further assist our employees in meeting and exceeding our established standards of performance. Additionally, our employees work directly with our executive management team to address any internal concerns and continuously improve the ways in which we serve our employees and customers.
Facilities
Our principal executive offices are located in West Chester, Pennsylvania, where we lease approximately 16,150 square feet of combined office and warehouse space under a lease agreement that expires in June 2027 and can be extended to June 2028. We also maintain leased office space in Zug, Switzerland for our international operations. We do not own any real property. We believe that our current facilities are adequate to meet our current operational needs and that suitable additional space will be available on commercially reasonable terms as and when needed to accommodate our future growth.
Legal Proceedings
We are not currently a party to any material legal proceedings. We may at times be involved in litigation and other legal claims in the ordinary course of business. When appropriate in our estimation, we may record reserves in our financial statements for pending litigation and other claims.
Intellectual Property
We strive to protect and enhance the proprietary technologies, inventions and improvements that are important to our business, including seeking, maintaining, enforcing and defending patent rights, whether developed internally or licensed from third parties. Our policy is to seek to protect our proprietary position by, among other methods, pursuing and obtaining patent protection in the United States and in jurisdictions outside of the United States related to our proprietary technology, inventions and improvements that are important to the development and implementation of our business. We may also seek protection in the form of trademarks,
175
and if appropriate, trade secrets and know-how, to protect aspects of our business that are not amenable to, or that we do not consider appropriate for, patent protection.
Our overall success may, in part, depend on our ability to obtain and maintain patent and other proprietary protection for commercially important technology, inventions and improvements, preserve the confidentiality of our trade secrets and know-how related to our business, defend and enforce our patents we own or may obtain in the future, maintain our licenses to use intellectual property owned by third parties and operate without infringing the valid and enforceable patents and other proprietary rights of third parties. In addition, the coverage claimed in a patent application can be significantly reduced before a patent is issued, and its scope can be reinterpreted and even challenged after issuance. As a result, we cannot guarantee that any of our products or product candidates will be protectable or remain protected by enforceable patents that we own or in-license now or in the future. Our pending and future patent applications may not result in the issuance of any patent in any particular jurisdiction, and the claims of any current or future issued patents may not provide sufficient protection from competitors. Moreover, any patent we may own may be challenged, circumvented or invalidated by third parties. Notwithstanding the scope of the patent protection available to us, a competitor could develop competitive technologies and products that are not covered by our patents, and we may be unable to stop such competitor from commercializing such technologies and products. For important factors related to our proprietary technology, inventions and improvements, please see the section titled “Risk Factors—Risks Related to Intellectual Property.”
Patents
We own numerous patents and/or patent applications which relate to our products and technologies. As of June 30, 2026, we owned 17 issued U.S. patents, 5 pending U.S. patent applications, 3 pending international patent applications, 3 issued foreign patents and 2 pending foreign patent applications.
Patents Related to Motion Preservation Products
We own eleven issued U.S. patents, which are generally related to the prodisc product line which includes prodisc C, prodisc C Vivo and prodisc C Nova. The U.S. patents are expected to expire between 2027 and 2030, assuming payment of all appropriate maintenance, renewal, annuity and other governmental fees.
We own five issued U.S. patents, one issued foreign patent in Europe (validated in Switzerland, Germany, France and Great Britain), and one pending foreign patent application in Europe, which are generally related to prodisc C Nova and prodisc C SK. The U.S. patents are expected to expire between 2027 and 2030, and the foreign patent is expected to expire in 2027, subject to terminal disclaimer and assuming payment of all appropriate maintenance, renewal, annuity and other governmental fees.
We own six issued U.S. patents, one pending U.S. patent application, one issued foreign patent in China, and one pending foreign patent application in Germany, which are generally related to prodisc C Vivo. The U.S. patents are expected to expire in 2030, and the foreign patents are expected to expire in 2030, subject to terminal disclaimer and assuming payment of all appropriate maintenance, renewal, annuity and other governmental fees.
In addition to our owned patents and patent applications discussed above that generally relate to prodisc C Nova, prodisc C SK, and prodisc C Vivo, we own three pending U.S. patent applications, one U.S. provisional application, and three international patent applications which generally relate to extensions of the prodisc product line, and include modified, or alternative, prodisc products.
176
The table below sets forth information regarding our owned patents and pending patent applications related to motion preservation products as of June 30, 2026:
| |
Country
|
| |
Title
|
| |
Type
|
| |
Application No.
|
| |
Patent No.
|
| |
Estimated
Expiration Date |
| |
Status
|
| |
Ownership
|
| |
Related
Technology |
|
| |
United States
|
| |
Intervertebral Implant With Keel
|
| | Utility | | | 12/375,071 | | | 8,998,990 | | | 5/29/2030 | | | Issued | | |
Centinel Spine LLC
|
| |
prodisc C,
prodisc C Nova, prodisc C SK |
|
| | United States | | |
Intervertebral Implant With Keel
|
| | Utility | | | 14/643,287 | | | 9,387,086 | | | 7/24/2027 | | | Issued | | |
Centinel Spine LLC
|
| |
prodisc C,
prodisc C Nova, prodisc C SK |
|
| |
United States
|
| |
Intervertebral Implant With Keel
|
| | Utility | | | 15/182,163 | | | 9,883,950 | | | 7/24/2027 | | | Issued | | |
Centinel Spine LLC
|
| |
prodisc C,
prodisc C Nova, prodisc C SK |
|
| |
United States
|
| |
Intervertebral Implant With Keel
|
| | Utility | | | 15/888,505 | | | 10,583,014 | | | 7/24/2027 | | | Issued | | |
Centinel Spine LLC
|
| |
prodisc C,
prodisc C Nova, prodisc C SK |
|
| | United States | | |
Intervertebral Implant With Keel
|
| | Utility | | | 16/812,674 | | | 11,690,728 | | | 1/17/2029 | | | Issued | | |
Centinel Spine LLC
|
| |
prodisc C, prodisc C Nova, prodisc C SK
|
|
| | Europe | | |
Intervertebral Implant With Keel
|
| | Utility | | | 7813286.7 | | |
2 043 563
|
| | 7/24/2027 | | | Issued | | |
Centinel Spine LLC
|
| |
prodisc C, prodisc C Nova, prodisc C SK
|
|
| | Europe | | |
Intervertebral Implant With Keel
|
| | Utility | | | 19186610.2 | | | TBD | | | 7/24/2027 | | | Pending | | |
Centinel Spine LLC
|
| |
prodisc C, prodisc C Nova, prodisc C SK
|
|
| |
United States
|
| |
Intervertebral Implant
|
| | Utility | | | 12/757,443 | | | 8,858,636 | | | 5/26/2030 | | | Issued | | |
Centinel Spine LLC
|
| | prodisc C Vivo | |
| | United States | | | Intervertebral Implant | | | Utility | | | 13/081,541 | | | 9,301,853 | | | 4/09/2030 | | | Issued | | |
Centinel Spine LLC
|
| | prodisc C Vivo | |
| |
United States
|
| |
Intervertebral Implant
|
| | Utility | | | 14/470,992 | | | 9,333,088 | | | 4/09/2030 | | | Issued | | |
Centinel Spine LLC
|
| | prodisc C Vivo | |
| | United States | | | Intervertebral Implant | | | Utility | | | 15/098,897 | | | 10,085,845 | | | 4/23/2030 | | | Issued | | |
Centinel Spine LLC
|
| | prodisc C Vivo | |
| |
United States
|
| |
Intervertebral Implant
|
| | Utility | | | 16/148,120 | | | 11,419,734 | | | 4/09/2030 | | | Issued | | |
Centinel Spine LLC
|
| | prodisc C Vivo | |
| | United States | | | Intervertebral Implant | | | Utility | | | 17/892,663 | | | 12,102,543 | | | 4/09/2030 | | | Issued | | |
Centinel Spine LLC
|
| | prodisc C Vivo | |
| |
United States
|
| |
Intervertebral Implant with Combination Fixation Elements
|
| | Utility | | | 18/901,592 | | | TBD | | | TBD | | | Pending | | |
Centinel Spine LLC
|
| | prodisc C Vivo | |
| | China | | | Intervertebral Implant | | | Utility | | | 20180066085.3 | | | 102821718 | | | 4/09/2030 | | | Issued | | |
Centinel Spine LLC
|
| | prodisc C Vivo | |
177
| |
Country
|
| |
Title
|
| |
Type
|
| |
Application No.
|
| |
Patent No.
|
| |
Estimated
Expiration Date |
| |
Status
|
| |
Ownership
|
| |
Related
Technology |
|
| | Germany | | |
Intervertebral Implant
|
| | Utility | | |
112010005
471.1 |
| | TBD | | |
4/09/2030
|
| | Pending | | |
Centinel Spine LLC
|
| | prodisc C Vivo | |
| | United States | | |
Intervertebral Disc Implants Having Varying Endplate Geometries
|
| | Utility | | | 19/410,553 | | | TBD | | | TBD | | | Pending | | |
Centinel Spine LLC
|
| |
Spinal implants related to prodisc
|
|
| | PCT | | |
Intervertebral Disc Implants Having Varying Endplate Geometries
|
| | Utility | | |
PCT/US25/
058335 |
| | N/A | | |
6/06/2027
|
| | Pending | | |
Centinel Spine LLC
|
| |
Spinal implants related to prodisc
|
|
| |
United States
|
| |
Intervertebral Disc Implants Having Offset Center of Rotation
|
| | Utility | | | 19/410,445 | | | TBD | | | TBD | | | Pending | | |
Centinel Spine LLC
|
| |
Spinal implants related to prodisc
|
|
| | PCT | | |
Intervertebral Disc Implants Having Offset Center of Rotation
|
| | Utility | | |
PCT/US25/
058314 |
| | N/A | | |
6/06/2027
|
| | Pending | | |
Centinel Spine LLC
|
| |
Spinal implants related to prodisc
|
|
| | United States | | |
Intervertebral Disc Implants With Varying Cup and Dome Geometries
|
| | Utility | | | 19/410,279 | | | TBD | | | TBD | | | Pending | | |
Centinel Spine LLC
|
| |
Spinal implants related to prodisc
|
|
| | PCT | | |
Intervertebral Disc Implants With Varying Cup and Dome Geometries
|
| | Utility | | |
PCT/US25/
058293 |
| | N/A | | |
6/06/2027
|
| | Pending | | |
Centinel Spine LLC
|
| |
Spinal implants related to prodisc
|
|
| | United States | | |
Intervertebral Disc Implants Having Reduced Profiles
|
| | Utility | | | 63/916,987 | | | N/A | | | 11/13/2026 | | | Pending | | |
Centinel Spine LLC
|
| |
Spinal implants related to prodisc
|
|
Trademarks
As of June 30, 2026, we owned seven active registered trademarks in the United States, including prodisc. As of June 30, we also owned three pending applications for PRODISC C SK, MATCH THE DISC, and ANATOMIC ENDPLATES in the United States. As of June 30, 2026, we also owned 14 active registered trademarks in Canada, Colombia, France, Hong Kong, India, International (WIPO), Mexico, New Zealand, South Korea, and Taiwan.
Trade Secrets
We may rely, in part, on trade secret law to protect some of our technology that has not yet been patent protected, or is not appropriate for patent protection. Trade secrets, however, can be difficult to protect.
We seek to protect our proprietary technology and manufacturing process, in part, by confidentiality and invention assignment agreements with employees, under which they are bound to assign to us any and all
178
inventions that are made during the term of their employment and relate to our business, unless there is an exception. These agreements further prohibit our employees from using, disclosing, or bringing onto our premises any proprietary information belonging to any third-party. In addition, our consultants, scientific advisors and contractors are required to sign agreements under which they must assign to us any and all inventions during the applicable service term and that relate to our business. These agreements also prohibit these third-parties from incorporating into any inventions the proprietary rights of such third-parties without informing us. It is our policy to require all employees to document potential inventions and other intellectual property in laboratory notebooks and to disclose inventions to patent counsel.
We also seek to preserve the integrity and confidentiality of our data, trade secrets and know-how by taking commercially reasonable efforts to maintain the physical security of our premises and physical and electronic security of our information technology systems.
While we have confidence in these individuals, organizations and systems, our security measures may be breached, or may otherwise prove inadequate to protect the integrity and confidentiality of our data and trade secrets. Further, our agreements may be breached (or not obtained in the first place) and we may not have adequate remedies for any breach. In addition, our trade secrets may otherwise become known or be independently discovered by competitors. To the extent that our consultants, contractors or collaborators use intellectual property owned by others in their work for us, disputes may arise as to the rights in related or resulting know-how and inventions.
Copyrights
We use a variety of written materials subject to copyright in our business, including marketing materials, product materials, and our website. As of June 30, 2026, we have not registered any of our materials with the U.S. Copyright Office, but the owned works of authorship are protected under U.S. copyright law.
Government Regulation
United States
In the U.S., medical devices are subject to extensive regulation by the FDA, under the Federal Food, Drug, and Cosmetic Act, or the FDCA, and its implementing regulations, and certain other federal and state statutes and regulations. The laws and regulations govern, among other things, the design, manufacture, storage, recordkeeping, approval, labeling, promotion, post-approval monitoring and reporting, distribution and import and export of medical devices. Failure to comply with applicable requirements may subject a device and/or its manufacturer to a variety of administrative and judicial sanctions, such as FDA refusal to approve pending pre-market approval applications, or PMAs, issuance of warning letters or untitled letters, mandatory product recalls, import detentions, civil monetary penalties, and/or judicial sanctions, such as product seizures, injunctions, and criminal prosecution.
The FDCA classifies medical devices into one of three categories based on the risks associated with the device and the level of control necessary to provide reasonable assurance of safety and effectiveness. Class I devices are deemed to be low risk and are subject only to the general regulatory controls, which include compliance with the applicable portions of the Quality Management System Regulation, or QMSR, facility registration and product listing, reporting of adverse medical events, and truthful and non-misleading labeling, advertising, and promotional materials. Class II devices are moderate risk. They are subject to general controls and may also be subject to special controls as deemed necessary by the FDA to ensure the safety and effectiveness of the device. These special controls can include performance standards, post-market surveillance, patient registries, and FDA guidance documents. Class III devices are generally the highest risk devices. They are required to obtain premarket approval and comply with postmarket conditions of approval in addition to general regulatory controls.
Establishments that design and/or manufacture devices are required to register their establishments with the FDA. They also must provide the FDA with a list of the devices that they design and/or manufacture at their facilities.
The FDA enforces its requirements by market surveillance and periodic visits, both announced and unannounced, to inspect or re-inspect equipment, facilities, laboratories and processes to confirm regulatory
179
compliance. These inspections may include the manufacturing facilities of subcontractors. Following an inspection, the FDA may issue a report, known as a Form 483, listing instances where the manufacturer has failed to comply with applicable regulations and/or procedures or, if observed violations are sufficiently severe and urgent, a warning letter. If the manufacturer does not adequately respond to a Form 483 or warning letter, the FDA may take enforcement action against the manufacturer or impose other sanctions or consequences.
Pre-Market Authorization Processes
While most Class I and some exempt Class II devices may be marketed without prior FDA authorization, most other medical devices can be legally sold within the U.S. only if the FDA has: (i) approved a pre-market approval, or PMA, application prior to marketing, generally applicable to most Class III devices; (ii) cleared the device in response to a premarket notification under Section 510(k) of the FDCA, often referred to as a 510(k) clearance, generally applicable to some Class I and most Class II devices; or (iii) authorized the device to be marketed through the de novo classification process, generally applicable to novel devices that are low to moderate risk but have not previously been classified by the FDA and are therefore automatically classified as Class III by operation of law.
510(k) Premarket Notification
Manufacturers of some Class I and most Class II devices are required to submit to the FDA a premarket notification under Section 510(k) of the FDCA seeking clearance to commercially distribute the device. To obtain 510(k) clearance, a manufacturer must submit a premarket notification demonstrating that the proposed device is substantially equivalent to a legally marketed device, referred to as the “predicate device.” A predicate device may be a previously 510(k) cleared device or a Class III device that was in commercial distribution before May 28, 1976 for which the FDA has not yet called for PMA applications, or a product previously placed in Class II or Class I through the de novo classification process. The manufacturer must show that the proposed device has the same intended use as the predicate device, and it either has the same technological characteristics, or it is as safe and effective and does not raise different questions of safety and effectiveness as compared to the predicate device.
The FDA has a user fee goal to apply no more than 90 FDA review days to 510(k) submissions. During the process, the FDA may issue an Additional Information request, which stops the clock. The applicant has 180 calendar days to respond. Therefore, the total review time under the user fee goals currently in effect is up to 270 days,. The FDA may require additional information, including clinical data, to make a determination regarding substantial equivalence.
If the FDA agrees that the device is substantially equivalent to a predicate device currently on the market, it will grant 510(k) clearance to commercially market the device. If the FDA determines that the device is “not substantially equivalent” to a previously cleared device, the device is automatically designated as a Class III device. The device sponsor must then resubmit a new 510(k) addressing FDA’s concerns, fulfill more rigorous PMA requirements, or can request a risk-based classification determination for the device in accordance with the de novo classification process, which is a route to market for novel medical devices that are low to moderate risk and are not substantially equivalent to a predicate device.
After a device receives 510(k) clearance, any modification that could significantly affect its safety or effectiveness, or that would constitute a major change in its intended use, requires a new 510(k) clearance or could require a PMA approval or de novo classification. The FDA requires each manufacturer to make this determination in the first instance, but the FDA can review any such decision. If the FDA disagrees with a manufacturer’s decision not to seek a new 510(k) clearance for the modified device, the agency may retroactively require the manufacturer to seek 510(k) clearance, de novo classification, or PMA approval. The FDA also can require the manufacturer to cease marketing and/or recall the modified device until 510(k) clearance, de novo classification or PMA approval is obtained. Should a manufacturer decline to work cooperatively with the FDA to come into compliance, the manufacturer may be subject to significant regulatory fines or penalties.
De Novo Classification
Devices of a new type that the FDA has not previously classified are automatically classified into Class III regardless of the level of risk they pose. To avoid requiring PMA review of novel low- to moderate-risk devices
180
classified in Class III by operation of law, Congress enacted a provision that allows the FDA to classify a novel low- to moderate-risk device into Class I or II in the absence of a predicate device that would support 510(k) clearance called the “Request for Evaluation of Automatic Class III Designation,” or de novo classification pathway. The FDA evaluates the safety and effectiveness of devices submitted for review under the de novo pathway and devices determined to be Class II through this pathway can serve as predicate devices for future 510(k) applicants. The de novo pathway usually requires clinical data.
The FDA has a user fee goal to review a de novo request in 150 FDA review days. During the process, the FDA may issue an Additional Information request, which stops the clock. The applicant has 180 calendar days to respond following which the FDA will continue its review. Therefore, the total review time under the user fee goals currently in effect could be as long as 330 days, although this process may take significantly longer.
If the manufacturer seeks reclassification into Class II, the manufacturer must include a draft proposal for special controls that are necessary to provide a reasonable assurance of the safety and effectiveness of the medical device. If the FDA grants the de novo request, the device may be legally marketed in the United States. However, the FDA may reject the request if the FDA identifies a legally marketed predicate device that would be appropriate for a 510(k) notification, determines that the device is not low-to-moderate risk, or determines that General Controls would be inadequate to control the risks and/or special controls cannot be developed. After a device receives de novo classification, any modification that could significantly affect its safety or efficacy, or that would constitute a major change or modification in its intended use, will require a new 510(k) clearance or, depending on the modification, another de novo classification or even PMA approval.
PMA Approval
A Class III product not eligible for either 510(k) clearance or de novo classification must follow the PMA approval pathway. Class III devices require PMA approval before they can be marketed, although some pre-amendment Class III devices for which the FDA has not yet required a PMA are cleared through the 510(k) process. In a PMA, results from adequate and well-controlled clinical studies are required for each indication for which FDA approval is sought. After completion of the required clinical testing, a PMA including the results of all non-clinical, clinical, and other testing and information relating to the product’s marketing history, design, labeling, manufacture, and controls, is prepared and submitted to the FDA.
The PMA approval process is generally more expensive, rigorous, lengthy, and uncertain than the 510(k) premarket notification process and de novo classification process and requires proof of the safety and effectiveness of the device to the FDA’s satisfaction. Following receipt of a PMA, the FDA determines whether the application is sufficiently complete to permit a substantive review. As part of the PMA review, the FDA will typically inspect the applicant or its third-party manufacturers’ or suppliers’ manufacturing facilities for compliance with QMSR requirements, which impose elaborate testing, control, documentation and other quality assurance procedures. The FDA has a user fee goal to review a PMA in 180 FDA review days, if the submission does not require advisory committee input, or 320 FDA review days if the submission does require advisory committee input. During the process, the FDA may issue a major deficiency letter, which stops the review clock. The applicant has up to 180 calendar days to respond following which the FDA will continue its review. Therefore, the total review time under the user fee goals currently in effect could be up to 360 days, if the submission does not require advisory committee input, or 500 days if the submission does require advisory committee input. However, in practice, the FDA’s review could take significantly longer.
If the FDA’s evaluation of the PMA application is favorable, the FDA will issue a PMA for the approved indications, which can be more limited than those originally sought by the manufacturer. The PMA can include post-approval conditions that the FDA believes necessary to ensure the safety and effectiveness of the device including, among other things, restrictions on labeling, promotion, sale and distribution. The FDA may condition PMA approval on some form of post-market surveillance when deemed necessary to protect the public health or to provide additional safety and efficacy data for the device in a larger population or for a longer period of use. In such cases, the manufacturer might be required to follow certain patient groups for a number of years and to make periodic reports to the FDA on the clinical status of those patients. Failure to comply with the conditions of approval can result in material adverse enforcement action, including the loss or withdrawal of the approval and/or placement of restrictions on the sale of the device until the conditions are satisfied.
181
Even after approval of a PMA, a new PMA or PMA supplement may be required in the event of a modification to the device, its labeling or its manufacturing process. Supplements to a PMA often require the submission of the same type of information required for an original PMA, except that the supplement is generally limited to that information needed to support the proposed change from the product covered by the original PMA.
Clinical studies
Generally, at least one clinical trial is required to support a PMA application. Clinical studies also may be required for de novo classification or a premarket notification. Clinical studies may also be required to satisfy post-approval requirements for devices with PMAs or, in certain circumstances, de novo classifications. All clinical studies of devices to determine safety and effectiveness must be conducted in accordance with the FDA’s IDE regulations which govern investigational device labeling, prohibit promotion of the investigational device, and specify an array of recordkeeping, reporting and monitoring responsibilities of study sponsors and study investigators. For significant risk investigational devices, the FDA regulations require that human clinical studies conducted in the U.S. be approved under an IDE, which must become effective before clinical testing may commence. A nonsignificant risk investigational device does not require FDA approval of an IDE before initiating human clinical studies, but must still comply with abbreviated IDE requirements when conducting such trials. A significant risk device is one that presents a potential for serious risk to the health, safety or welfare of a patient and either is implanted, used in supporting or sustaining human life, substantially important in diagnosing, curing, mitigating or treating disease or otherwise preventing impairment of human health, or otherwise presents a potential for serious risk to a subject. In some cases, one or more smaller IDE studies may precede a pivotal clinical trial intended to demonstrate the safety and efficacy of the investigational device. The FDA has 30 days from receipt of an IDE submission within which to approve the IDE, respond with items to address before the FDA will approve the IDE, or deny the IDE. If the FDA has not responded within 30 days, the IDE is deemed approved and clinical testing may begin. If the FDA denies the IDE within this 30-day period, the clinical trial proposed in the IDE may not begin. If the FDA provides feedback on the protocol that must be addressed prior to approval, the clinical testing may not begin until those items are addressed to the FDA’s satisfaction. The FDA may also issue a conditional approval which allows the sponsor to begin subject enrollment while addressing the FDA’s outstanding concerns.
An IDE application must be supported by appropriate data, such as animal and laboratory test results, showing that it is safe to test the device in humans and that the testing protocol is scientifically sound. The IDE application must also include a description of product manufacturing and controls, and a proposed clinical trial protocol. The FDA typically grants IDE approval for a specified number of patients to be treated at specified study centers. During the study, the sponsor must comply with the FDA’s IDE requirements for investigator selection, trial monitoring, adverse event reporting, record keeping and prohibitions on the promotion of investigational devices or on making safety or effectiveness claims for them. The investigators must obtain patient informed consent, follow the investigational plan and study protocol, control the disposition of investigational devices, and comply with reporting and record keeping requirements. Prior to granting PMA approval, the FDA typically inspects the records relating to the conduct of the study and the clinical data supporting the PMA application for compliance with IDE requirements.
Clinical studies must be conducted: (i) in compliance with federal regulations; (ii) in compliance with good clinical practice (“GCP”), an international standard intended to protect the rights and health of patients and to define the roles of clinical trial sponsors, investigators, and monitors; and (iii) under protocols detailing the objectives of the trial, the parameters to be used in monitoring safety, and the effectiveness criteria to be evaluated. Clinical studies are typically conducted at geographically diverse clinical trial sites, and are designed to permit the FDA to evaluate the overall benefit-risk relationship of the device and to provide adequate information for the labeling of the device when considering whether a device satisfies the statutory standard for commercialized. Clinical studies, for both significant and nonsignificant risk devices, must be approved by an institutional review board (“IRB”)—an appropriately constituted group that has been formally designated to review and monitor biomedical research involving human subjects and which has the authority to approve, require modifications in, or disapprove research to protect the rights, safety, and welfare of the human research subject. If an IDE application is approved by the FDA and one or more IRBs, human clinical studies may begin at a specific number of investigational sites with a specific number of patients, as approved by the FDA. If the device presents a non-significant risk to the patient, a sponsor may begin the clinical trial after obtaining
182
approval for the trial by one or more IRBs without separate approval from the FDA, but must still follow abbreviated IDE requirements, such as monitoring the investigation, ensuring that the investigators obtain informed consent, and complying with labeling and record-keeping requirements. In some cases, an IDE supplement must be submitted to, and approved by, the FDA before a sponsor or investigator may make a change to the investigational plan that may affect its scientific soundness, study plan or the rights, safety or welfare of human subjects.
The FDA may order the temporary, or permanent, discontinuation of a clinical trial at any time, or impose other sanctions, if it believes that the clinical trial either is not being conducted in accordance with the FDA requirements or presents an unacceptable risk to the clinical trial patients. An IRB may also require the clinical trial it has approved to be halted, either temporarily or permanently, for failure to comply with the IRB’s requirements, or may impose other conditions or sanctions.
Although the QMSR does not fully apply to investigational devices, the requirement for controls on design and development does apply. The sponsor also must manufacture the investigational device in conformity with the quality controls described in the IDE application and any conditions of IDE approval that the FDA may impose with respect to manufacturing.
Postmarket Requirements
After a device is placed on the market, numerous general regulatory controls apply. These include: the QMSR, labeling regulations, product listing and establishment registration, authorization of marketing of certain modifications that would significantly affect safety or effectiveness or that would constitute a major change in intended use, the medical device reporting regulations (which require that manufacturers report to the FDA if their device may have caused or contributed to a death or serious injury or malfunctioned in a way that would likely cause or contribute to a death or serious injury if it were to recur), and reports of corrections and removals (recall) regulations (which require manufacturers to report recalls or removals and field corrections to the FDA if initiated to reduce a risk to health posed by the device or to remedy a violation of the FDCA). Failure to properly identify reportable events or to file timely reports, as well as failure to address inspectional observations to the FDA’s satisfaction, can subject a manufacturer to warning letters, recalls, or other sanctions and penalties.
Advertising, marketing and promotional activities for devices are also subject to FDA oversight and must comply with the statutory standards of the FDCA, and the FDA’s implementing regulations. The FDA’s oversight authority review of marketing and promotional activities encompasses, but is not limited to, direct-to-consumer advertising, healthcare provider-directed advertising and promotion, sales representative communications to healthcare professionals, promotional programming and promotional activities involving electronic media. The FDA also regulates industry-sponsored scientific and educational activities that make representations regarding product safety or efficacy in a promotional context. The Federal Trade Commission (“FTC”) also may have jurisdiction over the marketing and advertising of certain medical devices.
Manufacturing processes for medical devices are required to comply with the applicable portions of the QMSR, which cover the methods and the facilities and controls for the design, manufacture, testing, production, processes, controls, quality assurance, labeling, packaging, distribution, installation and servicing of finished devices intended for human use. Manufacturers are subject to periodic scheduled and unscheduled inspections by the FDA. Failure to maintain compliance with the QMSR requirements could result in the FDA taking enforcement action such as issuing a warning letter, the shut-down of, or restrictions on, manufacturing operations and the recall or seizure of marketed products. The discovery of previously unknown problems with any marketed products, including unanticipated adverse events or adverse events of increasing severity or frequency, whether resulting from the use of the device within the scope of its clearance or approval, or off-label by a physician in the practice of medicine, could result in restrictions on the device, including the removal of the product from the market or voluntary or mandatory device recalls.
The FDA has broad regulatory compliance and enforcement powers. If the FDA determines that a manufacturer has failed to comply with applicable regulatory requirements, it can take a variety of compliance or enforcement actions, which may result in any of the following sanctions: warning letters, untitled letters, fines, injunctions, consent decrees and civil penalties; recalls, withdrawals, or administrative detention or seizure of products; operating restrictions or partial suspension or shutdown of production; refusing or
183
delaying requests for 510(k) clearance, de novo classification, or PMA approvals of new products or modified products; withdrawing 510(k) clearances, de novo classifications, or PMA approvals that have already been granted; refusal to grant export approvals for products; or criminal prosecution.
Manufacturers of medical devices are permitted to promote products solely for the uses and indications set forth in the approved or cleared product labeling. A number of enforcement actions have been taken against manufacturers that promote products for “off-label” uses (i.e., uses that are not described in the approved or cleared labeling), including actions alleging that claims submitted to government healthcare programs for reimbursement of products that were promoted for “off-label” uses are fraudulent in violation of the Federal False Claims Act or other federal and state statutes and that the submission of those claims was caused by off-label promotion. The failure to comply with prohibitions on “off-label” promotion can result in significant monetary penalties, revocation or suspension of a company’s business license, suspension of sales of certain products, product recalls, civil or criminal sanctions, exclusion from participating in federal healthcare programs, or other enforcement actions. In the United States, allegations of such wrongful conduct could also result in a corporate integrity agreement with the U.S. government that imposes significant administrative obligations and costs.
Violations of the FDCA relating to the inappropriate promotion of approved products may lead to investigations alleging violations of federal and state healthcare fraud and abuse and other laws, as well as state consumer protection laws.
The FDA also may require post-marketing testing, surveillance, or other measures to monitor the effects of an authorized device product. The FDA may place conditions on a device that could restrict the distribution or use of the product. In addition, quality-control, manufacturing, packaging, and labeling procedures must continue to conform to the QMSR after marketing authorization, and manufacturers are subject to periodic inspections by the FDA. Accordingly, manufacturers must continue to expend time, money, and effort in the areas of production and quality-control to maintain compliance with the QMSR. The FDA may withdraw product marketing authorizations or recommend or require product recalls if a company fails to comply with regulatory requirements.
Other Healthcare Laws
Our business operations and current and future arrangements with healthcare professionals, consultants, customers and patients, expose us to broadly applicable state, federal, and foreign fraud and abuse and other healthcare laws and regulations. These laws constrain the business and financial arrangements and relationships through which we conduct our operations, including how we research, market, sell and distribute our products. Such laws include, but are not limited to:
•
the U.S. federal Anti-Kickback Statute, which prohibits, among other things, persons and entities from knowingly and willfully soliciting, offering, receiving or providing remuneration, directly or indirectly, in cash or in kind, to induce or reward, or in return for, either the referral of an individual for, or the purchase, order or recommendation of, any good or service, for which payment may be made under a U.S. healthcare program such as Medicare and Medicaid. A person or entity does not need to have actual knowledge of the U.S. federal Anti-Kickback Statute or specific intent to violate it in order to have committed a violation. In addition, the government may assert that a claim including items or services resulting from a violation of the U.S. federal Anti-Kickback Statute constitutes a false or fraudulent claim for purposes of the federal civil False Claims Act;
•
the “Stark Law,” which prohibits a physician from referring Medicare or Medicaid patients to an entity providing “designated health services,” which includes durable medical equipment, if the physician or immediate family member of the physician, has a financial relationship, including an ownership or investment interest in or compensation arrangement, with such entity that does not fit within a Stark exception;
•
U.S. federal civil and criminal false claims laws, including the federal civil False Claims Act, which can be enforced through civil whistleblower or qui tam actions against individuals or entities, and which prohibit, among other things, individuals or entities from knowingly presenting, or causing to be presented, to the U.S. government, claims for payment or approval that are false or fraudulent, knowingly making, using or causing to be made or used, a false record or statement material to a false
184
or fraudulent claim, or from knowingly making a false statement to avoid, decrease or conceal an obligation to pay money to the U.S. government. Persons and entities can be held liable under these laws if they are deemed to “cause” the submission of false or fraudulent claims by, for example, providing inaccurate billing or coding information to customers or promoting a product off-label;
•
the federal Civil Monetary Penalties Law, which imposes civil fines for, among other things, the offering or transfer of remuneration to a Medicare or state healthcare program beneficiary if the person knows or should know it is likely to influence the beneficiary’s selection of a particular provider, practitioner, or supplier of services reimbursable by Medicare or a state healthcare program, unless an exception applies;
•
the U.S. Health Insurance Portability and Accountability Act of 1996, or HIPAA, which imposes criminal and civil liability for, among other things, knowingly and willfully executing, or attempting to execute, a scheme to defraud any healthcare benefit program, or knowingly and willfully falsifying, concealing or covering up a material fact or making any materially false statement, in connection with the delivery of, or payment for, healthcare benefits, items or services. Similar to the U.S. federal Anti-Kickback Statute, a person or entity does not need to have actual knowledge of the health care fraud statute implemented under HIPAA or specific intent to violate it in order to have committed a violation;
•
in addition, HIPAA, as amended by the Health Information Technology for Economic and Clinical Health Act of 2009, or HITECH, and its implementing regulations, imposes obligations, including mandatory contractual terms, with respect to safeguarding the privacy, security and transmission of individually identifiable health information without appropriate authorization by covered entities subject to the rule, including health plans, healthcare clearinghouses and certain healthcare providers, as well as their business associates and covered subcontractors that perform certain services for or on their behalf involving the use or disclosure of individually identifiable health information;
•
the U.S. Physician Payments Sunshine Act, which requires certain manufacturers of drugs, devices, biologics and medical supplies for which payment is available under Medicare, Medicaid or the Children’s Health Insurance Program (with certain exceptions) to report annually to the government information related to payments or other “transfers of value” made to physicians (defined to include doctors, dentists, optometrists, podiatrists and chiropractors), teaching hospitals, physician assistants, nurse practitioners, clinical nurse specialists, anesthesiologist assistants, certified registered nurse anesthetists, and certified nurse-midwives and requires applicable manufacturers and group purchasing organizations to report annually to the government ownership and investment interests held by the physicians described above and their immediate family members; and
•
analogous state and non-U.S. laws and regulations, such as state anti-kickback and false claims laws, which may apply to our business practices, including, but not limited to, research, distribution, sales and marketing arrangements and claims involving healthcare items or services reimbursed by non-governmental third-party payors, including private insurers, or by the patients themselves; state laws that require pharmaceutical and device companies to comply with the industry’s voluntary compliance guidelines and the relevant compliance guidance promulgated by the U.S. government, or otherwise restrict payments that may be made to healthcare providers and other potential referral sources; state laws and regulations that require manufacturers to report information related to payments and other transfers of value to physicians and other healthcare providers or marketing expenditures and pricing information; and state and non-U.S. laws governing the privacy and security of health information in some circumstances, many of which differ from each other in significant ways and often are not preempted by HIPAA, thus complicating compliance efforts.
In particular, activities and arrangements in the healthcare industry are subject to extensive laws and regulations intended to prevent fraud, waste and other abusive practices. These laws and regulations may restrict or prohibit a wide range of activities or other arrangements related to the development, marketing or promotion of products, including pricing and discounting of products, provision of clinical training, provision of customer incentives, provision of reimbursement support, other customer support services, provision of sales commissions or other incentives to employees and independent contractors and other interactions with healthcare practitioners and patients.
185
Because of the breadth of these laws and the narrow scope of the statutory or regulatory exceptions and safe harbors available, our business activities could be challenged under one or more of these laws. Relationships between medical product manufacturers and health care providers are an area of heightened scrutiny by the government. We may engage in various activities, including the conduct of speaker programs to educate physicians, the provision of reimbursement advice and support to customers, and the provision of customer and patient support services, that have been the subject of government scrutiny and enforcement action within the medical device industry.
Government expectations and industry best practices for compliance continue to evolve and past activities may not always be consistent with current industry best practices. Further, there is a lack of government guidance as to whether various industry practices comply with these laws, and government interpretations of these laws continue to evolve, all of which creates compliance uncertainties. Any non-compliance could result in significant regulatory sanctions, criminal or civil liability and serious harm to our reputation. It is not always possible to identify and deter misconduct, and the precautions we take to detect and prevent this activity may not be effective in preventing such conduct, mitigating risks, or reducing the chance of governmental investigations or other actions or lawsuits stemming from a failure to comply with these laws or regulations.
If a government entity opens an investigation into possible violations of any of these laws (which may include the issuance of subpoenas), we would have to expend significant resources to defend ourselves against the allegations. Defending against any such actions can be costly, time-consuming and may require significant financial and personnel resources. Therefore, even if we are successful in defending against any such actions that may be brought against us, our business may be impaired. If any of the above occur, it could adversely affect our ability to operate our business and our results of operations.
Allegations that we, our officers, or our employees violated any one of these laws can be made by individuals called “whistleblowers” who may be our employees, customers, competitors or other parties. Government policy is to encourage individuals to become whistleblowers and file a complaint in federal court alleging wrongful conduct. The government is required to investigate all of these complaints and decide whether to intervene. If the government intervenes and we are required to pay money back to the government as a result of a settlement or judgement, the whistleblower, as a reward, is awarded a percentage. If the government declines to intervene, the whistleblower may proceed on his or her own and, if successful, he or she will receive a percentage of any judgment or settlement amount the company is required to pay. The government may also initiate an investigation on its own. If any such actions are instituted against us, those actions could have a significant impact on our business, including the imposition of significant fines, and other sanctions that may materially impair our ability to run a profitable business. In particular, if our operations are found to be in violation of any of the laws described above or if we agree to settle with the government without admitting to any wrongful conduct or if we are found to be in violation of any other governmental regulations that apply to us, we, our officers and employees may be subject to sanctions, including significant administrative, civil and criminal penalties, damages, fines, exclusion from participation in government health care programs, such as Medicare and Medicaid, imprisonment, the curtailment or restructuring of our operations and additional regulatory monitoring and oversight associated with the imposition of a corporate integrity agreement, any of which could adversely affect our business, results of operations and financial condition.
Pre-market requirements in the EU
In the EU, our products are classified as being in Class III. They therefore require the highest level of regulatory controls and the best quality clinical evidence from clinical trial data showing an appropriate risk/ benefit analysis in respect of safety and efficacy.
Medical device laws in the EU are in a transitional phase, with new regulations replacing the previous directives. Modifications arising from the EU regulations (Regulation (EU) 2017/745 (MDR)) affects the regulation of our products placed on the market in all countries accepting CE marked medical devices. These countries include the EU 27 member states, the UK, the EEA countries of Norway, Lichtenstein and Iceland, and Turkey as well as many other countries around the world.
Under the MDR, all our devices currently in the market must undergo a new regulatory review and rewriting of regulatory documents and processes in order to remain on the market after the end of the applicable
186
transition period. These reviews and processes are all more detailed and rigorous than under the directives. Our Class III devices are subject to a new additional review by the EU Commission’s relevant expert panel. The expert panel issues a scientific opinion which can recommend that a device might or might not be placed on the market, and/ or that the intended purpose of the device be restricted by type of patient or indication and to limit the period of validity for the certificate. The notified body is likely to follow the opinion of the EU regulatory panel when issuing its certificate and there is no appeal process with respect to the scientific opinion, instead a new application must be made with information and data addressing the deficiencies. If the expert panel determines that our products should not be placed on the market, we will have to provide additional information, and most likely to obtain additional clinical data, either prospective or retrospective in origin, to support a new application. If the expert panel determines that our devices should have a narrower intended purpose than we anticipated, our sales volumes are likely to be detrimentally affected.
For legacy devices, their continued use and transition to MDR certification requires that they: remain in compliance with MDD; have no significant changes in design or intended purpose; do not present an unacceptable risk to the health or safety or patients, users or other persons or to other aspects of the protection of public health; and be included since 26 May 2024 in a quality management system (QMS) compliant with the MDR; and be the subject of an application to a notified body for a conformity assessment and of a signed, written agreement entered into with the notified body no later than 26 September 2024.
The MDR has been fully applicable since May 26, 2021. In accordance with the MDR’s recently extended transitional provisions, both (i) devices lawfully placed on the market pursuant to the MDD prior to May 26, 2021 and (ii) legacy devices lawfully placed on the EU market after May 26, 2021 in accordance with the MDR transitional provisions may generally continue to be made available on the market or put into service, provided that the requirements of the transitional provisions are fulfilled. In particular, no significant change must be made to the device, as such a modification would trigger the obligation to obtain a new certification under the MDR and therefore to have a notified body conduct a new conformity assessment of the device. The extended transitional deadlines are December 31, 2027 for Class III and certain Class IIb implantable devices and December 31, 2028 for other Class IIb devices, Class IIa devices and certain Class I devices. However, even during the transitional period, manufacturers must comply with a number of new or reinforced requirements set forth in the MDR with regard to registration of economic operators and of devices, post-market surveillance and vigilance requirements. In the EU, our implant products are currently classified as Class IIb under the MDD (pursuant to certificates issued by BSI, our notified body) and will be classified as Class III under the MDR. Our surgical instruments are classified separately as Class IIa or Class I (reusable) devices. Class III devices under the MDR require the highest level of regulatory controls and the best quality clinical evidence from clinical studies to demonstrate an appropriate risk-benefit analysis in respect of safety and efficacy.
Our medical devices currently on the market in the EU and the UK are subject to notified body certification by BSI pursuant to the national implementations of the provisions of the applicable Directive and the transitional provisions of the MDR. If we fail to either meet the requirements of the transitional provisions ahead of obtaining MDR certificates, or to obtain MDR certificates before the applicable dates we risk losing the right to place our products on the EU market as well as all other countries that accept CE-marked products. Because of a lack of capacity with notified bodies, obtaining certificates of conformity is subject to timelines of up to one to three years.
In the EU, we are unable to make any substantial changes to the design or quality management systems our medical devices until we receive our new MDR certificate of conformity from our notified body/bodies. If technical, operational, or regulatory reasons necessitate a substantial change to a product requiring a notified body certificate of conformity, we might have to remove it from the market until we obtain our MDR certificate of conformity.
We obtained from our notified body, BSI Group The Netherlands B.V., certificates of conformity to the MDR requirements for our: prodisc C Vivo, in July 2026; prodisc C Nova cervical total disc replacement systems, in September 2025; prodisc L total disc replacement system, in September 2026; and prodisc Class IIa instruments in July 2026.
187
In the EU, there are continuing obligations for post-market compliance and which, if not complied with, could lead to fines, penalties, criminal sanctions and a requirement to withdraw our products from the market.
The EU regulatory system for medical devices requires a continuous system of vigilance, testing and review. Any potential issues with a device can lead to lengthy and time-consuming correspondence with national competent authorities and investigations by them and by notified bodies. In the EU, national competent authorities and notified bodies have the power to request that new instructions are issued to the market regarding a device, or that sales are suspended, products quarantined and, in some cases, withdrawn from the market altogether. Manufacturing sites as well as distribution centers and regulatory activities might also be audited at any time by affected competent authorities and by any relevant notified body. The changes to the PMS under the MDR require that the PMS is proactive rather than simply reactive. The MDR also requires a higher level of engagement with distributors and other economic operators to assure product compliance throughout the supply chain.
Adverse Event Reporting in the EU
All manufacturers placing medical devices on the market in the EU must comply with the EU medical device vigilance system, which has been reinforced by the MDR. Under this system, serious incidents and Field Safety Corrective Actions (FSCAs) must be reported to the relevant authorities of the EU member states. These reports will have to be submitted through EUDAMED once functional and aim to ensure that, in addition to reporting to the relevant authorities of the EU member states, other actors such as the economic operators in the supply chain will also be informed.
Manufacturers are required to take Field Safety Corrective Actions (FSCAs), which are defined as any corrective action for technical or medical reasons to prevent or reduce a risk of a serious incident associated with the use of a medical device that is made available on the market. A serious incident is any malfunction or deterioration in the characteristics or performance of a device on the market (e.g., inadequacy in the information supplied by the manufacturer, undesirable side-effect), which, directly or indirectly, might lead to either the death or serious deterioration of the health of a patient, user, or other persons, or to a serious public health threat. An FSCA may include the recall, modification, exchange, destruction or retrofitting of the device. FSCAs must be communicated by the manufacturer or its legal representative to its customers and/or to the end users of the device through Field Safety Notices (FSN). For similar serious incidents that occur with the same device or device type and for which the root cause has been identified or an FSCA implemented or where the incidents are common and well documented, manufacturers may provide periodic summary reports instead of individual serious incident reports.
Manufacturers (and authorized representatives) must also have available within their organization at least one person responsible for regulatory compliance, or PRRC, who possesses the requisite expertise in the field of medical devices. The PRRC is responsible for all aspects of compliance with the requirements of the MDR and in particular compliance with post-market surveillance and vigilance requirements. Authorized representatives are also required to have their own PRRC.
In the event of a serious adverse event, national competent authorities might require that corrective action is taken, including a withdrawal of the product from the EU market and the notified body might withdraw or suspend their conformity assessment certificate, preventing further products being placed on the market. Corrective actions are required to be notified via FSN issued to every person on the supply chain for the products. Each such person is required to acknowledge the notice and confirm that they have copied with the contents. FSNs are agreed with the competent authorities in each member state where the product is sold. These notifications and tracking of acknowledgements can be a time consuming and expensive exercise. They can also diminish our reputation with customers and generally in the marketplace and might lead to customers not renewing contracts and a decrease in product sales.
Other Healthcare Laws in Europe
Advertising and marketing materials are subject to regulation in individual countries in Europe, with off-label uses being prohibited in every country and in some countries no consumer-facing and promotion of medical devices is permitted for any or for prescription-only devices. Within the EU, the requirements are enormously varied as between countries, which can be challenging because reviews need to be undertaken country by
188
country, in particular in relation to any advertising that is likely to be seen by the general public. Failure to adhere to local regulations on the advertising and promotion of medical devices can lead to fines and other sanctions, and also third-party damages claims for unfair competition in many countries in continental Europe.
Our products are subject to requirements of pricing and reimbursement in individual European countries. If we fail to agree a price or the right to receive reimbursement from the government or national insurance agencies, then we will not be permitted to sell our devices to government hospitals in the particular country. Separately we must gain traction with key opinion leaders (KOLs) in each country in order that they accept and will prescribe our products for their patients.
Most European countries and/or government hospitals and clinics have laws/rules limiting interactions between the medical device industry and healthcare providers, healthcare organizations, and patient organizations. In some countries, our interactions with these persons are also subject to prior authorization or notification requirements and/or to requirements to publish information detailing these interactions together with the value of support or payments provided. Failure to meet these requirements can lead to criminal and civil sanctions being imposed as well as potential exclusion from EU tendering opportunities.
Foreign Corrupt Practices Act
The Foreign Corrupt Practices Act, as amended (the “FCPA”), and all other applicable anti-bribery and anti-corruption laws, rules, and regulations in any jurisdictions in which we or any of our subsidiaries or affiliates conduct business, generally prohibit businesses and their directors, officers, employees, agents and other representatives from, directly or indirectly, offering to pay, promising to pay, paying, or authorizing the payment of money or anything of value to a foreign official in order to influence any act or decision of the foreign official in his or her official or commercial capacity or to secure any other improper advantage in order to obtain or retain business. The FCPA also obligates companies whose securities are listed in the United States to comply with accounting and recordkeeping provisions requiring such companies maintain books and records, which in reasonable detail, accurately and fairly reflect the transactions and dispositions of the assets of the corporation, including international subsidiaries, if any, and to devise and maintain a system of internal accounting controls sufficient to provide reasonable assurances regarding the reliability of financial reporting and the preparation of financial statements. The scope of the FCPA includes interactions with certain healthcare professionals, and other persons acting in an official capacity in many countries.
Privacy and Data Protection Laws
The Health Insurance Portability and Accountability Act of 1996 (“HIPAA”), as amended by the HITECH Act, and the regulations that have been issued under it, impose certain obligations, including mandatory contractual terms, with respect to safeguarding the privacy, security and transmission of protected health information. The requirements and restrictions apply to “covered entities” (which include health care providers and insurers) as well as to their business associates that receive protected health information from them in order to provide services to or perform certain activities on their behalf and their covered subcontractors. The statute and regulations also impose notification obligations on covered entities and their business associates in the event of a breach of the privacy or security of protected health information.
In addition, many state laws govern the privacy and security of health information in certain circumstances, many of which differ from each other in significant ways and may not have the same effect, and often are not pre-empted by HIPAA. Each of these laws may increase the complexity, variation in requirements, restrictions and potential legal risks, and could require increased compliance costs and changes in business practices and policies. For example, California has enacted the California Consumer Privacy Act (“CCPA”), which came into effect on January 1, 2020. Pursuant to the CCPA, certain businesses are required, among other things, to make certain enhanced disclosures related to California residents regarding the use or disclosure of their personal information, allow California residents to opt-out of certain uses and disclosures of their personal information without penalty, provide Californians with other choices related to personal data in our possession, and obtain opt-in consent before engaging in certain uses of personal information relating to Californians under the age of 16. The California Attorney General may seek substantial monetary penalties and injunctive relief in the event of our non-compliance with the CCPA. The CCPA also allows for private lawsuits from Californians in the event of certain data breaches. In addition, the California Privacy Rights Act of 2020 (“CPRA”), which went into effect on January 1, 2023, imposes additional obligations on companies
189
covered by the legislation and significantly modifies the CCPA, including by expanding consumers’ rights with respect to certain sensitive personal information. The CPRA also creates a new state agency that is vested with authority to implement and enforce the CCPA and CPRA. Other states have also enacted, proposed, or are considering proposing, data privacy laws, which could further complicate compliance efforts, increase our potential liability and adversely affect our business.
U.S. Healthcare Reform
In the U.S. and some non-U.S. jurisdictions, there have been, and we expect there will continue to be, a number of legislative and regulatory changes and proposed changes regarding the healthcare system that could, among other things, affect our ability to profitably sell any product candidates for which we obtain marketing approval.
Among policy makers and payors in the U.S. and elsewhere, there is significant interest in promoting changes in healthcare systems with the stated goals of containing healthcare costs, improving quality and/or expanding access. For example, the Patient Protection and Affordable Care Act of 2010, as amended by the Health Care and Education Reconciliation Act (collectively, the “PPACA”) and the Medicare Access and CHIP Reauthorization Act of 2015 substantially changed the way healthcare is delivered and financed by both governmental and private insurers. These changes included the creation of demonstration programs and other value-based purchasing initiatives that provide financial incentives for physicians and hospitals to reduce costs, including incentives for furnishing low cost therapies.
For example, the Budget Control Act of 2011 included provisions to reduce the federal deficit. Among other things. the Budget Control Act imposed, subject to certain temporary suspension periods, 2% reductions to Medicare payments to providers per fiscal year starting April 1, 2013, and, due to subsequent legislative amendments, will stay in effect through 2032, unless additional congressional action is taken. These or other similar reductions in government healthcare spending or payment updates could result in reduced demand for our products or additional pricing pressure.
Further, recently there has been heightened governmental scrutiny over the manner in which manufacturers set prices for their marketed products, which has resulted in several U.S. Congressional inquiries and proposed and enacted federal legislation designed to bring transparency to product pricing and reduce the cost of products and services under government healthcare programs. Additionally, individual states in the U.S. have also become increasingly active in passing legislation and implementing regulations designed to control product pricing, including price or patient reimbursement constraints, discounts, restrictions on certain product access and marketing cost disclosure and transparency measures. Moreover, regional healthcare authorities and individual hospitals are increasingly using bidding procedures to determine what products to purchase and which suppliers will be included in their healthcare programs.
European Union Healthcare Reform
For instance, on December 13, 2021, Regulation No 2021/2282 on Health Technology Assessment (HTA), amending Directive 2011/24/EU, was adopted. The Regulation entered into force in January 2022 and has been applicable since January 2025, with phased implementation based on the type of product i.e., certain high-risk medical devices as of 2026. The Regulation intends to boost cooperation among EU member states in assessing health technologies, including certain high-risk medical devices, and provide the basis for cooperation at the EU level for joint clinical assessments in these areas. It will permit EU member states to use common HTA tools, methodologies, and procedures across the EU, working together in four main areas, including joint clinical assessment of the innovative health technologies with the highest potential impact for patients, joint scientific consultations whereby developers can seek advice from HTA authorities, identification of emerging health technologies to identify promising technologies early, and continuing voluntary cooperation in other areas. Individual EU member states will continue to be responsible for assessing non-clinical (e.g., economic, social, ethical) aspects of health technology, and making decisions on pricing and reimbursement. There remains continuous reform of medical device regulations in the EU, with a substantial document recommending changes to the EU MDR having been published by the EU Commission on 16th December 2025. We must remain vigilant for the changes which affect the regulatory position of our devices to ensure that they may continue to be placed on the market in the EU.
190
MANAGEMENT
Executive Officers, Key Employees and Directors
The following table and discussion set forth the name, age as of June 30, 2026 and position of the individuals who currently serve as executive officers, key employees and members of the board of representatives, referred to as “directors,” of Centinel LLC and, following the consummation of the Organizational Transactions, including this offering, will begin to serve as executive officers, key employees and directors of Centinel Holdco. The following also includes certain information regarding our executive officers’, key employees’ and directors’ individual experience, qualifications, attributes and skills and brief statements of those aspects of our directors’ backgrounds that led us to conclude that they are qualified to serve as directors.
|
Name
|
| |
Age
|
| |
Position
|
|
| Executive Officers | | | | | | | |
| Steven Murray | | |
65
|
| | Chief Executive Officer | |
| Varun Gandhi | | |
42
|
| | Chief Financial Officer | |
| Key Employees | | | | | | | |
| Jeanina Bradley | | |
49
|
| | VP, U.S. Sales | |
| Fadel Ghossein | | |
47
|
| | VP, International | |
| Jason Hoffman | | |
54
|
| | VP, Business and Market Development | |
| James Kuras | | |
62
|
| | VP, Clinical, Regulatory and Quality Affairs | |
| Vincent Lesniewski | | |
54
|
| | VP, Medical Education and Clinical Accounts | |
| Peter Ringwood | | |
60
|
| | VP, Operations | |
| Steven Sanderson | | |
59
|
| | VP, Marketing and Product Development | |
| Non-Employee Directors | | | | | | | |
| Ali Abdullah Al Amri | | |
33
|
| | Director | |
| Robert Donohue | | |
78
|
| | Director | |
| Craig Greener | | |
55
|
| | Director | |
| Dirk Kuyper | | |
69
|
| | Director | |
| Deepankar Panigrahi | | |
47
|
| | Director | |
| Anthony Viscogliosi | | |
63
|
| | Director | |
| Marc Viscogliosi | | |
51
|
| | Director | |
Executive Officers
Steven Murray, Chief Executive Officer
Mr. Murray has served as the Chief Executive Officer of Centinel since March 2020. Prior to joining Centinel, Mr. Murray was Worldwide President of Advanced Sterilization Products division of Johnson & Johnson, Inc. (NYSE: JNJ) from February 2018 to April 2019; Vice President & General Manager of Johnson & Johnson cardiology and clinical diagnostics businesses from July 2014 to January 2018; and Worldwide President of Neuro of Johnson & Johnson—DePuy Synthes Neuro, a Johnson & Johnson business addressing facial, cranial, and brain trauma & pathologies, from July 2012 to June 2014. Prior to that, Mr. Murray served as President of Synthes Spine, a spine fusion and motion preservation technologies company and now part of Johnson & Johnson, from June 2010 to June 2012. Mr. Murray also served as President of Synthes Craniomaxillofacial, a trauma and reconstruction company and now part of Johnson & Johnson, from April 2000 to May 2010. Mr. Murray has served as a director of the non-profit organization, World Craniofacial Foundation since 2016. Mr. Murray received an M.B.A. from the Amos Tuck School of Business Administration at Dartmouth College, and a B.A. in Economics from Miami University, Oxford, Ohio.
191
Varun Gandhi, Chief Financial Officer
Mr. Gandhi has served as the Chief Financial Officer of Centinel since August 2020. Mr. Gandhi was Senior Vice President of Corporate Finance and Strategic Planning from October 2014 until June 2019 and General Manager, International at Centinel from June 2019 until December 2020. From September 2005 to December 2005, Mr. Gandhi worked as an analyst at Viscogliosi Brothers, LLC a single-family office focused on the neuro-musculoskeletal industry (“VB”). From January 2006 to August 2014, Mr. Gandhi served as Vice President of Corporate Finance and Strategic Planning at Small Bone Innovations, Inc., an extremities focused medical device company acquired by Stryker Corporation, and Centinel. While at VB, from October 2014 to September 2019, Mr. Gandhi was a member of Centinel’s senior leadership, and from January 2006 to September 2014, Mr. Gandhi spent the majority of his time at VB providing services to Small Bone Innovations, Inc., where he held various positions, most recently as Vice President of Strategic Planning and Corporate Finance. Mr. Gandhi received a B.S. in Biomedical Engineering and Economics from Rutgers, The State University of New Jersey.
Key Employees
Jeanina Bradley, Vice President, U.S. Sales
Ms. Bradley has served as Centinel’s Vice President, U.S. Sales since May 2026. Ms. Bradley joined Centinel in July 2019 as a Regional Sales Manager and was subsequently promoted to Area Vice President, Mountain/Central in December 2021. Prior to joining Centinel, Ms. Bradley served as Vice President of Spine and Distributor Partner for Align Alternatives, a multistate spine and orthopedic distributor in the southern United States, from August 2014 to December 2018. From 2004 to 2014, Ms. Bradley served in different medical device and market development positions, including as Director of Development for Methodist Health System Moody Brain and Spine Institute in North Texas from August 2013 through August 2014, as a Spine Specialist for NuVasive, Inc. from March 2012 through July 2013, and as a Sales Associate and Territory Manager for Boston Scientific Corporation from October 2004 through March 2012. She has worked in sales, sales training, and marketing, as well as sales leadership roles of increasing responsibility and scope. Ms. Bradley received a B.A. in Performing Arts from The University of Texas at Dallas.
Fadel Ghossein, Vice President, International
Mr. Ghossein has served as Vice President International of Centinel since January 2021. Mr. Ghossein is responsible for all aspects of Centinel’s international business. Prior to joining Centinel, Mr. Ghossein served as the Director of Western & North Europe division of Spineart SA, a privately held medical device company, from February 2017 to January 2021. Prior to that, he held escalating roles at Johnson & Johnson—DePuy Synthes, including Business Unit Manager of Spine from September 2015 to February 2017; Regional Sales Manager from November 2012 to September 2015; Merger Integration Manager from June 2012 to January 2013; Product Manager for Synthes Spine from November 2010 to November 2012; and Sales Representative from April 2007 to November 2012. Prior to that, he served as Sales Executive for Kodak Medical Imaging Systems (now part of Carestream Health, Inc.) from April 2003 to April 2007. Mr. Ghossein received an M.B.A. from Luiss Business School, and degrees from the Université Côte d’Azur, Université Henri Poincaré (Nancy I), and Université Victor Segalen (Bordeaux II).
Jason Hoffman, Vice President, Business and Market Development
Mr. Hoffman has served as Vice President, Business and Market Development of Centinel since January 2023. Mr. Hoffman joined Centinel as Vice President of Sales in August 2017. Prior to joining Centinel, Mr. Hoffman served as Vice President, Global Sales for Providence Medical Technology, Inc., an emerging spine company, from July 2015 to June 2017. From March 2010 to September 2014, Mr. Hoffman served as Vice President of US Sales, Therapeutic Support Systems for ArjoHuntleigh, a global medical technology company, working two years in this position with Kinetic Concepts Inc. (prior to its acquisition by ArjoHuntleigh) and then two years with ArjoHuntleigh (after its acquisition of Kinetic Concepts Inc.), to integrate a diverse wound care and patient handling commercial sales team. From 1997 to March 2010, Mr. Hoffman served in different positions, including as Senior Regional Business Director, with Johnson & Johnson, Inc. in various biotechnology divisions. Specifically, he worked in both Ortho Biotech and Centocor
192
divisions, in sales, sales training, marketing, as well as sales leadership roles of increasing responsibility from Manager through Senior Director positions. Mr. Hoffman received a B.A. in Political Science from North Carolina State University.
James Kuras, Vice President, Clinical, Regulatory and Quality Affairs
Mr. Kuras has served as Centinel’s Vice President, Clinical, Regulatory and Quality Affairs since February 2021. From August 2017 to January 2020, Mr. Kuras served as Vice President, Clinical Operations at Centinel. Prior to rejoining Centinel in February 2021, Mr. Kuras was the Vice President of R&D and Clinical Affairs at ACell, Inc., a company focused on wound repair and anterior wall reconstruction using a novel extracellular matrix structure derived from porcine bladders, from January 2020 to January 2021. From May 2015 to July 2017, Mr. Kuras served as Vice President of Product Development at both Innovative Medical Equipment LLC and Mercury BioMed LLC, which are start-up companies developing heat and cool therapies for the home healthcare and perioperative clinical markets. From March 2001 to November 2014, Mr. Kuras was the Chief Operating Officer and founder of AxioMed Spine Corp, a company focused on the development and study of next generation cervical and lumber total disc replacement technologies. Mr. Kuras holds a B.S. in Applied Science in Electrical Engineering Technology from Youngstown State University.
Vincent Lesniewski, Vice President, Medical Education and Clinical Accounts
Mr. Lesniewski has served as Centinel’s Vice President, Medical Education and Clinical Accounts since September 2026. Mr. Lesniewski previously served as Centinel’s Vice President, Strategic Accounts from February 2022 to August 2026. Mr. Lesniewski joined Centinel as Director, Market Development in April 2018. Prior to that, he held escalating roles at Johnson & Johnson—DePuy Synthes, including Area Business Manager, Capital and Enabling Technologies from October 2014 to March 2018 and National Director, prodisc Sales from August 2012 to September 2014. From 2004 to 2012, Mr. Lesniewski served in different positions with Synthes Spine, Inc., focused on the prodisc portfolio as Manager, Clinical Sales from 2010 to 2012, Clinical Specialist from 2007 to 2010, Product Manager for prodisc from 2004 to 2007 and for Biomaterials and CMF from 2001 to 2004. From 2000 to 2001, Mr. Lesniewski served as Product Manager, Shoulder Resorbable Product Line for Bionx. From 1998 to 2000, Mr. Lesniewski served as Product Manager, Spinal Fusion Stimulators for EBI Spine. Mr. Lesniewski received a B.A. in Chemistry from Rutgers University.
Peter Ringwood, Vice President, Operations
Mr. Ringwood has served as Centinel’s Vice President, Operations since January 2022. Prior to joining Centinel, Mr. Ringwood served as Vice President of Operations for Conventus Flower Orthopedics, a medical device manufacturer specializing in prepackaged surgical solutions for orthopedic procedures, from December 2020 to December 2021. From April 2002 to December 2020, Mr. Ringwood served as Director of Operations and later as General Manager for B&G Manufacturing, a contract manufacturer of precision machined parts for critical industries including medical, aerospace, energy and defense. Mr. Ringwood holds an M.B.A. from Loyola University Maryland and a B.S. in Engineering & Business from Clarkson University.
Steven Sanderson, Vice President, Marketing and Product Development
Mr. Sanderson has served as Centinel’s Vice President of Marketing and Product Development since March 2019. Mr. Sanderson, who joined Centinel in January 2018 as Vice President of Marketing, is responsible for leading all global strategic and operational marketing and product development activities. Prior to joining Centinel, Mr. Sanderson served in different positions with Integra Lifesciences, a global medical technology company, from June 2007 to April 2017, most recently as Senior Director of Marketing in the Orthopedics & Orthobiologics division. Prior to that, he held various leadership positions with Olympus Corporation of the Americas from September 1999 through June 2007. Mr. Sanderson received an M.B.A. from Temple University, a M.S. from The Ohio State University, and a B.S. from the University of Notre Dame.
193
Non-Employee Directors
Ali Abdullah Al Amri, Director
Mr. Al Amri has served as a director of Centinel since July 2023 in his capacity as a representative of Delac Spine Inc. on Centinel’s board. Mr. Al Amri has served as Manager, Private Markets for the Oman Investment Authority, a sovereign wealth fund of the Sultanate of Oman and sole stockholder of Delac Spine Inc., since July 2014. During this time, he has handled a portfolio of assets and investments across the healthcare, technology, and energy transition sectors in North America, Europe, and Asia. In addition, since March 2022, Mr. Al Amri has served as a director of Oman Chlorine S.A.O.G. and National Pharmaceutical Industries Co. (SAOC), both public companies listed on the Muscat Stock Exchange, and BioGenomics Limited, a private company. Mr. Al Amri received a B.Sc. in Accounting and Finance from the University of Bradford. We believe Mr. Al Amri is qualified to serve on our board because of his investment and finance experience and his knowledge of our business.
Robert Donohue, Director
Mr. Donohue has served as a director of Centinel since December 2017 in his capacity as a representative of AW Alpha Capital LLC on Centinel’s board. Mr. Donohue has served as a manager of AW Alpha Capital LLC, an affiliate of WJFS, Inc., a private investment group, since November of 2017. Since January 2014, Mr. Donohue has served as Chief Executive Officer and Chief Financial Officer of WJFS, Inc. From 1998 through June of 2012, Mr. Donohue held the position of Chief Financial Officer of Synthes, Inc., a formerly public medical device manufacturer listed on the SIX Swiss Exchange. In addition, from 1997 to June of 2012, Mr. Donohue held the position of President, Synthes Canada, Ltd., a subsidiary of Synthes, Inc. Mr. Donohue started with Synthes (USA) in 1990 as the Corporate Controller and shortly thereafter was promoted to VP of Finance. Prior to joining Synthes, he served in several financial positions, including corporate controller and plant controller with several major U.S. corporations. In addition to his board seat at Centinel, Mr. Donohue also has served on the board of two privately held companies in, or serving, the life sciences industry, Lungpacer Medical, Inc. since June 2021 and AES Clean Technology, Inc. since March 2019, and a non-profit private foundation, the LOR Foundation since January 2015. Mr. Donohue received an M.B.A. from Widener University and a B.Sc. in Economics from West Chester University, and he is a former Certified Public Accountant. We believe Mr. Donohue is qualified to serve on our board because of his extensive experience in the medical device industry, his finance experience, and his knowledge of our business.
Craig Greener, Director
Mr. Greener has served as a director of Centinel since April 2023 in his capacity as a representative of AW Alpha Capital LLC. Mr. Greener has served as Director of Acquisitions for WJFS, Inc. since April 2015. Prior to joining WJFS, Inc., Mr. Greener worked for Johnson & Johnson—DePuy Synthes from May 2008 to April 2015 focusing on mergers and acquisitions. Mr. Greener received a B.B.A. in Finance from James Madison University and has been a CFA Charterholder since September 2000. We believe Mr. Greener is qualified to serve on our board because of his investment and finance experience and his knowledge of our business.
Dirk Kuyper, Director
Mr. Kuyper has served as a director of Centinel since December 2018. Mr. Kuyper has been the owner, President and CEO of Precision Machinists Company, Inc, an OEM parts manufacturer for medical, semiconductor and aerospace industries, since December 2014. In addition, from January 2020 until April 2024, Mr. Kuyper served as Managing Director of Joline Medical LLC, a medical device company focused on pain management. From April 2013 until September 2014, Mr. Kuyper served as President and CEO of Illuminoss Medical, Inc., a privately-held medical device company specializing in minimally invasive, patient customized orthopedic implants for the treatment of bone fractures. Prior to joining Illuminoss in April 2013, from August 2012 until April 2013 Mr. Kuyper served as a Partner at Strategic Medical Consulting Group, LLC, providing strategic consulting and advice for a number of medical device companies including Benvenue Medical, Inc., a developer of MIS lumbar fusion systems. From June 2007 to August 2012, Mr. Kuyper served as the President and CEO, and as a member of the board of directors, of Alphatec
194
Holdings, Inc. (Nasdaq: ATEC), a medical technology company focused on the design, development, and advancement of technology for better surgical treatment of spinal disorders. Prior to his work for Alphatec, from June 1990 to June 2007 Mr. Kuyper served in several executive capacities, including as President and as Executive Vice President and Chief Operating Officer, for Aesculap, Inc., a member of the B Braun group of companies and a provider of surgical tools. From July 2013 until August 2019, Mr. Kuyper served as an independent director of Conmed Corporation, (NYSE: CNMD), during which time he served as chairman of the compensation committee from July 2013 until August 2019 and as a member of nominating and governance committee from February 2016 until August 2019. Mr. Kuyper served in the US Army where he achieved the rank of Captain. Mr. Kuyper received a B.S. in Biology from the University of Miami. We believe Mr. Kuyper is qualified to serve on our board because of his extensive experience in the medical device industry, his experience as a public company director, and his knowledge of our business.
Deepankar Panigrahi, Director
Mr. Panigrahi has served as a director of Centinel since February 2018 in his capacity as a representative of Delac Spine Inc. on Centinel’s board. Mr. Panigrahi has worked for the Oman Investment Authority, a sovereign wealth fund of the Sultanate of Oman and sole stockholder of Delac Spine Inc., since February 2015 and is currently the Director—Private Markets. During this time, he has been extensively involved in private equity investments across a range of sectors primarily healthcare, technology and infrastructure with a global focus. In addition, since April 2021 he has served as a director of the Oman India Joint Investment Fund. Mr. Panigrahi received an M.B.A. from the University of Cambridge, and an M.S. in Information Economics, Management and Policy, and a B.A. in Economics from the University of Michigan, Ann Arbor. In addition, he holds the CFA designation. We believe Mr. Panigrahi is qualified to serve on our board because of his investment and finance experience and his knowledge of our business.
Anthony Viscogliosi, Director
Dr. h.c. Anthony Viscogliosi has served as a director of Centinel since its formation in his capacity as a representative of Viscogliosi Brothers, LLC on Centinel’s board. Since August 1999, Dr. h.c. Anthony Viscogliosi has served as one of the Principals of VB. Dr. h.c. Anthony Viscogliosi has served as a Co-Chief Executive Officer of VB Spine, an affiliate of VB, since its formation in April 2025. Dr. h.c. Anthony Viscogliosi has also served at Companion Spine, LLC, a provider of posterior spine non-fusion solutions, as a member of its board since September 2020 and as its Executive Chairman and Chief Executive Officer since April 2025; as a director of Nuvaira Inc., a company developing therapies for lung disease, since March 2026. Dr. h.c. Anthony Viscogliosi also serves as President of The Hartford Club. Dr. h.c. Anthony Viscogliosi served as a member of the board of managers of MCRA, LLC, an advisory firm and clinical research organization (CRO) to medical technology developers, from April 2004 until its sale to IQVIA in July 2024. Dr. h.c. Anthony Viscogliosi also served as Chief Executive Officer of MCRA from August 2018 until July 2024. Mr. Anthony Viscogliosi served as Executive Chairman from December 2007 to June 2020, and currently serves as a member of the board, of Woven Orthopedic Technologies, LLC, an orthogeriatric specialty company that focuses on enhancing orthopedic implant fixation in compromised bone. Dr. h.c. Anthony Viscogliosi graduated in the certificate program for Global Healthcare Leaders from Harvard Medical School, received a Dr. honoris causa from New York College of Podiatric Medicine, received an AB honoris causa from Manchester Community College, graduated from the United States Navy Supply Corps School, attended the Naval War College, attended the Armed Forces Staff College and National Defense University, received a B.A. in Economics from the University of Michigan, Dearborn, and served as an officer in the United States Navy Reserve, separating after 20 years of services as a Lieutenant Commander, with his last unit affiliation being the Office of Naval Intelligence 1201. We believe Dr. h.c. Anthony Viscogliosi is qualified to serve on our board because of his extensive experience in leadership, in management, and in the medical device industry, his role in the venture capital industry, and his knowledge of our business.
Marc Viscogliosi, Director
Mr. Marc Viscogliosi has served as a director of Centinel since March 2020 in his capacity as a representative of Viscogliosi Brothers, LLC on Centinel’s board. Since April 1999, Mr. Marc Viscogliosi has served as a Principal of VB. Mr. Marc Viscogliosi has served as a Co-Chief Executive Officer of VB Spine since its formation in April 2025. Mr. Marc Viscogliosi has served as Chairman and Chief Executive Officer of Spine
195
Biopharma, LLC, a company specializing in non-surgical therapies that slow or stop pathological spinal disease progression without the use of opioids, since October 2016. In addition, Mr. Marc Viscogliosi previously served as Chairman and Chief Executive Officer of Paradigm Spine, LLC, an orthopedic provider of non-fusion and fusion spinal implant solutions from August 2004 to March 2019, and as Chief Executive Officer of MCRA from April 2004 to August 2018. Mr. Marc Viscogliosi received a B.A. in Economics and Political Science from New York University. We believe Mr. Marc Viscogliosi is qualified to serve on our board because of his extensive experience with medical device companies, his investment experience, and his knowledge of our business.
Family Relationships
Two members of our board of directors have a family relationship. Anthony Viscogliosi and Marc Viscogliosi are brothers.
Composition of our Board of Directors
Director Independence
Our business and affairs are managed under the direction of our board of directors. Upon consummation of this offering, our board of directors will consist of seven individuals.
Upon the completion of this offering, we expect that our Class A Common Stock will be listed on the NYSE. Applicable NYSE rules require a majority of a listed company’s board of directors to be comprised of independent directors within one year from the date our Class A Common Stock first trades on the NYSE (the “Listing Date”). Audit committee members must also satisfy the independence criteria set forth in Rule 10A-3 promulgated under the Exchange Act.
Our board of directors has determined that each member of the board is an “independent director,” as such term is defined in NYSE Rule 303A.02. In making such determination, our board of directors considered the relationships that each director has with us, and all other facts and circumstances that our board of directors deemed relevant in determining their independence, including the beneficial ownership of our capital stock by each director and transactions involving each director and their affiliates described in “Certain Relationships and Related Party Transactions.” Our board of directors also considered the association of our directors with the holders of more than 10% of our common stock.
We intend to rely on the phase-in provisions of NYSE Rule 303A.00, which permit companies listing in connection with their initial public offering to phase in compliance with certain NYSE requirements relating to the composition of the audit committee, compensation committee and nominating and corporate governance committee. With respect to the audit committee, (1) one member must satisfy applicable NYSE requirements by the Listing Date, (2) a majority of members must satisfy applicable NYSE requirements within 90 days of the effective date of this registration statement and (3) all members must satisfy applicable NYSE requirements within one year of the effective date of this registration statement. In connection with the requirement to have at least three members serving on the audit committee, we must have at least one member serving on our audit committee by the Listing Date, at least two members within 90 days of the Listing Date and at least three members within one year of the Listing Date. With respect to the compensation committee and the nominating and corporate governance committee, (1) one member must satisfy applicable NYSE requirements by the earlier of the date our initial public offering closes or five business days from the Listing Date, (2) a majority of members must satisfy applicable NYSE requirements within 90 days of the Listing Date and (3) all members must satisfy applicable NYSE requirements within one year of the Listing Date.
Anthony Viscogliosi, who is not an independent director for audit committee purposes, will serve on such committee until one year anniversary of the effective date of this registration statement. We will have one year from the effective date of this registration statement to comply with the applicable audit committee independence requirements.
Upon the completion of this offering, we expect that the composition and functioning of our board of directors and each of our committees will comply with all applicable SEC requirements and NYSE rules, subject to the transition rules described above for newly listed companies.
196
Classified Board of Directors
Our amended and restated certificate of incorporation and amended and restated bylaws, which will be effective upon the consummation of this offering, provide that our board of directors will be divided into three classes of directors, with the classes to be as nearly equal in number as possible, with the directors serving three-year terms, and one class being elected each year by our stockholders. For further information, see the section titled “Description of Capital Stock—Anti-Takeover Effects of Delaware Law, Our Certificate of Incorporation and Our Bylaws.”
Our board of directors will be divided among the three classes as follows:
•
Our class I directors will be Anthony Viscogliosi, Robert Donohue and Dirk Kuyper and their term will expire at the first annual meeting of stockholders following this offering.
•
Our class II directors will be Craig Greener and Ali Abdullah Al Amri and their term will expire at the second annual meeting of stockholders following this offering
•
Our class III directors will be Deepankar Panigrahi and Marc Viscogliosi and their term will expire at the third annual meeting of stockholders following this offering.
Leadership Structure of the Board
We do not currently have a chairman of the board; however, once we are a public company, we may establish a role of chairman of the board that is separate from the role of Chief Executive Officer. We believe that separating these positions would allow our Chief Executive Officer to focus on our day-to-day business, while allowing the chairman of the board to lead the board of directors in its fundamental role of providing advice to and independent oversight of management. Our board of directors recognizes the time, effort and energy that the Chief Executive Officer is required to devote to his position in the current business environment, as well as the commitment required to serve as our chairman, particularly as the board of directors’ oversight responsibilities continue to grow. While our amended and restated bylaws and corporate governance guidelines will not require that our chairman and Chief Executive Officer positions be separate, our board of directors believes that having separate positions may provide the appropriate leadership structure for us and would demonstrate our commitment to good corporate governance.
Role of Board in Risk Oversight Process
Risk is inherent with every business, and how well a business manages risk can ultimately determine its success. We face a number of risks, including risks relating to our financial condition, development and commercialization activities, operations, strategic direction and intellectual property as more fully discussed in the section titled “Risk Factors” appearing elsewhere in this prospectus. Management is responsible for the day-to-day management of risks we face, while our board of directors, as a whole and through its committees, has responsibility for the oversight of risk management. In its risk oversight role, our board of directors has the responsibility to satisfy itself that the risk management processes designed and implemented by management are adequate and functioning as designed.
The role of the board of directors in overseeing the management of our risks is conducted primarily through committees of the board of directors, as disclosed in the descriptions of each of the committees below and in the charters of each of the committees. Following the completion of this offering, the audit committee of the board of directors will be responsible for overseeing company-wide and information security risk assessment processes, our major financial risk exposures, regulatory compliance, and the steps our management has taken to monitor and control these risks and exposures. The audit committee will also be reviewing any related-party transactions. The compensation committee of the board of directors will be responsible for overseeing risks relating to employee compensation plans and arrangements and monitoring whether any of our compensation policies and programs have the potential to encourage excessive risk-taking. The nominating and corporate governance committee will be monitoring the effectiveness of our corporate governance policies and overseeing management succession planning. While each committee will be responsible for evaluating certain risks and overseeing the management of such risks, the entire board of directors will be regularly informed through committee reports about such risks. This will enable the board of directors and its committees to coordinate the risk oversight role, particularly with respect to risk interrelationships.
197
Committees of Our Board of Directors
Our board of directors will establish, effective upon the consummation of this offering, audit, compensation, and nominating and corporate governance committees. The composition, duties and responsibilities of these committees are set forth below. Our board of directors may from time to time establish certain other committees to facilitate the management of our company.
Audit Committee
Our board of directors will establish, effective upon the consummation of this offering, an audit committee which is responsible for, among other matters
•
appointing, compensating, retaining, evaluating, terminating and overseeing our independent registered public accounting firm;
•
discussing with our independent registered public accounting firm its independence from management;
•
reviewing with our independent registered public accounting firm the matters required to be reviewed by applicable auditing requirements;
•
approving all audit and permissible non-audit services to be performed by our independent registered public accounting firm;
•
overseeing the accounting and financial reporting process and discussing with management and our independent registered public accounting firm the interim and annual financial statements that we file with the SEC;
•
reviewing all related person transactions for potential conflict of interest situations and approving all such transactions;
•
reviewing risk assessment and management policies, including those related to financial, cybersecurity, and information technology risks; and
•
establishing procedures for the confidential anonymous submission of concerns regarding questionable accounting or audit matters.
Upon the closing of this offering, our audit committee will consist of Anthony Viscogliosi, Robert Donohue, Deepankar Panigrahi and Dirk Kuyper, with Dirk Kuyper serving as chair. Pursuant to Rule 10A-3 promulgated under the Exchange Act and the NYSE rules, we must have (1) at least one independent director on the audit committee by the Listing Date; (2) a majority of independent directors on the audit committee within 90 days from the effective date of this registration statement; and (3) all independent directors on the audit committee within one year of the effective date of this registration statement. In connection with the requirement to have at least three members serving on the audit committee, we must have at least one member serving on our audit committee by the Listing Date, at least two members within 90 days of the Listing Date and at least three members within one year of the Listing Date. Our board of directors has determined that Robert Donohue, Deepankar Panigrahi and Dirk Kuyper are “independent” for audit committee purposes under Rule 10A-3 and the applicable NYSE rules. Accordingly, we expect to have three directors on the audit committee on the Listing Date who will qualify as independent for audit committee purposes. Anthony Viscogliosi, who is not an independent director for audit committee purposes, will serve on the audit committee until one year anniversary of the effective date of this registration statement. We will have one year from the effective date of this registration statement to comply with the audit committee independence requirements. Each member of our audit committee meets the financial literacy requirements of the NYSE listing standards. Our board of directors has determined that each of Robert Donohue, Deepankar Panigrahi and Dirk Kuyper will qualify as an “audit committee financial expert,” as defined under the applicable rules of the SEC.
Our board of directors will adopt, effective upon the consummation of this offering, a written charter for the audit committee, which will be available on our website, www.centinelspine.com, upon the completion of this offering. The information contained on, or accessible through, our website is not incorporated by reference into, and should not be considered a part of, this prospectus.
198
Compensation Committee
Our board of directors will establish, effective upon the consummation of this offering, a compensation committee which is responsible for, among other matters:
•
reviewing officer and executive compensation goals, policies, plans and programs;
•
reviewing and approving or recommending to our board of directors the compensation of our directors, Chief Executive Officer and other executive officers;
•
reviewing and approving employment agreements and other similar arrangements between us and our executive officers and other key executives; and
•
appointing and overseeing any compensation consultants.
Upon the closing of this offering, our compensation committee will consist of Anthony Viscogliosi, Robert Donohue and Deepankar Panigrahi, with Robert Donohue serving as chair. Our board of directors has determined that each of Anthony Viscogliosi, Robert Donohue and Deepankar Panigrahi is “independent” under the applicable NYSE rules and a “non-employee director” as defined in Rule 16b-3 promulgated under the Exchange Act. Our board of directors will adopt, effective upon the consummation of this offering, a written charter for the committee, which will be available on our website, www.centinelspine.com, upon the completion of this offering.
Nominating and Corporate Governance Committee
Our board of directors will establish, effective upon the consummation of this offering, a nominating and corporate governance committee that is responsible for, among other matters:
•
identifying individuals qualified to become members of our board of directors, consistent with criteria approved by our board of directors;
•
overseeing the organization of our board of directors to discharge the board’s duties and responsibilities properly and efficiently; and
•
developing and recommending to our board of directors a set of corporate governance guidelines and principles.
Upon the closing of this offering, our nominating and corporate governance committee will consist of Anthony Viscogliosi, Robert Donohue and Deepankar Panigrahi, with Anthony Viscogliosi serving as chair. Our board of directors has determined that each member of the nominating and corporate governance committee is “independent” under the applicable NYSE rules. Our board of directors will adopt, effective upon the consummation of this offering, a written charter for the nominating and corporate governance committee, which will be available on our website, www.centinelspine.com, upon the completion of this offering.
Compensation Committee Interlocks and Insider Participation
None of the members of our compensation committee has at any time during the prior three years been one of our officers or employees. None of our executive officers currently serves, or in the past fiscal year has served, as a member of the board of directors or compensation committee of any entity that has one or more executive officers serving on our board of directors or compensation committee.
Code of Business Conduct and Ethics
We plan to adopt a code of business conduct and ethics that applies to all of our employees, officers and directors, including those officers responsible for financial reporting, which will be effective upon completion of this offering. Upon the completion of this offering, our code of business conduct and ethics will be available on our website at www.centinelspine.com. We intend to disclose any substantive amendments to the code, or any waivers of its requirements, on our website.
Corporate Governance Guidelines
Prior to the completion of this offering, our board of directors will adopt corporate governance guidelines in accordance with the corporate governance rules of the NYSE.
199
Limitation on Liability and Indemnification Matters
Our amended and restated certificate of incorporation, which will become effective immediately prior to the completion of this offering will contain provisions that limit the liability of our directors and officers for monetary damages to the fullest extent permitted by the Delaware General Corporation Law, as amended (the “DGCL”). The DGCL provides that directors or officers of a corporation will not be personally liable to us or our stockholders for monetary damages for any breach of fiduciary duties as directors or officers, except liability for any:
•
transaction from which the director or officer derives an improper personal benefit;
•
act or omission not in good faith or that involves intentional misconduct or a knowing violation of law;
•
unlawful payment of dividends or redemption of shares by a director;
•
an officer in any action by or in the right of the corporation; or
•
breach of a director’s or officer’s duty of loyalty to the corporation or its stockholders.
These limitations of liability do not apply to liabilities arising under federal securities laws and do not affect the availability of equitable remedies such as injunctive relief or recession.
Our amended and restated certificate of incorporation will requires us to indemnify our directors and officers to the fullest extent permitted by DGCL. Our amended and restated certification of incorporation will also provide that we are obligated to advance expenses (including attorney’s fees) incurred by any indemnified person in advance of the final disposition of any action or proceeding provided that the indemnified person undertakes to repay such advances if it is ultimately determined that such person is not entitled to indemnification.
We have entered, and expect to continue to enter, into separate agreements to indemnify our directors, executive officers and other employees as determined by our board of directors. With specified exceptions, these agreements provide for indemnification for related expenses including, among other things, attorneys’ fees, judgments, fines and settlement amounts incurred by any of these individuals in any action or proceeding. We also maintain directors’ and officers’ liability insurance pursuant to which our directors and officers are insured against liability for actions taken in their capacities as directors and officers.
We believe that these provisions in our amended and restated certificate of incorporation and the indemnification agreements are necessary to attract and retain qualified persons as directors and officers. However, the limitation of liability and indemnification provisions in our amended and restated certificate of incorporation may discourage stockholders from bringing a lawsuit against our directors and officers for breach of their fiduciary duty. They may also reduce the likelihood of derivative litigation against our directors and officers, even though an action, if successful, might benefit us and our stockholders. Further, a stockholder’s investment may be adversely affected to the extent that we pay the costs of settlement and damages. Insofar as indemnification for liabilities arising under the Securities Act may be permitted to directors, officers or control persons, in the opinion of the SEC, such indemnification is against public policy, as expressed in the Securities Act and is therefore unenforceable.
There is no pending litigation or proceeding naming any of our directors or officers as to which indemnification is being sought, nor are we aware of any pending or threatened litigation that may result in claims for indemnification by any director or officer.
200
EXECUTIVE AND DIRECTOR COMPENSATION
Executive Compensation
This section discusses the material components of the executive compensation program for our executive officers who are named in the “Summary Compensation Table for Fiscal 2025” below. In 2025, our named executive officers and their positions were as follows:
•
Steven Murray, Chief Executive Officer; and
•
Varun Gandhi, Chief Financial Officer.
Summary Compensation Table for Fiscal 2025
The following table sets forth summary information relating to all compensation awarded to, earned by or paid to our named executive officers for all services rendered in all capacities to Centinel and its subsidiaries during fiscal 2025:
|
Name and Principal Position
|
| |
Year
|
| |
Salary
($) |
| |
Bonus
($)(1) |
| |
Non-Equity Incentive
Plan Compensation ($)(2) |
| |
All Other
Compensation ($)(3) |
| |
Total
($) |
| ||||||||||||||||||
|
Steven Murray
Chief Executive Officer |
| | | | 2025 | | | | | $ | 500,000 | | | | | $ | 200,000 | | | | | $ | 300,000 | | | | | $ | 8,832 | | | | | $ | 1,008,832 | | |
|
Varun Gandhi
Chief Financial Officer |
| | | | 2025 | | | | | $ | 450,000 | | | | | $ | 150,000 | | | | | $ | 180,000 | | | | | $ | 1,084 | | | | | $ | 781,084 | | |
(1)
Amounts represent a retention bonus earned by each named executive officer in 2025, which were paid to our named executive officers in 2026.
(2)
Amounts represent an annual performance-based cash bonus earned by each named executive officer in 2025, which were paid to our named executive officers after certification of each of the performance metrics in the second quarter of 2026.
(3)
Amounts represent life insurance premiums paid by the Company.
Narrative Disclosure to Summary Compensation Table
Base Salaries
Our named executive officers each receive a base salary to compensate them for services rendered to our company. The base salary payable to each named executive officer is intended to provide a fixed component of compensation reflecting the executive’s skill set, experience, role and responsibilities.
During the fiscal year ended December 31, 2025, Messrs. Murray and Gandhi had annual base salaries of $500,000 and $450,000, respectively.
Retention Bonus
In May 2025, the Company entered into a retention bonus agreement with Mr. Murray (the “Murray Retention Agreement”) to incentivize his continued service. The initial term ran from May 2025 through December 31, 2025. If Mr. Murray remained continuously employed through the end of the term, he would receive a lump sum cash payment of $200,000. After December 31, 2025, the Murray Retention Agreement automatically renewed for an additional one-year period ending December 31, 2026. Accordingly, if Mr. Murray remains continuously employed through the end of December 31, 2026, he will receive a lump sum cash payment of $200,000. If a change in control (as defined in the Murray Retention Agreement) occurs during the term and Mr. Murray remains continuously employed through the date of such change in control, he will be entitled to a pro-rated retention bonus. In addition, if Mr. Murray’s employment is terminated by the Company without cause (as defined in the Murray Retention Agreement) within 90 days prior to the end of the applicable term, he will receive the retention bonus that would have been paid for that calendar year had he remained employed through December 31, payable at the time the bonus would have been paid absent such termination.
201
In May 2025, the Company entered into a substantially similar retention bonus agreement with Mr. Gandhi, except that Mr. Gandhi’s retention bonus amount is $150,000. Mr. Gandhi’s retention bonus agreement also automatically renewed for an additional one-year period ending December 31, 2026. Accordingly, if Mr. Gandhi remains continuously employed through the end of December 31, 2026, he will receive a lump sum cash payment of $150,000.
Non-Equity Incentive Plan in Effect in Fiscal 2025
The Company believes that performance-based cash incentive bonuses play an important role in providing incentives to executives to achieve annual corporate goals. In May 2025, our Compensation Committee adopted a formulaic annual cash incentive plan for its executives (the “2025 Cash Plan”) based on five corporate goals. Centinel’s corporate goals for 2025 included financial metrics (worldwide global revenues, adjusted EBITDA and cash balance), as well as key strategic initiatives (debt refinancing and FDA PMA approval).
Each corporate goal was assigned a weighting: 10% for worldwide global revenue, 30% for adjusted EBITDA, 30% for cash balance, 15% for debt refinancing and 15% for FDA PMA approval. The Company performance metrics operate independently. The performance goals were selected to reward executives for the achievement of targeted financial results and key strategic initiatives. Our Compensation Committee set threshold and target financial performance metric goals based on the Company’s annual operating budget. There were no maximum performance goals established. There would be no annual cash bonus payout with respect to any financial metric for which actual performance did not meet the threshold level. Payout at threshold would be at 85% of target for each of the worldwide global revenue and adjusted EBITDA financial metrics and 80% of target for the cash balance metric. Achievement between threshold and target of the specified Company financial metrics would result in a payout based on linear interpolation. The total achievable bonus payout was capped at target and there was no opportunity to earn more than 100% of target under the 2025 Cash Plan.
The strategic initiatives consisted of (i) the Company refinancing outstanding debt with new financing of up to $60 million; and (ii) the prodisc C Vivo and prodisc C SK receiving FDA PMA approval for two-level indications. There would be no annual cash bonus payout under the 2025 Cash Plan with respect to any Company strategic initiatives metric for which actual performance was not achieved. The strategic initiatives were designed to be “stretch” goals that were achievable with what we believe represented an elevated level of effort and performance. Both strategic goals were achieved during 2025. In February 2025, the Company refinanced its outstanding loan agreement and entered into a senior secured loan agreement with SLR Investment Corp. and a senior secured credit agreement with Gemino Healthcare Finance, LLC d/b/a SLR Healthcare ABL, which provided the Company with $60 million of capital and the ability to draw down up to $10 million in additional capital. In addition, in October 2025, prodisc C Vivo and prodisc C SK received FDA PMA approval for two-level indications.
The following table sets forth the corporate goals comprising the 2025 Cash Plan, the applicable weighting for each corporate goal and the actual results:
|
Measure
($ in millions) |
| |
Threshold
|
| |
Target
|
| |
Actual
|
| |
Achieved
|
| |
Not
Achieved |
| |
% Bonus
Allocation For Company Metric |
| |
% Bonus
Allocation Earned |
| |||||||||||||||||||||
|
Worldwide Global Revenue
|
| | | $ | 98.86 | | | | | $ | 116.3 | | | | | $ | 132.2 | | | | | | X | | | | | | — | | | | | | 10% | | | | | | 10% | | |
|
Adjusted EBITDA(1)
|
| | | $ | 11.65 | | | | | $ | 13.7 | | | | | $ | 20.2 | | | | | | X | | | | | | — | | | | | | 30% | | | | | | 30% | | |
|
Cash Balance
|
| | | $ | 12.64 | | | | | $ | 15.8 | | | | | $ | 21.3 | | | | | | X | | | | | | — | | | | | | 30% | | | | | | 30% | | |
|
Debt Refinancing
|
| | | | — | | | | | | — | | | | | | — | | | | | | X | | | | | | — | | | | | | 15% | | | | | | 15% | | |
|
FDA PMA Approval
|
| | | | — | | | | | | — | | | | | | — | | | | | | X | | | | | | — | | | | | | 15% | | | | | | 15% | | |
|
Actual Payout Percentage
|
| | | | | | | | | | | | | | | | | | | | | | | | | | | | | | | | | | | | | | | | 100% | | |
(1)
Adjusted EBITDA is a non-GAAP financial measure. For a reconciliation of Adjusted EBITDA to the most directly comparable U.S. GAAP financial measure, information about why we consider such measure useful and a discussion of the material risks and limitations of such measure, please see “Management’s Discussion and Analysis of Financial Condition and Results of Operations — Non-GAAP Financial Measures.
202
Each named executive officer’s target annual incentive opportunity is based on a number of factors, including the individual’s role and responsibilities within the Company, the individual’s experience and expertise, pay levels in the marketplace for similar positions, and performance of the individual and the Company as a whole. For fiscal year 2025, our Compensation Committee set and the Board approved the bonus target, as a percentage of base salary, for each of our named executive officers as follows:
| | | |
FY25
Bonus Target (as % of Base Salary) |
| |||
|
Steven Murray
|
| | | | 60% | | |
|
Varun Gandhi
|
| | | | 40% | | |
Based on the formula described above, our Compensation Committee issued annual cash performance bonuses of $300,000 and $180,000 pursuant to the 2025 Cash Plan to each of Messrs. Murray and Gandhi, respectively. Such annual cash bonuses were paid in the second quarter of 2026.
Equity Compensation
Historically, the long-term incentive compensation awarded to our named executive officers has consisted of unit options to purchase incentive units in Centinel LLC granted under the Centinel Spine, LLC Unit Incentive Plan (the “Centinel LLC Incentive Plan”). For information regarding prior awards issued to our named executive officers, see “—Outstanding Equity Awards at December 31, 2025” below. In 2025, we did not grant unit options or any other equity awards to our named executive officers.
In connection with this offering, the Centinel LLC Incentive Plan and each outstanding option to purchase units in Centinel LLC granted thereunder will be assumed by Centinel Holdco and each such option will be converted into an option to purchase shares of Class A Common Stock on a -to- basis, with a corresponding adjustment to the exercise price. Except for the securities issuable upon exercise and the exercise price, all other terms of the outstanding options will remain unchanged. Following this offering, we will not make any additional grants under the Centinel LLC Incentive Plan. In connection with this offering, we intend to adopt the Centinel Spine Holdco, Inc. 2026 Omnibus Incentive Plan in order to facilitate the grant of equity incentives to directors, employees (including our named executive officers) and consultants of our company and certain of its affiliates and to enable our company and certain of its affiliates to obtain and retain services of these individuals, which is essential to our long-term success. For additional information about the Holdco Omnibus Plan, see the section titled “—Equity Incentive Plans” below.
Other Elements of Compensation
Retirement Benefits
We sponsor a 401(k) plan for all of our employees, but we make no matching or discretionary contributions to such plan. The Company has not maintained, and does not currently maintain, a defined benefit pension plan or any nonqualified deferred compensation plans.
Health/Welfare Plans
All of our full-time employees, including our named executive officers, are eligible to participate in our health and welfare plans, including medical, dental and vision benefits; health and dependent care flexible spending accounts; short-term and long-term disability insurance; accident insurance; and life and AD&D insurance.
The Company’s executive compensation program provides limited perquisites to our named executive officers that may include items such as the payment of applicable premiums on life insurance policies. Our Compensation Committee may from time to time approve perquisites in the future when it determines that such perquisites are necessary or advisable to fairly compensate or incentivize our employees.
No Tax Gross-Ups
We do not make gross-up payments to cover our named executive officers’ personal income taxes that may pertain to any of the compensation or perquisites paid or provided by our company.
203
Clawback Policy
In connection with this offering, we intend to adopt a compensation recovery policy that is compliant with the NYSE Listing Rules, as required by the Dodd-Frank Act, to be effective upon the consummation of this offering.
Outstanding Equity Awards at December 31, 2025
The following table reflects information regarding outstanding unit options to purchase incentive units in Centinel LLC held by each of our named executive officers as of December 31, 2025. The amounts set forth in the table below do not reflect the conversion of outstanding unit options in Centinel LLC into options exercisable for shares of Class A Common Stock on a -to- basis and the exercise price being correspondingly adjusted.
| | | |
Options
|
| |||||||||||||||||||||||||||
|
Name
|
| |
Grant Date
|
| |
Number of Securities
Underlying Unexercised Options (#) Exercisable(1) |
| |
Number of Securities
Underlying Unexercised Options (#) Unexercisable(2) |
| |
Option Exercise
Price ($) |
| |
Option Expiration
Date |
| |||||||||||||||
|
Steven Murray
|
| | | | 7/6/2020 | | | | | | 739,634 | | | | | | — | | | | | | 0.26 | | | | | | 3/16/2030 | | |
| | | | | | 7/6/2020 | | | | | | 739,634 | | | | | | — | | | | | | 0.26 | | | | | | 3/16/2030 | | |
| | | | | | 7/6/2020 | | | | | | 2,958,535 | | | | | | — | | | | | | 0.26 | | | | | | 3/16/2030 | | |
|
Varun Gandhi
|
| | | | 4/11/2019 | | | | | | 700,000 | | | | | | — | | | | | | 0.35 | | | | | | 4/11/2029 | | |
| | | | | | 12/31/2020 | | | | | | 200,000 | | | | | | — | | | | | | 0.26 | | | | | | 12/31/2030 | | |
| | | | | | 08/12/2021 | | | | | | 800,000 | | | | | | — | | | | | | 0.48 | | | | | | 08/12/2031 | | |
| | | | | | 03/26/2024 | | | | | | 131,250 | | | | | | 168,750 | | | | | | 0.21 | | | | | | 03/26/2034 | | |
(1)
Represents outstanding and unexercised options which were exercisable at December 31, 2025.
(2)
Represents outstanding and unexercised options which were not exercisable at December 31, 2025. The option granted to Mr. Gandhi on March 26, 2024 vests over four years, with 25% vesting upon the first anniversary of the date of grant and the remaining option vesting ratably on a quarterly basis over the remaining three years.
Employment Agreements with Our Named Executive Officers
Employment Agreement with Steven Murray
On March 16, 2020, Centinel entered into an employment agreement (the “Murray Employment Agreement”) with Mr. Murray to serve as the Company’s Chief Executive Officer.
The Murray Employment Agreement had an initial term expiring March 16, 2024, with automatic 12-month renewals on each anniversary thereafter unless earlier terminated. Mr. Murray’s annual base salary was initially set at $375,000, subject to increase from time to time as determined by the board, subject to approval of our Compensation Committee. The Murray Employment Agreement also provides that Mr. Murray will (i) be eligible for an annual bonus with a payout of up to $225,000 based upon criteria set by the Board or the Compensation Committee, which criteria may vary from year to year, and (ii) have an option to purchase incentive units of Centinel LLC, subject to the terms and conditions of the Centinel LLC Incentive Plan. Further, the Murray Employment Agreement provides that Mr. Murray will be eligible to participate in other employee benefit plans generally available to Centinel’s officers and entitled to five weeks paid vacation per year.
Centinel may terminate the Murray Employment Agreement with or without “Cause” or upon Mr. Murray’s “Disability,” as such terms are defined in the employment agreement. Mr. Murray may terminate the Murray Employment Agreement for “Good Reason” or without reason, as such terms are defined in the employment agreement. Upon termination without “Cause” or for “Good Reason,” and subject to Mr. Murray’s execution and non-revocation of a general release of claims, Centinel will pay Mr. Murray twelve months’ base salary in accordance with its usual payroll practices. This twelve-month period in which Mr. Murray receives severance is referred to as the Severance Period. In addition, if Mr. Murray elects continued coverage under COBRA,
204
Centinel will directly pay or reimburse Mr. Murray for the COBRA premiums for Mr. Murray and his covered dependents under such plans less the amount Mr. Murray would have had to pay to receive such coverage as an active employee commencing on the date of Mr. Murray’s termination and ending upon the earliest of (x) the last day of the Severance Period, (y) the date that Mr. Murray or his covered dependents become no longer eligible for COBRA, or (z) the date Mr. Murray becomes eligible to receive such coverage from a subsequent employer.
The Murray Employment Agreement includes non-solicitation and non-competition provisions that apply during employment and for twelve months thereafter. Centinel may elect to extend these restrictions for an additional six months by paying Mr. Murray an amount equal to six months of his base salary as of his termination date. The Murray Employment Agreement also includes standard confidentiality provisions.
Employment Agreement with Varun Gandhi
On August 16, 2020, Centinel entered into an employment agreement (as amended from time to time, the “Gandhi Employment Agreement”) with Mr. Gandhi to serve as the Company’s Chief Financial Officer. Under this agreement, Mr. Gandhi is an at-will employee whose employment continues until either party terminates the Gandhi Employment Agreement.
Under the Gandhi Employment Agreement, Mr. Gandhi’s annual base salary was initially set at $280,000, subject to increase to $300,000 after twelve months of continuous service, and, thereafter, subject to increase from time to time as determined by the Board, subject to approval of our Compensation Committee. The Gandhi Employment Agreement provides that Mr. Gandhi will be eligible (i) for an annual bonus with a target payout equal to up to 30% of his then current base salary based upon criteria set by the Board or our Compensation Committee, which criteria may vary from year to year, and (ii) to participate in Centinel LLC’s equity incentive plan. In addition, Centinel agreed to provide Mr. Gandhi with relocation benefits. The Gandhi Employment Agreement also provides that Mr. Gandhi will be eligible to participate in other employee benefit plans generally available to Centinel’s officers and entitled to four weeks’ paid vacation per year.
Centinel may terminate the Gandhi Employment Agreement with or without “Cause” or upon Mr. Gandhi’s “Disability,” as such terms are defined in the employment agreement. Mr. Gandhi may terminate the Gandhi Employment Agreement for “Good Reason” or without reason, as such terms are defined in the employment agreement. Upon termination without “Cause” or for “Good Reason,” and subject to Mr. Gandhi’s execution and non-revocation of a general release of claims, Centinel will pay Mr. Gandhi twelve months’ base salary in accordance with its usual payroll practices. This twelve-month period in which Mr. Gandhi receives severance is referred to as the Severance Period. In addition, if Mr. Gandhi elects health continuation coverage under COBRA, Centinel will reimburse Mr. Gandhi, a portion of the premiums for such COBRA continuation coverage equal to the amount of the employer’s share of such premiums and related COBRA administrative fees, for the duration of the Severance Period or, if earlier, the date that Mr. Gandhi is no longer eligible to receive COBRA continuation coverage or the date on which Mr. Gandhi becomes eligible to receive coverage from another employer.
The Gandhi Employment Agreement includes non-solicitation and non-competition provisions that apply during employment and for twelve months thereafter. Centinel may elect to extend these restrictions for an additional six months by paying Mr. Gandhi an amount equal to six months of his base salary as of his termination date. The Gandhi Employment Agreement also includes standard confidentiality provisions.
Potential Payments Upon Termination or a Change in Control
Change in Control Bonus Plan
In December 2024, Centinel adopted a Change in Control Bonus Plan (the “CIC Plan”) designed to retain key personnel and incentivize their efforts in connection with a potential change in control transaction involving the Company.
Under the CIC Plan, our Compensation Committee has full authority to administer and interpret its terms, select eligible employees to participate, and make all related determinations. Employees designated by the
205
Compensation Committee become participants upon executing an Award Agreement, which specifies their individual bonus entitlement. Each of our named executive officers is a participant in the CIC Plan.
A “Change in Control” is broadly defined to include a sale or disposition of substantially all of the Company’s assets, or a merger, consolidation, or reorganization where existing equity holders retain less than 50% voting power of the surviving entity. However, a Change in Control shall not include bona fide equity financing purposes in which cash is received by the Company or any successor or indebtedness of the Company is cancelled or converted, or a combination thereof. Whether or not an event or transaction constitutes a Change in Control shall be determined by the Compensation Committee in its sole discretion. If a Change in Control occurs, each of our named executive officers would be entitled to receive a cash transaction bonus based on the Company’s enterprise value as set forth below, generally payable within 30 days of the transaction closing.
|
If the Enterprise Value is:
|
| |
Then the Applicable
Transaction Bonus Payable to Mr. Murray would be: |
| |
Then the Applicable
Transaction Bonus Payable to Mr. Gandhi would be: |
| ||||||
|
Less than $300M
|
| | | $ | 0 | | | | | $ | 0 | | |
|
$300M but less than $400M
|
| | | $ | 680,000 | | | | | $ | 660,000 | | |
|
$400M but less than $500M
|
| | | $ | 850,000 | | | | | $ | 825,000 | | |
|
$500M but less than $600M
|
| | | $ | 1,360,000 | | | | | $ | 1,320,000 | | |
|
$600M but less than $700M
|
| | | $ | 1,870,000 | | | | | $ | 1,815,000 | | |
|
$700M or more
|
| | | $ | 2,210,000 | | | | | $ | 2,145,000 | | |
If the enterprise value falls between threshold levels, the bonus payout would be calculated based on linear interpolation. To receive payment, a participant must remain continuously employed through the closing of the Change in Control (unless terminated without Cause within 90 days before the transaction, which constitutes a “Qualifying Termination”), satisfy all CIC Plan conditions, and execute a general release of claims against the Company. If any portion of the transaction consideration is subject to escrow, earn-out, or contingent payment, our Compensation Committee may exclude it initially and recalculate bonuses if such amounts are paid within five years. This offering will not be considered a Change in Control for purposes of the CIC Plan.
The CIC Plan may be amended by our Compensation Committee, provided no changes materially and adversely affect a participant’s rights without consent. The CIC Plan terminates upon a Change in Control or an IPO (as defined in the CIC Plan), and because this offering is not considered to be a Change in Control for purposes of the CIC Plan, no outstanding payment obligations will survive this offering. The awards under the CIC Plan are non-transferable and non-assignable by participants, while the Company may assign the CIC Plan to affiliates or successors. The CIC Plan does not guarantee continued employment, is unfunded, and does not restrict the Company’s ability to negotiate or decline any transaction.
Other than as described in this section and above under “—Employment Agreements with Our Named Executive Officers”, we do not have agreements with our named executive officers that provide for payments upon termination or in connection with a change in control of the company.
Centinel LLC Unit Incentive Plan
As described above, we maintain the Centinel LLC Incentive Plan which provides for the grant of unit options to purchase incentive units in Centinel LLC to eligible employees, members of the board, consultants and advisors of Centinel LLC and its subsidiaries. In connection with this offering, the Centinel LLC Incentive Plan and each outstanding option to purchase units in Centinel LLC granted thereunder will be assumed by Centinel Holdco each such option will be and converted into an option to purchase shares of Class A Common Stock on a -to- basis, with a corresponding adjustment to the exercise price. Except for the securities issuable upon exercise and the exercise price, all other terms of the outstanding options, including the provisions related to payments upon termination or change in control, will remain unchanged.
Termination of Service
Unless otherwise specified in an award agreement between the participant and the Company, if a participant’s employment is terminated, outstanding vested and unvested unit options under the Centinel LLC Incentive Plan will be subject to the following treatment:
206
|
Reason for Termination
|
| |
Effect on Options under the Centinel LLC
Incentive Plan, except as otherwise specified in an award agreement or other written agreement |
|
|
Death or Disability
|
| |
Vested options will be exercisable for a one-year period unless the option has an earlier expiration date or the Compensation Committee extends the exercise period. Unvested options will expire on the date of termination.
|
|
|
For Cause Termination
|
| |
All outstanding options, whether or not vested, earned or exercisable, will be forfeited.
|
|
|
Other Termination Events
|
| |
Vested options will be exercisable for a 90-day period unless the option has an earlier expiration date or the Compensation Committee extends the exercise period. Unvested options will expire on the date of termination.
|
|
Change in Control
In addition, upon or in anticipation of any Change in Control, our Compensation Committee may, in its sole and absolute discretion and without the need for the consent of any participant in the Centinel LLC Incentive Plan, take one or more of the following actions contingent upon the occurrence of such Change in Control: (i) cause any or all outstanding options to become vested and immediately exercisable, in whole or in part; (ii) after providing reasonable advance notice of the Change in Control, cancel any or all vested options upon closing of the Change in Control to the extent not exercised prior to the closing of the Change in Control; (iii) cancel any option in exchange for a substitute award in a manner consistent with applicable tax rules or regulations (notwithstanding the fact that the original option may never have been intended to satisfy the requirements for treatment as an incentive stock option); (iv) cancel any option in exchange for cash and/or other substitute consideration with a value equal to (A) the number of units subject to that option, multiplied by (B) the amount, if any, by which the fair market value per common unit on the date of the Change in Control exceeds the exercise price of that option; provided, that if the fair market value per common unit on the date of the Change in Control does not exceed the exercise price of any such option, the Compensation Committee may cancel that option without any payment of consideration therefor. In the discretion of the board, any cash or substitute consideration payable upon cancellation of an option may be subjected to (i) vesting terms substantially identical to those that applied to the cancelled option immediately prior to the Change in Control, or (ii) earn-out, escrow, holdback or similar arrangements, to the extent such arrangements are applicable to consideration paid to our equity holders in connection with that Change in Control.
Under the Centinel LLC Incentive Plan, the term “Change in Control” means any transaction or series of related transactions resulting in any of the following: (i) a sale, lease, license, transfer, exchange or other disposition of all or substantially all of our assets or (ii) a merger, consolidation, sale or reorganization as a result of which our equity security holders immediately prior to such merger, consolidation, sale or reorganization possess less than fifty percent (50%) of the voting power of the acquiring, surviving or successor entity immediately following such merger, consolidation, sale or reorganization; provided, however, that a “Change in Control” shall not include any transaction or series of related transactions principally undertaken for bona fide equity financing purposes in which cash is received by us or any successor or our indebtedness is cancelled or converted, or a combination thereof. For the avoidance of doubt, the exercise of options, warrants, or issuance of units under a convertible note or other rights to purchase our equity securities (other than by a third party) shall not constitute a Change in Control.
Equity Incentive Plans
Centinel LLC Unit Incentive Plan
As described above, we maintain the Centinel LLC Incentive Plan, which provides for the grant of unit options to purchase incentive units in Centinel LLC to eligible employees, members of the board, consultants and advisors of Centinel LLC and its subsidiaries. As of , 2026, units were subject to outstanding unit options granted under the Centinel LLC Incentive Plan. In connection with this offering, the Centinel LLC Incentive Plan and each outstanding option to purchase units in Centinel LLC granted thereunder will
207
be assumed by Centinel Holdco and each such option will be converted into an option to purchase shares of Class A Common Stock on a -to- basis, with a corresponding adjustment to the exercise price. Except for the securities issuable upon exercise and the exercise price, all other terms of the outstanding options will remain unchanged. Following this offering, we will not make any additional grants under the Centinel LLC Incentive Plan. We intend to file a registration statement on Form S-8 under the Securities Act to register the shares of Class A Common Stock issuable upon exercise of options outstanding under the Centinel LLC Incentive Plan.
Centinel Spine Holdco, Inc. 2026 Omnibus Incentive Plan
In advance of the offering, we expect to adopt the Holdco Omnibus Plan. The purpose of the Holdco Omnibus Plan will be to provide our directors, officers, employees and consultants of the Company or an affiliate of the Company with an equity-based incentive to maintain and enhance the performance and profitability of the Company. The Holdco Omnibus Plan will allow for the grant of stock options, both incentive stock options and “non-qualified” stock options; stock appreciation rights (SARs), alone or in conjunction with other awards; restricted stock and restricted stock units (RSUs); other cash-based performance awards; and other stock-based awards. We refer to these collectively herein as Awards.
The following description of the Holdco Omnibus Plan is not intended to be complete and is qualified in its entirety by the complete text of the Holdco Omnibus Plan, a copy of which will be filed as an exhibit to the registration statement of which this prospectus forms a part. Stockholders and potential investors are urged to read the Holdco Omnibus Plan in its entirety. Any capitalized terms which are used in this summary description but not defined here or elsewhere in this prospectus have the meanings assigned to them in the Holdco Omnibus Plan.
Following this offering, we will not make any additional grants under the Centinel LLC Incentive Plan.
Administration
The Holdco Omnibus Plan will be administered by Centinel Holdco’s Compensation Committee, or such other committee designated by Centinel Holdco’s board of directors to administer the plan, which we refer to herein as the Administrator. The Administrator will have broad authority, subject to the provisions of the Holdco Omnibus Plan, to administer and interpret the Holdco Omnibus Plan and Awards granted thereunder. All decisions and actions of the Administrator will be final. The Compensation Committee’s determinations under the Holdco Omnibus Plan (including, without limitation, determinations of the persons to receive awards, the form, amount and timing of such awards, the terms and provisions of such awards and the award agreements evidencing such awards) need not be uniform and may be made by the Compensation Committee selectively among persons who receive, or are eligible to receive, awards under the Holdco Omnibus Plan, whether or not such persons are similarly situated.
The Compensation Committee may delegate its authority with respect to the grant, amendment, interpretation and administration of awards, other than awards to officers of our Company subject to Section 16 of the Exchange Act, to a person, persons or subcommittee, in its sole and absolute discretion and as permitted by applicable law and the Holdco Omnibus Plan.
Stock Subject to Holdco Omnibus Plan
The maximum number of shares of Class A Common Stock that may be issued under the Holdco Omnibus Plan will not exceed shares (the “Share Pool”), subject to certain adjustments in the event of a change in our capitalization. The Share Pool will be increased on January 1 of each calendar year beginning in 2027 and ending on January 1, 2036, by a number of shares equal to the lesser of (a) 5% of the outstanding shares of Class A Common Stock on December 31 of the prior year or (b) such lesser number of shares as the Board may determine. Up to shares of Common Stock may be issued upon the exercise of Incentive Stock Options under the Holdco Omnibus Plan.
Shares of Class A Common Stock issued under the Holdco Omnibus Plan may be either originally issued shares or treasury shares. If an award is forfeited, terminates or expires without having been exercised in full, the shares underlying such forfeited, terminated, or expired award will return to the pool of shares available
208
for issuance under the Holdco Omnibus Plan. Shares surrendered in payment of the exercise price of a stock option and shares withheld or surrendered for payment of taxes with respect to any award will not be available for re-issuance under the Holdco Omnibus Plan. If SARs are exercised and settled in Class A Common Stock, the full number of shares subject to the SARs will be considered issued under the Holdco Omnibus Plan, without regard to the number of shares issued upon settlement of the SARs.
The Holdco Omnibus Plan also provides for Substitute Awards, which are awards granted in assumption of, or in substitution for, outstanding awards previously granted by an entity acquired by the Company or with which the Company combines. Shares delivered in connection with Substitute Awards will not reduce the Share Pool.
Eligibility
Generally, all officers, directors, employees, consultants and/or advisors of Centinel Holdco and each of its subsidiaries will be eligible to receive awards under the Holdco Omnibus Plan.
Non-Employee Director Compensation Limits
Pursuant to the Holdco Omnibus Plan, the maximum grant date value of shares subject to awards granted to any non-employee director during any calendar year, taken together with any cash fees payable to such non-employee director for services rendered during the calendar year, may not exceed $ in total. The value of such awards shall be calculated based on the grant date fair value of such awards for financial reporting purposes.
Types of Awards
The following types of awards may be granted under the Holdco Omnibus Plan:
•
options (both incentive stock options and non-qualified options);
•
stock appreciation rights (SARs);
•
restricted stock;
•
restricted stock units; and
•
other equity- and cash-based awards.
Awards will be evidenced by award agreements (which need not be identical) in such forms as the Compensation Committee may from time to time approve. In the event of any conflict between the provisions of the Holdco Omnibus Plan and any such agreements, the provisions of the Holdco Omnibus Plan shall prevail. All awards must be granted on or before the tenth anniversary of the effective date of the Holdco Omnibus Plan.
Stock Options. Each award of options will be subject to such terms and conditions consistent with the Holdco Omnibus Plan as determined by the Compensation Committee and as set forth in the applicable award agreement. Options granted under the Holdco Omnibus Plan may be incentive stock options (qualifying for favorable income tax treatment under Section 422 of the Code) or non-qualified stock options. The Compensation Committee will determine the exercise price at which shares underlying a stock option may be purchased. The exercise price for options granted under the Holdco Omnibus Plan must be equal to at least 100% of the fair market value (as defined in the Holdco Omnibus Plan) of Centinel Holdco’s Class A Common Stock as of the date of the grant of the option, except that the option exercise price of an incentive stock option granted to an individual owning shares of Centinel Holdco possessing more than 10% of the total combined voting power of all classes of stock of Centinel Holdco on the date of the grant (“Ten Percent Holder”) must not be less than 110% of the fair market value as of the date of the grant of the option. The aggregate fair market value (determined on the date of grant) of the shares of Centinel Holdco Class A Common Stock subject to incentive stock options granted to an employee and which first become exercisable during any calendar year cannot exceed $100,000. The exercise price may be paid pursuant to one or more of the following methods: cash, check, by delivering shares of common stock owned by the participant (or attesting to ownership of such shares), by permitting Centinel Holdco to withhold shares of Class A Common
209
Stock for which the stock option is exercisable, or through a cashless (net) exercise procedure in which the Company delivers to the participant a number of shares of Class A Common Stock equal to the spread value (fair market value less the exercise price), reduced by shares having a value equal to applicable tax withholding obligations. In no event will an incentive stock option granted to a Ten Percent Holder be exercisable after five years from the date of grant and all other options will not be exercisable after ten years from the date of grant. The Holdco Omnibus Plan also contains an automatic exercise provision which provides that, unless the applicable award agreement provides otherwise, immediately before its expiration, an option will be deemed automatically exercised if certain conditions set forth in the Holdco Omnibus Plan are satisfied, including the option being in-the-money. A participant may not receive dividend equivalents with respect to stock options.
Stock Appreciation Rights or SARs. A SAR is a right to receive a payment in cash, shares of Class A Common Stock or a combination of cash and shares of Class A Common Stock, in an amount equal to the fair market value of a specified number of shares on the date of exercise over the applicable base price per share, as determined by the Compensation Committee. Each award of SARs will be subject to such terms and conditions consistent with the Holdco Omnibus Plan as determined by the Compensation Committee and as set forth in the applicable award agreement. The base price per share may not be less than the fair market value of a share of Class A Common Stock on the date the SAR is granted. SARs are exercisable as determined by the Compensation Committee and specified in the applicable award agreement. No SAR will be exercisable later than ten years after the date it is granted. The Holdco Omnibus Plan also contains an automatic exercise provision which provides that immediately before its expiration, a SAR will be deemed automatically exercised if certain conditions set forth in the Holdco Omnibus Plan are satisfied, including the SAR being in-the-money. A participant may not receive dividend equivalents with respect to SARs.
Restricted Stock and RSUs. Each award of restricted stock or restricted stock units will be subject to such terms and conditions consistent with the Holdco Omnibus Plan as determined by the Compensation Committee and as set forth in the applicable award agreement. Restricted shares granted under the Holdco Omnibus Plan are, for a period of time determined by the Compensation Committee, subject to forfeiture if certain conditions established by the Compensation Committee, including performance standards set by the Compensation Committee, are not met. A restricted stock unit is a unit that entitles the participant to receive one share of our Class A Common Stock or cash upon satisfaction of the vesting condition set forth in the award agreement, which may include time-based and/or performance-based conditions. The Compensation Committee will establish the terms and conditions upon which the restrictions on those shares or units will lapse. In addition, the Compensation Committee may at any time, in its sole discretion, waive, in whole or in part, any remaining conditions to vesting with respect to a participant’s restricted stock or restricted stock units.
Participants holding restricted shares may have such rights with respect to such shares as may be determined by the Compensation Committee and set forth in the applicable award agreement, including the right to vote such shares. Participants holding restricted stock units do not possess any voting rights with respect to those units. Cash dividends declared or paid on restricted shares will be deferred until the lapsing of any restrictions imposed on such restricted shares. The Compensation Committee will determine whether a participant granted a restricted stock unit will be entitled to receive an amount equal to any dividends paid on shares underlying the restricted stock unit, referred to as “dividend equivalents.” Dividend equivalents will vest and be paid only if and to the extent the underlying restricted stock units vest and are paid. Dividend equivalents may be payable in cash or in the form of additional shares subject to the award.
Other Equity- and Cash-Based Awards. Each other type of equity- and cash-based award will be subject to such terms and conditions consistent with the Holdco Omnibus Plan as determined by the Compensation Committee and as set forth in the applicable award or other agreement evidencing such award.
Clawback
All awards under the Holdco Omnibus Plan will be subject to the provisions of any clawback or recoupment policy approved by the Board and/or Compensation Committee, as such policy may be in effect from time to time. Unless otherwise determined by the Compensation Committee, to the extent that a participant receives any amount in excess of the amount that the participant should otherwise have received under the terms of the award for any reason (including, without limitation, by reason of a financial restatement, mistake in calculations, or other administrative error), the participant will be required to repay us any such excess amount.
210
Termination of Employment
Unless otherwise specified in an award agreement or any other written agreement between the participant and Centinel Holdco or any of its subsidiaries, or as otherwise determined by the Compensation Committee, if a participant’s employment is terminated, outstanding vested and unvested awards under the Holdco Omnibus Plan will be subject to the following treatment:
|
Reason for Termination
|
| |
Effect on Awards, except as otherwise specified
in an award agreement or other written agreement |
|
| Death or Disability | | |
•
All unvested restricted stock awards and restricted stock units will become vested; provided, however, that restricted stock awards and restricted stock units vesting in whole or in part based on performance will be governed by the terms of the applicable award agreement.
|
|
| | | |
•
All unexercisable stock options and SARs will become exercisable and will be exercisable for one year unless the award has an earlier expiration date; provided, however, that stock options and SARS vesting in whole or in part based on performance will be governed by the terms of the applicable award agreement.
•
All exercisable options and SARs will be exercisable for one year unless the award has an earlier expiration date.
|
|
| For Cause Termination | | |
•
All outstanding awards, whether or not vested, earned or exercisable, will be forfeited.
|
|
| Other Termination Events | | |
•
Unvested, unearned or unexercisable awards will be forfeited.
•
All exercisable options and SARs will be exercisable for 90 days unless the award has an earlier expiration date.
|
|
| Retirement: | | |
•
All unvested restricted stock awards and restricted stock units will continue to vest in accordance with the terms of the award.
|
|
| | | |
•
All unvested stock options and SARs will continue to vest in accordance with the term of the award. The option will expire on the date that is one year following the later of the optionee’s termination of service or the date the applicable portion of the option becomes vested and exercisable.
|
|
The Holdco Omnibus Plan defines “Retirement” as a voluntary termination of employment after the participant has attained age 62 with at least five years of continuous employment with Centinel Holdco or its subsidiaries. The treatment of awards upon a Retirement is governed by the terms of the applicable award agreement. The form of award agreement to be adopted in advance of the offering that will be utilized for awards granted to our executive officers is expected to treat awards upon Retirement as set forth in the table above. In addition, the form of award agreement will contain a provision requiring at least one year of continuous employment with Centinel Holdco or its subsidiaries from the date of grant in order for the retirement provisions to apply to a particular award.
Adjustments to Awards Due to Changes in Centinel Holdco’s Capital Structure
In the event of a stock dividend declared upon, or a stock split or reverse stock split affecting shares of, Centinel Holdco’s Class A Common Stock:
•
the maximum number of shares as to which awards may be granted under the Holdco Omnibus Plan and the maximum number of shares with respect to which awards may be granted during any one fiscal year of our Company to any individual, and
•
the number of shares covered by and the option price, base price, and other terms of outstanding awards, will, without further action of the Board, be adjusted to reflect such event unless the Board determines, at the time it approves such stock dividend, stock split, or reverse stock split, that no such adjustment will be made. The Compensation Committee may make adjustments, in its discretion, to address the treatment of fractional shares and fractional cents that arise with respect to outstanding awards as a result of the stock dividend, stock split, or reverse stock split.
211
In the event of any other change affecting shares of Centinel Holdco’s Class A Common Stock, Centinel Holdco, or its capitalization, by reason of a spin-off, split-up, dividend, recapitalization, merger, consolidation, or share exchange, other than any such change that is part of a transaction resulting in a change in control, the Compensation Committee, in its discretion and without the consent of the holders of the awards, will make:
•
appropriate adjustments to the maximum number and kind of shares reserved for issuance or with respect to which Awards may be granted under the Holdco Omnibus Plan, in the aggregate and with respect to any individual during any one fiscal year of Centinel Holdco, and
•
any adjustments in outstanding awards, including, but not limited to, reducing the number, kind and price of securities subject to awards.
The Compensation Committee is authorized to make, in its discretion and without the consent of holders of awards, adjustments in the terms and conditions of, and the criteria included in, awards in recognition of unusual or nonrecurring events affecting Centinel Holdco, or the financial statements of Centinel Holdco or any affiliate, or of changes in applicable laws, regulations or accounting principles, whenever the Compensation Committee determines that such adjustments are appropriate in order to prevent dilution or enlargement of the benefits or potential benefits intended to be made available under the Holdco Omnibus Plan.
No Repricing of Options and SARs
Except in connection with adjustments due to changes in Centinel Holdco’s capital structure described above, neither the Board nor the Compensation Committee may, without obtaining prior approval by the Company’s shareholders, reduce the option price or base price of any issued and outstanding option or SAR granted under the Holdco Omnibus Plan, including through cancellation and re-grant or any other method (including the repurchase of an option or SAR that is “out of the money” in exchange for an option or SAR, cash, and/or other property), at any time during the term of such option or SAR.
Amendment and Termination
The Board or the Compensation Committee may amend or terminate the Holdco Omnibus Plan from time to time in such manner as it may deem advisable. However, except in connection with adjustments due to changes in Centinel Holdco’s capital structure described above, neither the Board nor the Compensation Committee may, without obtaining stockholder approval, change the class of individuals eligible to receive an incentive stock option, extend the expiration date of the Holdco Omnibus Plan, decrease the minimum option price of an incentive stock option granted under the Holdco Omnibus Plan, or increase the maximum number of shares as to which awards may be granted. No award will be materially adversely affected by any such termination or amendment without the written consent of the affected participant.
Cash Incentive Plan
Centinel Spine Holdco, Inc. Annual Cash Bonus Plan
In advance of the offering, we expect to adopt the Centinel Spine Holdco, Inc. Annual Cash Bonus Plan (the “Holdco Cash Plan”). The purpose of the Holdco Cash Plan is to align officers’ and other employees’ efforts with the strategic goals of the Company through competitive annual incentive opportunities, and to enhance Centinel Holdco’s ability to attract and retain highly talented individuals. The Holdco Cash Plan will be administered by the Compensation Committee, which has broad authority to establish rules, construe the Plan, correct defects, and determine whether conditions to payment have been satisfied. The Compensation Committee will have the power to grant awards under the Holdco Cash Plan, determine the amount of cash to be paid pursuant to each award and the terms and conditions of each award. The Compensation Committee may delegate its authority with respect to awards other than those granted to Section 16(b) Officers. All awards are subject to any clawback or recoupment policy approved by the Board and/or the Compensation Committee.
The following description of the Holdco Cash Plan is not intended to be complete and is qualified in its entirety by the complete text of the Holdco Cash Plan, a copy of which will be filed as an exhibit to the registration statement of which this prospectus forms a part. Stockholders and potential investors are urged
212
to read the Holdco Cash Plan in its entirety. Any capitalized terms which are used in this summary description but not defined here or elsewhere in this prospectus have the meanings assigned to them in the Holdco Cash Plan.
Prior to, or reasonably promptly following the start of each year, Centinel Holdco’s Compensation Committee will establish a target award for each participant, expressed as a percentage of the participant’s base salary or, in special circumstances, as a fixed cash amount. The Compensation Committee will also establish performance goals for each plan year based on one or more performance criteria, which may be tied to specific levels of Centinel Holdco’s performance (or the performance of a division, business unit, or operational unit), individual performance, and/or subjective criteria. Performance goals may include a threshold level of performance below which no award will be paid, a target level, and a maximum level above which no additional amount will be paid. The Compensation Committee will specify both maximum and threshold award levels for each Participant, expressed as percentages of the target award.
Awards will be payable only after the Compensation Committee certifies that the applicable performance goals have been satisfied, and final payouts vary based on the level of goal attainment measured against pre-determined weightings. Notwithstanding the formula-driven calculation, the Compensation Committee retains discretion to reduce, eliminate, or increase the amount otherwise payable if it determines such adjustment is in the best interests of Centinel Holdco. Awards are generally paid on or before two and one-half months following the end of the fiscal year in which payment is earned, and participants must be employed full-time on the date of payment to receive the award, except as otherwise provided. In the event of a participant’s death, disability, retirement, or termination of employment, the Compensation Committee may, in its sole discretion, make a full or pro-rated payment, subject to Section 409A.
The Board (or a duly authorized committee thereof) reserves the right to amend, suspend, or terminate the Plan at any time. Payments under the Plan are intended to be either exempt from or compliant with Section 409A of the Internal Revenue Code, including a six-month delay for specified employees upon separation from service.
Director Compensation
The following table sets forth information concerning the compensation awarded to, earned by or paid to non-employee members of the board of Centinel LLC for the year ended December 31, 2025.
|
Name
|
| |
Fees Earned or
Paid in Cash ($)(1) |
| |
Option
Awards ($)(2) |
| |
Total
($) |
| |||||||||
|
Ali Abdullah Al Amri
|
| | | | 25,000 | | | | | | — | | | | | | 25,000 | | |
|
Robert Donohue
|
| | | | 25,000 | | | | | | — | | | | | | 25,000 | | |
|
Craig Greener
|
| | | | 25,000 | | | | | | — | | | | | | 25,000 | | |
|
Dirk Kuyper
|
| | | | 50,000 | | | | | | — | | | | | | 50,000 | | |
|
Deepankar Panigrahi
|
| | | | 25,000 | | | | | | — | | | | | | 25,000 | | |
|
Gregory Rainey(3)
|
| | | | 25,000 | | | | | | — | | | | | | 25,000 | | |
|
Anthony Viscogliosi
|
| | | | 25,000 | | | | | | — | | | | | | 25,000 | | |
|
Marc Viscogliosi
|
| | | | 25,000 | | | | | | — | | | | | | 25,000 | | |
(1)
Mr. Donohue and Mr. Greener serve on Centinel’s board as representatives of AW Alpha Capital LLC. Mr. Panigrahi and Mr. Al Amri serve on Centinel’s board as representatives of Delac Spine Inc. Messrs. Anthony Viscogliosi and Marc Viscogliosi serve on Centinel’s board as representatives of Viscogliosi Brothers, LLC.
Representatives of AW Alpha Capital LLC, Delac Spine Inc. and Viscogliosi Brothers, LLC on Centinel’s board are entitled to an annual board fee of $25,000 (all board fees earned by Mr. Donohue and Mr. Greener were paid to WJFS, Inc., an affiliate of AW Alpha Capital LLC). Mr. Kuyper, an independent representative on Centinel’s board, is entitled to an annual board fee of $50,000.
(2)
No option awards were granted to the non-employee board members of Centinel LLC during 2025. As of December 31, 2025, the aggregate number of unit options (exercisable and unexercisable) held by each of our non-employee board members was: Mr. Kuyper—125,000 ; and Anthony Viscogliosi—50,000.
(3)
Mr. Rainey resigned from his position as an independent representative on Centinel’s board, effective as of May 11, 2025.
213
In connection with this offering, we expect to adopt a director compensation program pursuant to which we expect to pay a combination of cash retainers and equity awards to each of our non-employee directors for his or her services on our board of directors. We also expect that the director compensation program will provide each director with reimbursement for reasonable travel and miscellaneous expenses incurred in attending meetings and activities of our board of directors and its committees.
214
CERTAIN RELATIONSHIPS AND RELATED PARTY TRANSACTIONS
The following includes a summary of transactions since January 1, 2023 and any currently proposed transaction, to which we have been a party or are to be a participant, in which:
•
the amount involved exceeded or will exceed the lesser of $120,000 or one percent of the average of our total assets at year-end for the last two completed fiscal years, and
•
any of our directors, executive officers or beneficial owners of more than 5% of our capital stock or any member of the immediate family of any of the foregoing persons had or will have a direct or indirect material interest, other than equity and other compensation, termination, change in control and other arrangements, which are described in the section titled “Executive and Director Compensation.”
We also describe below certain other transactions with our directors, executive officers and principal stockholders.
Director Relationships
Some of our directors are associated with our principal stockholders as indicated in the table below:
|
Director
|
| |
Principal Stockholder
|
|
|
Robert Donohue(1)
|
| | AW Alpha Capital LLC | |
|
Craig Greener(1)
|
| | AW Alpha Capital LLC | |
|
Ali Abdullah Al Amri(2)
|
| | Delac Spine Inc. | |
|
Deepankar Panigrahi(2)
|
| | Delac Spine Inc. | |
|
Anthony Viscogliosi(3)
|
| |
Viscogliosi Brothers, LLC
|
|
|
Marc Viscogliosi(3)
|
| |
Viscogliosi Brothers, LLC
|
|
(1)
Robert Donohue is the manager of AW Alpha Capital LLC, and Craig Greener serves as Director of Acquisitions of WJFS, Inc., an affiliate of AW Alpha Capital LLC.
(2)
Deepankar Panigrahi serves as investment manager, and Ali Abdullah Al Amri serves as Manager, Private Markets, for the Oman Investment Authority, a sovereign wealth fund of the Sultanate of Oman (“OIA”). OIA is the sole stockholder of Delac Spine Inc.
(3)
Each of Anthony Viscogliosi and Marc Viscogliosi is a member of Viscogliosi Brothers, LLC (“VB”).
Convertible Promissory Notes Financing
From November 2021 to May 2024, we issued and sold to investors in private placements an aggregate principal amount of approximately $46.0 million of 4.42% Convertible Notes. The 4.42% Convertible Notes had an initial interest rate of 1.08%, subject to increases to match any greater interest rate that we agreed to in subsequent issuances of convertible notes. As of June 30, 2026, the interest rate on such notes was 4.42%. The maturity date of the Promissory Notes ranges from November 2030 to May 2033. As of June 30, 2026, the aggregate principal amount of the 4.42% Convertible Notes was $46.0 million, and the accrued interest on the 4.42% Convertible Notes was $6.9 million as of June 30, 2026. Our obligations under the 4.42% Convertible Notes are unsecured and subordinated to our obligations under the Loan Agreement and the 2025 Credit Agreement. As part of the Organizational Transactions, the outstanding principal amount of the 4.42% Convertible Notes and accrued interest thereon will convert into shares of Class A Common Stock in connection with the completion of this offering. See “Organizational Structure.”
The following table sets forth the aggregate principal amount of Promissory Notes purchased by certain of our directors, executive officers and beneficial owners of more than 5% of our capital stock, and any member of the immediate family of any of the foregoing persons.
215
|
Participants(1)
|
| |
Promissory Notes
Purchased |
| |||
|
Viscogliosi Brothers, LLC
|
| | | $ | 16,860,496 | | |
|
Viscogliosi Brothers Watermark Holdings, LLC
|
| | | | 2,000,000 | | |
|
Viscogliosi Brothers Venture Partners XIV, LLC
|
| | | | 1,514,720 | | |
|
Viscogliosi Brothers Venture Partners XX, LLC
|
| | | | 993,600 | | |
|
Delac Spine Inc.
|
| | | | 10,000,000 | | |
|
AW Alpha Capital LLC
|
| | | | 5,000,000 | | |
|
Steven Murray
|
| | | | 450,000 | | |
|
Dirk Kuyper
|
| | | | 100,000 | | |
(1)
Additional details regarding these stockholders and their equity holdings are provided in this prospectus under the caption “Principal Stockholders.”
Transactions with Viscogliosi Brothers, LLC and Its Affiliates
Musculoskeletal Clinical & Regulatory Advisors, LLC
Centinel paid Musculoskeletal Clinical & Regulatory Advisors, LLC (“MCRA”), which was a majority owned subsidiary of VB, for clinical, regulatory and quality consulting services. On July 31, 2024, VB sold all of its interests in MCRA, and MCRA is no longer our related party. Centinel incurred general and administrative expenses of approximately $2.0 million and $3.3 million for MCRA’s services during the years ended December 31, 2024 and 2023, respectively. As of December 31, 2023, we had approximately $1.1 million payable to MCRA in unpaid billings, which was paid in full during the next consecutive fiscal year.
Summit Orthopedic Technologies LLC
Summit Orthopedic Technologies LLC (“Summit”) provides contract manufacturing and related production services for our medical device products. We incurred manufacturing expenses of approximately $0.2 million and $0.1 million during the year ended December 31, 2025 and the six months ended June 30, 2026, respectively, in connection with services provided to us by Summit. In August 2026, a subsidiary of Viscogliosi Brothers Watermark Holdings, LLC (a joint venture between VB and Watermark Holdings, LLC) that previously invested in Summit sold all of its membership interests in Summit, but it will retain a 5% phantom equity interest in the distributable proceeds upon the future sale of Summit.
Centinel Spine Holdings, Inc.
We had a net receivable of $15,000 to Centinel Spine Holdings, Inc. (“Holdings”), as a result of transactions enacted on Holding’s behalf at each of June 30, 2026, December 31, 2025, 2024 and 2023. VB is a majority stockholder of Holdings.
Registration Rights Agreement
In connection with this offering, we intend to enter into a registration rights agreement with certain holders of Centinel’s securities. For a description of these registration rights, see the section titled “Description of Capital Stock—Registration Rights.”
Amended and Restated Operating Agreement of Centinel LLC
In connection with the completion of this offering, we will amend and restate the existing Centinel LLC Agreement. The operations of Centinel LLC, and the rights and obligations of the holders of LLC Units will be set forth in the Amended and Restated Centinel LLC Agreement. See “Organizational Structure.”
Tax Receivable Agreement
We intend to enter into a Tax Receivable Agreement with Centinel LLC, the Continuing Equity Owners and the Blocker Stockholders, that will provide for the payment by us to such persons of 85% of the amount of
216
certain tax benefits, if any, that Centinel Holdco actually realizes, or in some circumstances is deemed to realize (calculated using certain assumptions), as a result of (i) our allocable share of existing tax basis in Centinel LLC’s assets acquired in this offering, (ii) increases in our allocable share of existing tax basis and tax basis adjustments to the tangible and intangible assets of Centinel LLC as a result of sales or exchanges of LLC Units in connection with or after this offering, (iii) our utilization of certain tax attributes (including any existing tax basis) of the Blocker Companies, which we acquire in connection with this offering, and (iv) certain other tax benefits related to our entering into the tax receivable agreement, including tax benefits attributable to payments under the Tax Receivable Agreement. We retain the benefit of the remaining 15% of these tax benefits, if any. If the Tax Receivable Agreement terminates early, we could be required to make a substantial, immediate lump-sum payment. These payment obligations are obligations of Centinel Holdco and not of Centinel LLC. See “Organizational Structure—Tax Receivable Agreement.”
Exchange Agreement
We intend to enter into the Exchange Agreement with Centinel LLC and the Continuing Equity Owners. Under the Exchange Agreement, the Continuing Equity Owners (and any permitted transferees thereof) may (subject to the terms of the Exchange Agreement) exchange Series B Common Units for, at our election, shares of Class A Common Stock on a one-for-one basis or, cash, as set forth in the Exchange Agreement; provided that we may elect to settle an exchange in cash only in connection with a substantially concurrent public offering or private sale of Class A Common Stock and only to the extent of the proceeds received by us in such offering or sale. The holders of Series B Common Units will also be required to deliver to us an equivalent number of shares of Class B Common Stock to effectuate an exchange. Any Series B Common Units and shares of Class B Common Stock so delivered will be cancelled, and Centinel LLC will issue us a number of Series A Common Units equal to the number of cancelled Series B Common Units. As a holder exchanges its Series B Common Units of Centinel LLC, our interest in Centinel LLC will be correspondingly increased. See “Organizational Structure—Exchange Agreement.”
Indemnification of Directors and Officers
We plan to enter into indemnification agreements with each of our directors and executive officers, the form of which is attached as an exhibit to the registration statement of which this prospectus is a part. The indemnification agreements and our amended and restated certificate of incorporation require us to indemnify our directors and officers to the fullest extent permitted by Delaware law. For further information, see the section titled “Description of Capital Stock—Limitations on Liability and Indemnification of Officers and Directors.”
Policies and Procedures for Related Party Transactions
All transactions with VB and its affiliates, as well as equity financings, in which holders of more than 5% of Centinel LLC’s equity participate, were approved by Centinel LLC’s board of representatives.
Our board of directors will adopt a written related person transaction policy, to be effective upon the completion of this offering, setting forth the policies and procedures for the review and approval or ratification of related person transactions. This policy will cover, with certain exceptions set forth in Item 404 of Regulation S-K, any transaction, arrangement or relationship, or any series of similar transactions, arrangements or relationships, in which we were or are to be a participant, where the amount involved exceeds $120,000 in any fiscal year, or, for so long as we qualify as a smaller reporting company, the lesser of $120,000 or one percent of the average of our total assets at year-end for the last two completed fiscal years, and a related person had, has or will have a direct or indirect material interest, including without limitation, purchases of goods or services by or from the related person or entities in which the related person has a material interest, indebtedness, guarantees of indebtedness and employment by us of a related person. In reviewing and approving any such transactions, our audit committee will be tasked to consider all relevant facts and circumstances, including, but not limited to, whether the transaction is on terms comparable to those that could be obtained in an arm’s length transaction and the extent of the related person’s interest in the transaction. All of the transactions described in this section will have occurred prior to the adoption of this policy.
217
PRINCIPAL STOCKHOLDERS
The following table presents information as of , 2026, as to the beneficial ownership of our Class A Common Stock and Class B Common Stock by:
•
each person, or group of affiliated persons, known by us to beneficially own more than 5% of our Common Stock;
•
each of our named executive officers;
•
each of our directors; and
•
all of our executive officers and directors as a group.
The numbers of shares of Class A Common Stock and Class B Common Stock (together with the same amount of LLC Units) beneficially owned and percentages of beneficial ownership before this offering that are set forth below are based on the number of shares and LLC Units to be issued and outstanding prior to this offering after giving effect to the Organizational Transactions. See “Organizational Structure.” The numbers of shares of Class A Common Stock and Class B Common Stock (together with the same amount of LLC Units) beneficially owned and percentages of beneficial ownership after the offering that are set forth below are based on shares of Class A Common Stock to be issued and outstanding immediately after the offering, assuming no exercise by the underwriters of their option to purchase additional shares. This number excludes shares of Class A Common Stock issuable in exchange for Series B Common Units and shares of our Class B Common Stock, each as described under “Organizational Structure” and “Certain Relationships and Related Party Transactions—Amended and Restated Operating Agreement of Centinel LLC.” If all outstanding Series B Common Units and Class B Common Stock were exchanged for shares of Class A Common Stock, we would have shares of Class A Common Stock outstanding immediately after this offering.
Concurrently with this offering, we will issue to the Continuing Equity Owners shares of Class B Common Stock. The number of shares of Class B Common Stock will depend in part on the price at which shares of Class A Common Stock are sold in this offering. For purposes of the presentation of the total number of shares of Class B Common Stock beneficially owned, we have assumed that the shares of Class A Common Stock will be sold at $ per share, which is the midpoint of the estimated public offering price range set forth on the cover page of this prospectus.
The number of shares beneficially owned by each stockholder is determined under the SEC rules and includes voting or investment power with respect to securities. Under these rules, beneficial ownership includes any shares as to which the individual or entity has sole or shared voting power or investment power. In computing the number of shares beneficially owned by an individual or entity and the percentage ownership of that person, shares of Class A Common Stock subject to options, warrants, or other rights held by such person that are currently exercisable or will become exercisable within 60 days after , 2026 are considered outstanding, although these shares are not considered outstanding for purposes of computing the percentage ownership of any other person. Unless otherwise indicated, the address of all listed stockholders is c/o Centinel Spine Holdco, Inc., 900 Airport Road, Suite 3B, West Chester, Pennsylvania 19380. Each of the stockholders listed has sole voting and investment power with respect to the shares beneficially owned by the stockholder unless noted otherwise.
218
| | | |
Shares of
Common Stock Beneficially Owned Prior to this Offering(1) |
| |
Shares of
Common Stock Beneficially Owned After this Offering Assuming no Exercise of Underwriters’ Option(1) |
| |
Shares of Common
Stock Beneficially Owned After this Offering Assuming the Underwriters’ Option is Exercised in Full(1) |
| ||||||||||||||||||
|
Name of Beneficial Owner
|
| |
Shares of
Class A Common Stock |
| |
Shares of
Class B Common Stock |
| |
% of
Combined Voting Power(2) (%) |
| |
Shares of
Class A Common Stock |
| |
Shares of
Class B Common Stock |
| |
% of
Combined Voting Power(2) (%) |
| |
Shares of
Class A Common Stock |
| |
Shares of
Class B Common Stock |
| |
% of
Combined Voting Power(2) (%) |
|
| 5% Stockholders: | | | | | | | | | | | | | | | | | | | | | | | | | | | | |
|
AW Alpha Capital LLC
|
| | | | | | | | | | | | | | | | | | | | | | | | | | | |
|
Oman Investment Authority
|
| | | | | | | | | | | | | | | | | | | | | | | | | | | |
|
Viscogliosi Brothers, LLC
|
| | | | | | | | | | | | | | | | | | | | | | | | | | | |
|
Viscogliosi Brothers Venture Partners VI, LLC
|
| | | | | | | | | | | | | | | | | | | | | | | | | | | |
|
Named Executive Officers and Directors:
|
| | | | | | | | | | | | | | | | | | | | | | | | | | | |
|
Steven Murray
|
| | | | | | | | | | | | | | | | | | | | | | | | | | | |
|
Varun Gandhi
|
| | | | | | | | | | | | | | | | | | | | | | | | | | | |
|
Craig Greener
|
| | | | | | | | | | | | | | | | | | | | | | | | | | | |
|
Robert Donohue
|
| | | | | | | | | | | | | | | | | | | | | | | | | | | |
|
Ali Abdullah Al Amri
|
| | | | | | | | | | | | | | | | | | | | | | | | | | | |
|
Dirk Kuyper
|
| | | | | | | | | | | | | | | | | | | | | | | | | | | |
|
Deepankar Panigrahi
|
| | | | | | | | | | | | | | | | | | | | | | | | | | | |
|
Anthony Viscogliosi
|
| | | | | | | | | | | | | | | | | | | | | | | | | | | |
|
Marc Viscogliosi
|
| | | | | | | | | | | | | | | | | | | | | | | | | | | |
|
All executive officers and directors as a group (9 individuals)
|
| | | | | | | | | | | | | | | | | | | | | | | | | | | |
*
Denotes less than 1%.
(1)
The securities “beneficially owned” by a person are determined in accordance with the definition of “beneficial ownership” set forth in the regulations of the SEC and, accordingly, may include securities owned by or for, among others, the spouse, children or certain other relatives of such person as well as other securities as to which the person has or shares voting or investment power. The same shares may be beneficially owned by more than one person. Beneficial ownership may be disclaimed as to certain of the securities. Fractional shares are rounded to the closest whole number.
(2)
Each share of Class A Common Stock and Class B Common Stock entitles the registered holder thereof to one vote on all matters presented to stockholders for a vote generally, including the election of directors. The Class A Common Stock and Class B Common Stock will vote as a single class on all matters, except as required by law or our amended and restated certificate of incorporation.
219
DESCRIPTION OF CAPITAL STOCK
The following description of our capital stock and provisions of our amended and restated certificate of incorporation and amended and restated bylaws as they will be in effect immediately prior to the completion of this offering are summaries and are qualified in their entirety by reference to our amended and restated certificate of incorporation and amended and restated bylaws that will be in effect immediately prior to the completion of this offering, the forms of which are filed as exhibits to the registration statement of which this prospectus forms a part.
General
Prior to the consummation of this offering, we will file our amended and restated certificate of incorporation, and we will adopt our amended and restated by-laws. Our amended and restated certificate of incorporation will authorize capital stock consisting of:
•
shares of Class A Common Stock, par value $0.0001 per share;
•
shares of Class B Common Stock, par value $0.0001 per share; and
•
shares of preferred stock, par value $0.0001 per share.
We are selling shares of Class A Common Stock in this offering (or shares if the underwriters exercise in full their option to purchase additional shares). All shares of our Class A Common Stock outstanding upon consummation of this offering will be fully paid and non-assessable. We are issuing shares of Class B Common Stock to the Continuing Equity Owners simultaneously with this offering. Upon completion of this offering, we expect to have shares of Class A Common Stock outstanding (or shares if the underwriters exercise in full their option to purchase additional shares) and shares of Class B Common Stock outstanding (or shares if the underwriters exercise in full their option to purchase additional shares).
The following summary describes the material provisions of our capital stock and is qualified in its entirety by reference to our amended and restated certificate of incorporation and our amended and restated bylaws, as will be in effect upon completion of this offering, and to the applicable provisions of the Delaware General Corporation Law of the State of Delaware (the “DGCL”). We urge you to read our amended and restated certificate of incorporation and our amended and restated bylaws, which are included as exhibits to the registration statement of which this prospectus forms a part.
Certain provisions of our amended and restated certificate of incorporation and our amended and restated bylaws summarized below may be deemed to have an anti-takeover effect and may delay or prevent a tender offer or takeover attempt that a stockholder might consider in its best interest, including those attempts that might result in a premium over the market price for the shares of Class A Common Stock.
Class A Common Stock
Holders of shares of our Class A common stock are entitled to one vote for each share held of record on all matters submitted to a vote of stockholders. The holders of our Class A common stock do not have cumulative voting rights in the election of directors.
Holders of shares of our Class A common stock will vote together with holders of our Class B common stock as a single class on all matters presented to our stockholders for their vote or approval.
Holders of shares of our Class A common stock are entitled to receive dividends when and if declared by our Board out of funds legally available therefor, subject to any statutory or contractual restrictions on the payment of dividends and to any restrictions on the payment of dividends imposed by the terms of any outstanding preferred stock.
Upon our dissolution or liquidation or the sale of all or substantially all of our assets, after payment in full of all amounts required to be paid to creditors and to the holders of preferred stock having liquidation preferences, if any, the holders of shares of our Class A common stock will be entitled to receive pro rata our remaining assets available for distribution.
220
Holders of shares of our Class A common stock do not have preemptive, subscription, redemption or conversion rights. There will be no redemption or sinking fund provisions applicable to the Class A common stock.
Class B Common Stock
Holders of shares of our Class B common stock are entitled to one vote for each share held of record on all matters submitted to a vote of stockholders. The holders of our Class B common stock do not have cumulative voting rights in the election of directors.
Holders of shares of our Class B common stock will vote together with holders of our Class A common stock as a single class on all matters presented to our stockholders for their vote or approval.
Holders of our Class B common stock do not have any right to receive dividends or to receive a distribution upon dissolution or liquidation or the sale of all or substantially all of our assets. Additionally, holders of shares of our Class B common stock do not have preemptive, subscription, redemption or conversion rights. There will be no redemption or sinking fund provisions applicable to the Class B common stock.
Upon the consummation of this offering, the Continuing Equity Owners will own 100% of our outstanding Class B Common Stock.
Preferred Stock
Upon the consummation of this offering, we will have no shares of preferred stock outstanding, and we have no present plan to issue any shares of preferred stock.
Under the terms of our amended and restated certificate of incorporation that will become effective immediately prior to the consummation of this offering, our board of directors will be authorized to direct us to issue shares of preferred stock in one or more series without stockholder approval. Our board of directors will have the discretion to determine the rights, preferences, privileges and restrictions, including voting rights, dividend rights, conversion rights, redemption privileges and liquidation preferences, of each series of preferred stock.
The purpose of authorizing our Board to issue preferred stock and determine its rights and preferences is to eliminate delays associated with a stockholder vote on specific issuances. The issuance of preferred stock, while providing flexibility in connection with possible acquisitions, future financings and other corporate purposes, could have the effect of making it more difficult for a third party to acquire, or could discourage a third party from seeking to acquire, a majority of our outstanding voting stock. Additionally, the issuance of preferred stock may adversely affect the holders of our Class A common stock by restricting dividends on the Class A common stock, diluting the voting power of the Class A common stock or subordinating the liquidation rights of the Class A common stock. As a result of these or other factors, the issuance of preferred stock could have an adverse impact on the market price of our Class A common stock.
Registration Rights
Upon the completion of this offering, the holders of shares of our Class A Common Stock are entitled to rights with respect to the registration of these securities under the Securities Act. These rights are provided under the terms of the registration rights agreement. The registration rights agreement includes demand registration rights, short-form registration rights and piggyback registration rights. All fees, costs and expenses incurred in connection with registrations under the registration rights agreement will be borne by us, and all expenses related to underwriting discounts and selling commissions will be borne by the holders of the shares being registered.
Demand Registration Rights
One year after the effective date of the registration statement for this offering, the holders of our registrable securities are entitled to demand registration rights. Under the terms of our registration rights agreement, we will be required, upon the request of a holder or holders of at least 25% of our outstanding registrable securities or certain other named holders of our registrable securities, to file a registration statement and use
221
our reasonable best efforts to effect the registration for public resale of these shares and any additional registrable securities requested to be included in such registration by any other holders of our registrable securities. We are required to effect up to four demand registrations under the registration rights agreement.
Piggyback Registration Rights
The holders of our registrable securities are entitled to piggyback registration rights. If we register any of our securities either for our own account or for the account of other security holders, the holders of our outstanding registrable securities are entitled to include their shares in the registration. Subject to certain exceptions contained in the registration rights agreement, we may limit the number of shares included in the underwritten offering if the underwriters determine that marketing factors require a limitation of the number of shares to be underwritten.
Short-form Registration Rights
Upon the completion of this offering, the holders of our registrable securities are also entitled to short-form registration rights. Pursuant to our registration rights agreement, if we are eligible to file a registration statement on Form S-3, upon the request of a holder or holders of at least 25% of our outstanding registrable securities, we will be required to use our reasonable best efforts to effect a registration of such shares, provided that we will not be required to effect any such registration if the holders of registrable securities, together with the holders of any other securities of Centinel Holdco entitled to inclusion in such registration, propose to sell Class A Common Stock and such other securities (if any) at an aggregate price to the public of less than $2,000,000.
Indemnification
Our registration rights agreement contains customary cross-indemnification provisions, under which we are obligated to indemnify holders of registrable securities in the event of material misstatements or omissions in the registration statement attributable to us, and they are obligated to indemnify us for material misstatements or omissions attributable to them.
Expenses of Registration We will pay the registration expenses of the holders of the shares registered pursuant to the demand, piggyback and short-form registration rights described above, including the expenses of one counsel for the selling holders, excluding expenses related to underwriting discounts and selling commissions, which will be borne by the holders of the shares being registered.
Expiration of Registration Rights
Pursuant to the registration rights agreement, shares of Class A Common Stock will be treated as registrable securities if and so long as (i) they have not been sold to or through a broker or dealer or underwriter in a public distribution or a public securities transaction, or (ii) they are not able to be sold freely pursuant to Rule 144(b)(1) promulgated under the Securities Act.
Authorized but Unissued Capital Stock
The DGCL does not require stockholder approval for any issuance of authorized shares. However, the listing requirements of NYSE, which would apply so long as our Class A Common Stock remains listed on the NYSE, require stockholder approval of certain issuances equal to or exceeding 20% of the then outstanding voting power or then outstanding number of shares of Class A Common Stock. These additional shares may be used for a variety of corporate purposes, including future public offerings, to raise additional capital or to facilitate acquisitions.
One of the effects of the existence of unissued and unreserved Common Stock or preferred stock may be to enable our board of directors to issue shares to persons friendly to current management, which issuance could render more difficult or discourage an attempt to obtain control of our company by means of a merger, tender offer, proxy contest or otherwise, and thereby protect the continuity of our management and possibly deprive our stockholders of opportunities to sell their shares of Class A Common Stock at prices higher than prevailing market prices.
222
Anti-Takeover Effects of Provisions of Our Amended and Restated Certificate of Incorporation and Amended and Restated Bylaws and Delaware Law
Certain provisions of our amended and restated certificate of incorporation and amended and restated bylaws that will become effective upon the completion of this offering could have the effect of delaying, deferring or discouraging another party from acquiring control of us. These provisions, which are summarized below, are expected to discourage certain types of coercive takeover practices and inadequate takeover bids and, as a consequence, they might also inhibit temporary fluctuations in the market price of our Class A Common Stock that often result from actual or rumored hostile takeover attempts. These provisions are also designed in part to encourage anyone seeking to acquire control of us to first negotiate with our board of directors. These provisions might also have the effect of preventing changes in our management. It is possible that these provisions could make it more difficult to accomplish transactions that stockholders might otherwise deem to be in their best interests. However, we believe that the advantages gained by protecting our ability to negotiate with any unsolicited and potentially unfriendly acquirer outweigh the disadvantages of discouraging such proposals, including those priced above the then-current market value of our Class A Common Stock, because, among other reasons, the negotiation of such proposals could improve their terms.
Provisions of Our Amended and Restated Certificate of Incorporation and Amended and Restated Bylaws
Our amended and restated certificate of incorporation and amended and restated bylaws to be in effect immediately prior to the completion of this offering will include a number of provisions that may have the effect of delaying, deferring or discouraging another party from acquiring control of us and encouraging persons considering unsolicited tender offers or other unilateral takeover proposals to negotiate with our board of directors rather than pursue non- negotiated takeover attempts. These provisions include the items described below.
Board composition and filling vacancies. Our amended and restated certificate of incorporation will provide that directors may be removed only for cause by the affirmative vote of the holders of at least two-thirds of the shares then entitled to vote at an annual election of directors. Furthermore, any vacancy on our Board, however occurring, including a vacancy resulting from an increase in the size of our board of directors, may be filled by the affirmative vote of a majority of our directors then in office even if less than a quorum.
No written consent of stockholders. Our amended and restated certificate of incorporation will provide that all stockholder actions are required to be taken by a vote of the stockholders at an annual or special meeting, and that stockholders may not take any action by written consent in lieu of a meeting. This limit may lengthen the amount of time required to take stockholder actions and would prevent the amendment of our bylaws or removal of directors by our stockholders without holding a meeting of stockholders.
Meetings of stockholders. Our amended and restated certificate of incorporation will provide that only a majority of the members of our board of directors then in office, the Chair of our board of directors, our chief executive officer or our President may call special meetings of stockholders and only those matters set forth in the notice of the special meeting may be considered or acted upon at a special meeting of stockholders. Our amended and restated certificate of incorporation will limit the business that may be conducted at an annual meeting of stockholders to those matters properly brought before the meeting.
Advance notice requirements. Our amended and restated bylaws will establish advance notice procedures with regard to stockholder proposals relating to the nomination of candidates for election as directors or new business to be brought before meetings of our stockholders. These procedures will provide that notice of stockholder proposals must be timely given in writing to our corporate secretary prior to the meeting at which the action is to be taken. Generally, to be timely, notice must be received at our principal executive offices not less than 90 days or more than 120 days prior to the first anniversary date of the annual meeting for the preceding year. The notice must contain certain information to be specified in our amended and restated bylaws.
Amendment to certificate of incorporation and bylaws. As required by the DGCL, any amendment of our amended and restated certificate of incorporation must first be approved by a majority of our Board, and if required by law or our amended and restated certificate of incorporation, must thereafter be approved by a majority of the outstanding shares entitled to vote on the amendment, and a majority of the outstanding
223
shares of each class entitled to vote thereon as a class, except that the amendment of the provisions relating to rights and powers of our preferred stock and common stock, directors, stockholder action, limitation of liability, indemnification, amendment of bylaws, forum selection and personal jurisdiction, severability, the amendment of our amended and restated certificate of incorporation and the “opt-out” of Section 203 of the DGCL described below must be approved by not less than two-thirds of the outstanding shares entitled to vote on the amendment. Our amended and restated bylaws may be amended by the affirmative vote of a majority vote of the directors then in office, subject to any limitations set forth in the bylaws; and may also be amended by stockholders by the affirmative vote of at least two-thirds of the outstanding shares entitled to vote on the amendment, or, if the board of directors recommends that the stockholders approve the amendment, by the affirmative vote of the majority of the outstanding shares entitled to vote on the amendment, in each case voting together as a single class.
Undesignated preferred stock. Our amended and restated certificate of incorporation will provide for authorized shares of preferred stock. The existence of authorized but unissued shares of preferred stock may enable our Board to render more difficult or to discourage an attempt to obtain control of us by means of a merger, tender offer, proxy contest or otherwise. For example, if in the due exercise of its fiduciary obligations, our board of directors were to determine that a takeover proposal is not in the best interests of us or our stockholders, our board of directors could cause shares of preferred stock to be issued without stockholder approval in one or more private offerings or other transactions that might dilute the voting or other rights of the proposed acquirer or insurgent stockholder or stockholder group. In this regard, our amended and restated certificate of incorporation grants our board of directors broad power to establish the rights and preferences of authorized and unissued shares of preferred stock. The issuance of shares of preferred stock could decrease the amount of earnings and assets available for distribution to holders of shares of our Class A Common Stock. The issuance may also adversely affect the rights and powers, including voting rights, of these holders and may have the effect of delaying, deterring or preventing a change in control of us.
Delaware Takeover Statute
Subject to certain exceptions, Section 203 prevents a publicly held Delaware corporation from engaging in a “business combination” with any “interested stockholder” for three years following the date that the person became an interested stockholder, unless the interested stockholder attained such status with the approval of our Board or unless the business combination is approved in a prescribed manner. A “business combination” includes, among other things, a merger or consolidation involving us and the “interested stockholder” and the sale of more than 10% of our assets. In general, an “interested stockholder” is any entity or person beneficially owning 15% or more of our outstanding voting stock and any entity or person affiliated with or controlling or controlled by such entity or person.
Because we have “opted out” of Section 203 of the DGCL in our amended and restated certificate of incorporation, the statute will not apply to business combinations involving us.
Choice of Forum and Personal Jurisdiction
Our amended and restated certificate of incorporation that will become effective immediately prior to the prior to the completion of this offering will provide that, unless we consent in writing to the selection of an alternative forum, the Court of Chancery of the State of Delaware will be the sole and exclusive forum for any claim by a stockholder for (i) any derivative action or proceeding brought on our behalf, (ii) any action asserting a claim for breach of a fiduciary duty owed by any of our current or former directors, officers, employees, or stockholders to us or our stockholders, (iii) any action arising pursuant to any provision of the DGCL, the amended and restated certificate of incorporation or the amended and restated bylaws, (iv) any action, suit or proceeding asserting a claim against us governed by the internal affairs doctrine; or (v) any action asserting a claim relating to the business of Centinel Holdco, the conduct of our affairs, or the rights or powers of Centinel Holdco or our stockholders, directors, or officers. Further, unless, the U.S. federal district courts will be the exclusive forum for the resolution of any complaint asserting a cause of action arising under the Securities Act. This choice of forum provision would not apply to claims or causes of action brought to enforce a duty or liability created by the Exchange Act.
While the Delaware courts have determined that such choice of forum provisions are facially valid, a stockholder may nevertheless seek to bring a claim in a venue other than those designated in the exclusive
224
forum provisions, and there can be no assurance that such provisions will be enforced by a court in those other jurisdictions. We note that investors cannot waive compliance with the federal securities laws and the rules and regulations thereunder.
Additionally, our amended and restated certificate of incorporation to be effective immediately prior to the closing of this offering will provide that any person or entity holding, owning or otherwise acquiring any interest in any of our securities shall be deemed to have notice of and consented to these provisions.
Limitations of Liability and Indemnification
Upon completion of this offering, our amended and restated certificate of incorporation will provide indemnification for our directors and officers to the fullest extent permitted by the DGCL. Prior to the completion of this offering, we intend to enter into indemnification agreements with each of our directors and officers that may, in some cases, be broader than the specific indemnification provisions contained under Delaware law. In addition, as permitted by Delaware law, our amended and restated certificate of incorporation will include provisions that eliminate the personal liability of our directors and officers for monetary damages resulting from breaches of certain fiduciary duties. The effect of this provision is to restrict our rights and the rights of our stockholders in derivative suits to recover monetary damages against a director or officer for breach of fiduciary duties as a director, except that, under the DGCL as currently in effect, a director will be personally liable for:
•
transaction from which the director or officer derives an improper personal benefit;
•
act or omission not in good faith or that involves intentional misconduct or a knowing violation of law;
•
unlawful payment of dividends or redemption of shares by a director;
•
an officer in any action by or in the right of the corporation; or
•
breach of a director’s or officer’s duty of loyalty to the corporation or its stockholders.
•
These limitations of liability do not apply to liabilities arising under federal securities laws and do
These provisions may be held not to be enforceable for violations of the federal securities laws of the United States.
Dissenters’ Rights of Appraisal and Payment
Under the DGCL, with certain exceptions, our stockholders will have appraisal rights in connection with a merger or consolidation. Pursuant to Section 262 of the DGCL, stockholders who properly demand and perfect appraisal rights in connection with such merger or consolidation will have the right to receive payment of the fair value of their shares as determined by the Delaware Court of Chancery.
Stockholders’ Derivative Actions
Under the DGCL, any of our stockholders may bring an action in our name to procure a judgment in our favor, also known as a derivative action, provided that the stockholder bringing the action is a holder of our shares at the time of the transaction to which the action relates or such stockholder’s stock thereafter devolved by operation of law and such suit is brought in the Court of Chancery in the State of Delaware.
Exchange Listing
Our Common Stock is currently not listed on any securities exchange. We intend to apply to have our Class A Common Stock approved for listing on the NYSE under the symbol “CNTL.”
Transfer Agent and Registrar
Upon the completion of this offering, the transfer agent and registrar for our Class A Common Stock will be .
225
SHARES ELIGIBLE FOR FUTURE SALE
Prior to this offering, there has been no public market for shares of our Class A Common Stock. We cannot predict the effect, if any, that future sales of shares of Class A Common Stock, or the availability for future sale of shares of Class A Common Stock, will have on the market price of shares of our Class A Common Stock prevailing from time to time. The sale of substantial amounts of shares of our Class A Common Stock (including shares of our Class A Common Stock issuable upon exchange of Series B Common Units and Class B Common Stock) in the public market, or the perception that such sales could occur, could harm the prevailing market price of shares of our Class A Common Stock.
Upon the completion of this offering and after giving effect to the other Organizational Transactions, we will have a total of shares of our Class A Common Stock outstanding (or shares of Class A Common Stock if the underwriters exercise in full their option to purchase additional shares of our Class A Common Stock). Of the outstanding shares, of the shares sold in this offering will be freely tradable, except that any shares held by our affiliates, as that term is defined in Rule 144 under the Securities Act, may only be sold in compliance with the limitations described below. The remaining shares of Class A Common Stock (or shares of Class A Common Stock, including shares of Class A Common Stock held by shareholders of the Blocker Companies and shares issuable upon exchange of the Series B Common Units, as described below) will be “restricted securities,” as that term is defined in Rule 144, and may be resold only after registration under the Securities Act or pursuant to an exemption from such registration, including, among others, the exemptions provided by Rule 144 and 701 under the Securities Act, which rules are summarized below. These remaining shares of Class A Common Stock that will be outstanding upon completion of this offering will be available for sale in the public market after the expiration of market stand-off agreements with us and the lock-up agreements described in “Underwriting,” taking into account the provisions of Rules 144 and 701 under the Securities Act.
In addition, pursuant to the Exchange Agreement, the Continuing Equity Owners may from time to time after the consummation of this offering, exchange their Series B Common Units for, at our election, shares of Class A Common Stock on a one-for-one basis or cash, as set forth in the Exchange Agreement. The Continuing Equity Owners will also be required to deliver to us a number of shares of Class B Common Stock equivalent to the number of Series B Common Units being exchanged to effectuate the exchange. Any shares of Class B Common Stock and Series B Common Units so delivered will be cancelled, and Centinel LLC will issue us a number of Series A Common Units equal to the number of cancelled Series B Common Units. Upon consummation of this offering, Continuing Equity Owners will hold Series B Common Units, all of which will be exchangeable for, at our election, shares of our Class A Common Stock or cash, as set forth in the Exchange Agreement. The shares of Class A Common Stock we issue upon such exchanges would be “restricted securities” as defined in Rule 144 unless we register such issuances.
Under the terms of the Amended and Restated Centinel LLC Agreement, except pursuant to a valid exchange under the terms of the Exchange Agreement, all of the LLC Units received by the LLC Unitholders in the Organizational Transactions will be subject to restrictions on disposition.
Rule 144
Affiliate Resales of Restricted Securities
In general, beginning 90 days after the effective date of the registration statement of which this prospectus is a part, a person who is an affiliate of ours, or who was an affiliate at any time during the 90 days before a sale, who has beneficially owned shares of our Class A Common Stock for at least 180 days would be entitled to sell in “broker’s transactions” or certain “riskless principal transactions” or to market makers, a number of shares within any three-month period that does not exceed the greater of:
•
1% of the number of shares of our Class A Common Stock then outstanding; and
•
the average weekly trading volume in our Class A Common Stock on the NYSE during the four calendar weeks preceding the filing of a notice on Form 144 with respect to such sale.
Affiliate resales under Rule 144 are also subject to the availability of current public information about us. In addition, if the number of shares being sold under Rule 144 by an affiliate during any three-month period
226
exceeds 5,000 shares or has an aggregate sale price in excess of $50,000, the seller must file a notice on Form 144 with the SEC and NYSE concurrently with either the placing of a sale order with the broker or the execution directly with a market maker.
Non-Affiliate Resales of Restricted Securities
In general, beginning 90 days after the effective date of the registration statement of which this prospectus is a part, a person who is not an affiliate of ours at the time of sale, and has not been an affiliate at any time during the 90 days preceding a sale, and who has beneficially owned shares of our Class A Common Stock for at least six months but less than a year, is entitled to sell such shares subject only to the availability of current public information about us. If such person has held our shares for at least one year, such person can resell under Rule 144(b)(1) without regard to any Rule 144 restrictions, including the 90-day public company requirement and the current public information requirement.
Non-affiliate resales are not subject to the manner of sale, volume limitation or notice filing provisions of Rule 144.
Rule 701
In general, under Rule 701, any of an issuer’s employees, directors, officers, consultants or advisors who purchases shares from the issuer in connection with a compensatory stock or option plan or other written agreement before the effective date of a registration statement under the Securities Act is entitled to sell such shares 90 days after such effective date in reliance on Rule 144. An affiliate of the issuer can resell shares in reliance on Rule 144 without having to comply with the holding period requirement, and non-affiliates of the issuer can resell shares in reliance on Rule 144 without having to comply with the current public information and holding period requirements.
The SEC has indicated that Rule 701 will apply to typical stock options granted by an issuer before it becomes subject to the reporting requirements of the Exchange Act, along with the shares acquired upon exercise of such options, including exercises after an issuer becomes subject to the reporting requirements of the Exchange Act.
Equity Plan
We intend to file one or more registration statements on Form S-8 under the Securities Act to register the offer and sale of all shares of Class A Common Stock issuable upon exercise of the Assumed Centinel LLC Options and under the Centinel Holdco Omnibus Plan, which will become effective in connection with this offering. We expect to file the registration statement covering shares issuable upon exercise of the Assumed Centinel LLC Options and shares offered pursuant to Centinel Holdco Omnibus Plan shortly after the date of this prospectus, permitting the resale of such shares by non-affiliates in the public market without restriction under the Securities Act and the sale by affiliates in the public market, subject to compliance with the resale provisions of Rule 144.
Lock-Up Agreements
We, along with our directors, executive officers and substantially all of our other stockholders, have agreed with the underwriters that for a period of 180 days (the restricted period), after the date of this prospectus, subject to specified exceptions, we or they will not offer, pledge, sell, contract to sell, sell any option or contract to purchase, purchase any option or contract to sell, grant any option, right or warrant to purchase, lend or otherwise transfer or dispose of, directly or indirectly, any shares of Class A Common Stock or any securities convertible into or exercisable or exchangeable for shares of Class A Common Stock, or enter into any swap or other arrangement that transfers to another, in whole or in part, any of the economic consequences of ownership of the Class A Common Stock.
After this offering, certain of our employees, including our executive officers and/or directors, may enter into written trading plans that are intended to comply with Rule 10b5-1 under the Exchange Act. Sales under these trading plans would not be permitted until the expiration of the lock-up agreements relating to the offering described above.
227
See “Underwriting” for a more complete description of the lock-up agreements that we, substantially all of our stockholders and our directors and executive officers will enter into with the representatives of the underwriters.
Registration Rights
Upon completion of this offering, certain holders of our securities will be entitled to various rights with respect to registration of their shares under the Securities Act. Registration of these shares under the Securities Act would result in these shares becoming fully tradable without restriction under the Securities Act immediately upon the effectiveness of the registration. See the section titled “Description of Capital Stock—Registration Rights” appearing elsewhere in this prospectus for more information.
228
MATERIAL U.S. FEDERAL INCOME TAX CONSEQUENCES TO NON-U.S. HOLDERS
The following discussion is a summary of the material U.S. federal income tax consequences to Non-U.S. Holders (as defined below) of the purchase, ownership and disposition of our Class A Common Stock issued pursuant to this offering, but does not purport to be a complete analysis of all potential tax effects. The effects of other U.S. federal tax laws, such as estate and gift tax laws, and any applicable state, local or non-U.S. tax laws are not discussed. This discussion is based on the U.S. Internal Revenue Code of 1986, as amended (the “Code”), Treasury Regulations promulgated thereunder, judicial decisions, and published rulings and administrative pronouncements of the U.S. Internal Revenue Service (the “IRS”), in each case in effect as of the date hereof. These authorities may change or be subject to differing interpretations. Any such change or differing interpretation may be applied retroactively in a manner that could adversely affect a Non-U.S. Holder of our Class A Common Stock. We have not sought and will not seek any rulings from the IRS regarding the matters discussed below. There can be no assurance the IRS or a court will not take a contrary position to that discussed below regarding the tax consequences of the purchase, ownership and disposition of our Class A Common Stock.
This discussion is limited to Non-U.S. Holders that hold our Class A Common Stock as a “capital asset” within the meaning of Section 1221 of the Code (generally, property held for investment). This discussion does not address all U.S. federal income tax consequences relevant to a Non-U.S. Holder’s particular circumstances, including the alternative minimum tax, the special tax accounting rules in Section 451(b) of the Code, or the impact of the Medicare contribution tax on net investment income. In addition, it does not address consequences relevant to Non-U.S. Holders subject to special rules, including, without limitation:
•
U.S. expatriates and former citizens or long-term residents of the United States;
•
persons holding our Class A Common Stock as part of a hedge, straddle or other risk reduction strategy or as part of a conversion transaction or other integrated investment;
•
banks, insurance companies, and other financial institutions;
•
brokers, dealers or traders in securities;
•
“controlled foreign corporations,” “foreign controlled foreign corporations,” “passive foreign investment companies,” and corporations that accumulate earnings to avoid U.S. federal income tax;
•
partnerships or other entities or arrangements treated as partnerships for U.S. federal income tax purposes (and investors therein);
•
tax-exempt organizations or governmental organizations;
•
persons deemed to sell our Class A Common Stock under the constructive sale provisions of the Code;
•
persons who hold or receive our Class A Common Stock pursuant to the exercise of any employee stock option or otherwise as compensation;
•
tax-qualified retirement plans; and
•
“qualified foreign pension funds” as defined in Section 897(l)(2) of the Code and entities all of the interests of which are held by qualified foreign pension funds.
If an entity treated as a partnership for U.S. federal income tax purposes holds our Class A Common Stock, the tax treatment of an owner in such an entity will depend on the status of the partner, the activities of such entity and certain determinations made at the owner level. Accordingly, entities treated as partnerships holding our Class A Common Stock and the owners in such entities should consult their tax advisors regarding the U.S. federal income tax consequences to them.
229
THIS DISCUSSION IS FOR INFORMATIONAL PURPOSES ONLY AND IS NOT TAX OR LEGAL ADVICE. INVESTORS SHOULD CONSULT THEIR TAX ADVISORS WITH RESPECT TO THE APPLICATION OF THE U.S. FEDERAL INCOME TAX LAWS TO THEIR PARTICULAR SITUATIONS AS WELL AS ANY TAX CONSEQUENCES OF THE PURCHASE, OWNERSHIP AND DISPOSITION OF OUR CLASS A COMMON STOCK ARISING UNDER THE U.S. FEDERAL ESTATE OR GIFT TAX LAWS OR UNDER THE LAWS OF ANY STATE, LOCAL OR NON-U.S. TAXING JURISDICTION OR UNDER ANY APPLICABLE INCOME TAX TREATY.
Definition of a Non-U.S. Holder
For purposes of this discussion, a “Non-U.S. Holder” is any beneficial owner of our Class A Common Stock that is neither a “U.S. person” nor an entity treated as a partnership for U.S. federal income tax purposes. A U.S. person is any person that, for U.S. federal income tax purposes, is or is treated as any of the following:
•
an individual who is a citizen or resident of the United States;
•
a corporation (or entity treated as a corporation for U.S. federal income tax purposes) created or organized under the laws of the United States, any state thereof, or the District of Columbia (or certain corporations organized under jurisdictions outside the United States treated as U.S. corporations);
•
an estate, the income of which is subject to U.S. federal income tax regardless of its source; or
•
a trust that (1) is subject to the primary supervision of a U.S. court and the control of one or more “United States persons” (within the meaning of Section 7701(a)(30) of the Code), or (2) has a valid election in effect to be treated as a United States person for U.S. federal income tax purposes.
Distributions
As described in the section titled “Dividend Policy,” we do not anticipate declaring or paying dividends to holders of our Class A Common Stock in the foreseeable future. However, if we do make distributions of cash or property on our Class A Common Stock, such distributions will constitute dividends for U.S. federal income tax purposes to the extent paid from our current or accumulated earnings and profits, as determined under U.S. federal income tax principles. Amounts not treated as dividends for U.S. federal income tax purposes will constitute a return of capital and first be applied against and reduce a Non-U.S. Holder’s adjusted tax basis in its Class A Common Stock, but not below zero. Any excess will be treated as capital gain and will be treated as described below under “—Sale or Other Taxable Disposition.”
Subject to the discussion below on effectively connected income, dividends paid to a Non-U.S. Holder of our Class A Common Stock will be subject to U.S. federal withholding tax at a rate of 30% of the gross amount of the dividends (or such lower rate specified by an applicable income tax treaty, provided the Non-U.S. Holder furnishes a valid IRS Form W-8BEN or W-8BEN-E (or other applicable documentation) certifying qualification for the lower treaty rate). If a Non-U.S. Holder holds the stock through a financial institution or other intermediary, the Non-U.S. Holder will be required to provide appropriate documentation to the intermediary, which then will be required to provide certification to the applicable withholding agent, either directly or through other intermediaries.
If dividends paid to a Non-U.S. Holder are effectively connected with the Non-U.S. Holder’s conduct of a trade or business within the United States (and, if required by an applicable income tax treaty, the Non-U.S. Holder maintains a permanent establishment in the United States to which such dividends are attributable), the Non-U.S. Holder will be exempt from the U.S. federal withholding tax described above. To claim the exemption, the Non-U.S. Holder must furnish to the applicable withholding agent a valid IRS Form W-8ECI, certifying that the dividends are effectively connected with the Non-U.S. Holder’s conduct of a trade or business within the United States.
Any such effectively connected dividends will be subject to U.S. federal income tax on a net income basis at the regular rates applicable to U.S. persons. A Non-U.S. Holder that is a corporation also may be subject to a branch profits tax at a rate of 30% (or such lower rate specified by an applicable income tax treaty) on such effectively connected dividends, as adjusted for certain items. The certifications described above must be provided to the applicable withholding agent prior to the payment of dividends and must be updated periodically.
230
A Non-U.S. Holder may obtain a refund or credit of any excess amounts withheld by timely filing an appropriate claim for a refund with the IRS. Non-U.S. Holders should consult their tax advisors regarding any applicable tax treaties that may provide for different rules.
Sale or Other Taxable Disposition
Subject to the discussion below under “—Information Reporting and Backup Withholding” and “—Additional Withholding Tax on Payments Made to Foreign Accounts,” a Non-U.S. Holder will not be subject to U.S. federal income tax on any gain realized upon the sale or other taxable disposition of our Class A Common Stock unless:
•
the gain is effectively connected with the Non-U.S. Holder’s conduct of a trade or business within the United States (and, if required by an applicable income tax treaty, the Non-U.S. Holder maintains a permanent establishment in the United States to which such gain is attributable);
•
the Non-U.S. Holder is a non-resident alien individual present in the United States for 183 days or more during the taxable year of the disposition and certain other requirements and conditions are met; or
•
our Class A Common Stock constitutes a U.S. real property interest (“USRPI”) by reason of our status as a U.S. real property holding corporation (“USRPHC”) for U.S. federal income tax purposes, at any time within the shorter of the five-year period preceding the disposition or the Non-U.S. Holder’s holding period for our Class A Common Stock.
Gain described in the first bullet point above generally will be subject to U.S. federal income tax on a net income basis at the regular rates applicable to U.S. persons. A Non-U.S. Holder that is a corporation also may be subject to a branch profits tax at a rate of 30% (or such lower rate specified by an applicable income tax treaty) on such effectively connected gain, as adjusted for certain items.
A Non-U.S. Holder described in the second bullet point above will be subject to U.S. federal income tax on the net gain derived from the disposition at a rate of 30% (or such lower rate specified by an applicable income tax treaty), which may be offset by U.S. source capital losses of the Non-U.S. Holder (even though the individual is not considered a resident of the United States), provided the Non-U.S. Holder has timely filed U.S. federal income tax returns with respect to such losses.
With respect to the third bullet point above, we will be classified as a USRPHC if the fair market value of our United States real property interests equals or exceeds 50% of the sum of the fair market value of our worldwide real property interests plus our other assets used or held for use in a trade or business, as determined for U.S. federal income tax purposes. We believe we currently are not, and do not anticipate becoming, a USRPHC. Because the determination of whether we are a USRPHC depends, however, on the fair market value of our USRPIs relative to the sum of the fair market value of our non-U.S. real property interests and our other business assets, there can be no assurance we currently are not a USRPHC or will not become one in the future. Even if we are or were to become a USRPHC, gain arising from the sale or other taxable disposition by a Non-U.S. Holder of our Class A Common Stock will not be subject to U.S. federal income tax if our Class A Common Stock is “regularly traded,” as defined by applicable Treasury Regulations, on an “established securities market,” and such Non-U.S. Holder owned, actually and constructively, 5% or less of our Class A Common Stock throughout the shorter of the five-year period ending on the date of the sale or other taxable disposition or the Non-U.S. Holder’s holding period (or such applicable period specified in the Code). If we were to become a USRPHC and our Class A Common Stock were not considered to be regularly traded on an established securities market during the calendar year in which the relevant disposition by a Non-U.S. Holder occurs, such Non-U.S. Holder (regardless of the percentage of stock owned) would be subject to U.S. federal income tax on a sale or other taxable disposition of our Class A Common Stock and a 15% withholding tax would apply to the gross proceeds from such disposition.
No assurance can be provided that our Class A Common Stock will be regularly traded on an established securities market for purposes of the rule described above.
Non-U.S. Holders should consult their tax advisors regarding the application of these rules and regarding potentially applicable income tax treaties that may provide for different rules.
231
Information Reporting and Backup Withholding
Payments of distributions on our Class A Common Stock will not be subject to backup withholding, provided the applicable withholding agent does not have actual knowledge or reason to know the holder is a United States person and the holder either certifies its non-U.S. status, such as by furnishing a valid IRS Form W-8BEN, W-8BEN-E or W-8ECI, or otherwise establishes an exemption. However, information returns are required to be filed with the IRS in connection with any distributions on our Class A Common Stock paid to the Non-U.S. Holder, regardless of whether such distributions constitute dividends or whether any tax was actually withheld. In addition, proceeds of the sale or other taxable disposition of our Class A Common Stock within the United States or conducted through certain U.S.-related brokers generally will not be subject to backup withholding or information reporting, if the applicable withholding agent receives the certification described above and does not have actual knowledge or reason to know that such holder is a United States person, or the holder otherwise establishes an exemption. Proceeds of a disposition of our Class A Common Stock conducted through a non-U.S. office of a non-U.S. broker generally will not be subject to backup withholding or information reporting.
Copies of information returns that are filed with the IRS may also be made available under the provisions of an applicable treaty or agreement to the tax authorities of the country in which the Non-U.S. Holder resides or is established.
Backup withholding is not an additional tax. Any amounts withheld under the backup withholding rules may be allowed as a refund or a credit against a Non-U.S. Holder’s U.S. federal income tax liability, provided the required information is timely furnished to the IRS.
Additional Withholding Tax on Payments Made to Foreign Accounts
Withholding taxes may be imposed under Sections 1471 to 1474 of the Code (such provisions of the Code are commonly referred to as the Foreign Account Tax Compliance Act (“FATCA”)) on certain types of payments made to non-U.S. financial institutions and certain other non-U.S. entities. Specifically, a 30% withholding tax may be imposed on dividends on, or (subject to the proposed Treasury Regulations discussed below) gross proceeds from the sale or other disposition of, our Class A Common Stock, in each case, paid to a “foreign financial institution” or a “non-financial foreign entity” (each as defined in the Code), unless (i) the foreign financial institution undertakes certain diligence and reporting obligations (including, among other things, providing sufficient documentation evidencing its compliance (or deemed compliance) with FATCA), (ii) the non-financial foreign entity either certifies it does not have any “substantial United States owners” (as defined in the Code) or furnishes identifying information regarding each substantial United States owner, or (iii) the foreign financial institution or non-financial foreign entity otherwise qualifies for an exemption from these rules. If the payee is a foreign financial institution and is subject to the diligence and reporting requirements in clause (i) above, it must enter into an agreement with the U.S. Department of the Treasury requiring, among other things, that it undertake to identify accounts held by certain “specified United States persons” or “United States owned foreign entities” (each as defined in the Code), annually report certain information about such accounts, and withhold 30% on certain payments to non-compliant foreign financial institutions and certain other account holders. Foreign financial institutions located in jurisdictions that have an intergovernmental agreement with the United States governing FATCA may be subject to different rules.
Under the applicable Treasury Regulations and administrative guidance, withholding under FATCA generally applies to payments of dividends on our Class A Common Stock. While withholding under FATCA would have applied also to payments of gross proceeds from the sale or other disposition of such stock, proposed Treasury Regulations eliminate FATCA withholding on payments of gross proceeds entirely. The preamble to the proposed Treasury Regulations provide that taxpayers generally may rely on these proposed Treasury Regulations until final Treasury Regulations are issued. Prospective investors should consult their tax advisors regarding the potential application of withholding under FATCA to their investment in our Class A Common Stock.
232
UNDERWRITING
Under the terms and subject to the conditions in an underwriting agreement dated the date of this prospectus, the underwriters named below, for whom Morgan Stanley & Co. LLC, Goldman Sachs & Co. LLC and Piper Sandler & Co. are acting as representatives, have severally agreed to purchase, and we have agreed to sell to them, severally, the number of shares indicated below:
|
Name
|
| |
Number of Shares
|
|
|
Morgan Stanley & Co. LLC
|
| | | |
|
Goldman Sachs & Co. LLC
|
| | | |
|
Piper Sandler & Co.
|
| | | |
|
Canaccord Genuity LLC
|
| | | |
|
BTIG, LLC
|
| | | |
|
Total:
|
| | | |
The underwriters and the representatives are collectively referred to as the “underwriters” and the “representatives,” respectively. The underwriters are offering the shares of Class A Common Stock subject to their acceptance of the shares from us and subject to prior sale. The underwriting agreement provides that the obligations of the several underwriters to pay for and accept delivery of the shares of Class A Common Stock offered by this prospectus are subject to the approval of certain legal matters by their counsel and to certain other conditions. The underwriters are obligated to take and pay for all of the shares of Class A Common Stock offered by this prospectus if any such shares are taken.
However, the underwriters are not required to take or pay for the shares covered by the underwriters’ over-allotment option described below. The underwriters initially propose to offer part of the shares of Class A Common Stock directly to the public at the offering price listed on the cover page of this prospectus and part to certain dealers at a price that represents a concession not in excess of $ per share under the public offering price. After the initial offering of the shares of Class A Common Stock, the offering price and other selling terms may from time to time be varied by the representatives.
We have granted to the underwriters an option, exercisable for 30 days from the date of this prospectus, to purchase up to additional shares of Class A Common Stock at the public offering price listed on the cover page of this prospectus, less underwriting discounts and commissions.
The underwriters may exercise this option solely for the purpose of covering over-allotments, if any, made in connection with the offering of the shares of Class A Common Stock offered by this prospectus. To the extent the option is exercised, each underwriter will become obligated, subject to certain conditions, to purchase about the same percentage of the additional shares of Class A Common Stock as the number listed next to the underwriter’s name in the preceding table bears to the total number of shares of Class A Common Stock listed next to the names of all underwriters in the preceding table.
The following table shows the per share and total public offering price, underwriting discounts and commissions, and proceeds before expenses to us. These amounts are shown assuming both no exercise and full exercise of the underwriters’ option to purchase up to an additional shares of Class A Common Stock.
| | | | | | |
Total
|
| ||||||||||||
| | | |
Per Share
|
| |
No Exercise
|
| |
Full Exercise
|
| |||||||||
|
Public offering price
|
| | | $ | | | | | $ | | | | | $ | | | |||
|
Underwriting discounts and commissions to be paid by us
|
| | | $ | | | | | $ | | | | | $ | | | |||
|
Proceeds, before expenses, to us
|
| | | $ | | | | | $ | | | | | $ | | | | ||
The estimated offering expenses payable by us, exclusive of the underwriting discounts and commissions, are approximately $ . We have agreed to reimburse the underwriters for expenses relating to clearance of this offering with the Financial Industry Regulatory Authority up to $ .
233
The underwriters have informed us that they do not intend sales to discretionary accounts to exceed 5% of the total number of shares of Class A Common Stock offered by them.
We intend to apply to list our shares of Class A Common Stock on the NYSE under the trading symbol “CNTL.”
We and all directors and officers and the holders of all of our outstanding stock and stock options are expected to agree that, without the prior written consent of Morgan Stanley & Co. LLC, Goldman Sachs & Co. LLC and Piper Sandler & Co. on behalf of the underwriters, we and they will not, and will not publicly disclose an intention to, during the period ending 180 days after the date of this prospectus (the “restricted period”):
•
offer, pledge, sell, contract to sell, sell any option or contract to purchase, purchase any option or contract to sell, grant any option, right or warrant to purchase, lend or otherwise transfer or dispose of, directly or indirectly, any shares of Class A Common Stock or any securities convertible into or exercisable or exchangeable for shares of Class A Common Stock;
•
file any registration statement with the Securities and Exchange Commission relating to the offering of any shares of Class A Common Stock or any securities convertible into or exercisable or exchangeable for Class A Common Stock; or
•
enter into any swap or other arrangement that transfers to another, in whole or in part, any of the economic consequences of ownership of the Class A Common Stock.
whether any such transaction described above is to be settled by delivery of Class A Common Stock or such other securities, in cash or otherwise. In addition, we and each such person agrees that, without the prior written consent of Morgan Stanley & Co. LLC, Goldman Sachs & Co. LLC and Piper Sandler & Co., on behalf of the underwriters, we or such other person will not, during the restricted period, make any demand for, or exercise any right with respect to, the registration of any shares of Class A Common Stock or any security convertible into or exercisable or exchangeable for Class A Common Stock.
The restrictions described in the immediately preceding paragraph do not apply to:
•
the sale of shares to the underwriters; or
•
the issuance by the Company of shares of Class A Common Stock upon the exercise of an option or a warrant or the conversion of a security outstanding on the date of this prospectus of which the underwriters have been advised in writing;
•
transactions by any person other than us relating to shares of Class A Common Stock or other securities acquired in open market transactions after the completion of the offering of the shares; provided that no filing under Section 16(a) of the Securities Exchange Act of 1934, as amended (the “Exchange Act”), is required or voluntarily made in connection with subsequent sales of the Class A Common Stock or other securities acquired in such open market transactions; or
•
facilitating the establishment of a trading plan on behalf of a shareholder, officer or director of the Company pursuant to Rule 10b5-1 under the Exchange Act for the transfer of shares of Class A Common Stock, provided that (i) such plan does not provide for the transfer of Class A Common Stock during the restricted period and (ii) to the extent a public announcement or filing under the Exchange Act, if any, is required of or voluntarily made by the Company regarding the establishment of such plan, such announcement or filing shall include a statement to the effect that no transfer of Class A Common Stock may be made under such plan during the restricted period.
Morgan Stanley & Co. LLC, Goldman Sachs & Co. LLC and Piper Sandler & Co., in their sole discretion, may release the Class A Common Stock and other securities subject to the lock-up agreements described above in whole or in part at any time.
In order to facilitate the offering of the Class A Common Stock, the underwriters may engage in transactions that stabilize, maintain or otherwise affect the price of the Class A Common Stock. Specifically, the underwriters may sell more shares than they are obligated to purchase under the underwriting agreement, creating a short position. A short sale is covered if the short position is no greater than the number of shares available for purchase by the underwriters under the over-allotment option. The underwriters can close out a
234
covered short sale by exercising the over-allotment option or purchasing shares in the open market. In determining the source of shares to close out a covered short sale, the underwriters will consider, among other things, the open market price of shares compared to the price available under the over-allotment option. The underwriters may also sell shares in excess of the over-allotment option, creating a naked short position. The underwriters must close out any naked short position by purchasing shares in the open market. A naked short position is more likely to be created if the underwriters are concerned that there may be downward pressure on the price of the Class A Common Stock in the open market after pricing that could adversely affect investors who purchase in this offering. As an additional means of facilitating this offering, the underwriters may bid for, and purchase, shares of Class A Common Stock in the open market to stabilize the price of the Class A Common Stock. These activities may raise or maintain the market price of the Class A Common Stock above independent market levels or prevent or retard a decline in the market price of the Class A Common Stock. The underwriters are not required to engage in these activities and may end any of these activities at any time.
We and the underwriters have agreed to indemnify each other against certain liabilities, including liabilities under the Securities Act.
A prospectus in electronic format may be made available on websites maintained by one or more underwriters, or selling group members, if any, participating in this offering. The representatives may agree to allocate a number of shares of Class A Common Stock to underwriters for sale to their online brokerage account holders. Internet distributions will be allocated by the representatives to underwriters that may make Internet distributions on the same basis as other allocations.
Other Relationships
The underwriters and their respective affiliates are full service financial institutions engaged in various activities, which may include securities trading, commercial and investment banking, financial advisory, investment management, investment research, principal investment, hedging, financing and brokerage activities. Certain of the underwriters and their respective affiliates have, from time to time, performed, and may in the future perform, various financial advisory and investment banking services for us or our affiliates, for which they received or will receive customary fees and expenses.
In addition, in the ordinary course of their various business activities, the underwriters and their respective affiliates may make or hold a broad array of investments and actively trade debt and equity securities (or related derivative securities) and financial instruments (including bank loans) for their own account and for the accounts of their customers and may at any time hold long and short positions in such securities and instruments. Such investment and securities activities may involve our securities and instruments. The underwriters and their respective affiliates may also make investment recommendations or publish or express independent research views in respect of such securities or instruments and may at any time hold, or recommend to clients that they acquire, long or short positions in such securities and instruments.
Pricing of the Offering
Prior to this offering, there has been no public market for our Class A Common Stock. The initial public offering price was determined by negotiations between us and the representatives. Among the factors considered in determining the initial public offering price were our future prospects and those of our industry in general, our sales, earnings and certain other financial and operating information in recent periods, and the price-earnings ratios, price-sales ratios, market prices of securities, and certain financial and operating information of companies engaged in activities similar to ours.
Selling Restrictions
European Economic Area
In relation to each Member State of the European Economic Area (each, a “Relevant State”), no shares have been offered or will be offered pursuant to the offering to the public in that Relevant State prior to the publication of a prospectus in relation to the shares which has been approved by the competent authority in that Relevant State or, where appropriate, approved in another Relevant State and notified to the competent
235
authority in that Relevant State, all in accordance with the Prospectus Regulation, except that offers of shares may be made to the public in that Relevant State at any time:
(a)
to any qualified investor as defined under Article 2 of the Prospectus Regulation;
(b)
to fewer than 150 natural or legal persons (other than qualified investors as defined under Article 2 of the Prospectus Regulation), subject to obtaining the prior consent of the representatives for any such offer; or
(c)
in any other circumstances falling within Article 1(4) of the Prospectus Regulation,
provided that no such offer of shares shall require us or any of our representatives to publish a prospectus pursuant to Article 3 of the Prospectus Regulation, supplement a prospectus pursuant to Article 23 of the Prospectus Regulation or publish an Annex IX document pursuant to Article 1(4) of the Prospectus Regulation.
For the purposes of this provision, the expression an “offer to the public” in relation to any shares in any Relevant State means the communication in any form and by any means of sufficient information on the terms of the offer and any shares to be offered so as to enable an investor to decide to purchase any shares, and the expression “Prospectus Regulation” means Regulation (EU) 2017/1129.
United Kingdom
No shares have been offered or will be offered pursuant to the offering to the public in the United Kingdom except that the shares may be offered to the public in the United Kingdom at any time:
(a)
where the offer is conditional on the admission of the shares to trading on the London Stock Exchange plc’s main market (in reliance on the exception in paragraph 6(a) of Schedule 1 of the POATR);
(b)
to any qualified investor as defined under paragraph 15 of Schedule 1 of the POATR;
(c)
to fewer than 150 persons (other than qualified investors as defined under paragraph 15 of Schedule 1 of the POATR), subject to obtaining the prior consent of the representatives for any such offer; or
(d)
in any other circumstances falling within Part 1 of Schedule 1 of the POATR.
For the purposes of this provision, the expression an “offer to the public” in relation to the shares in the United Kingdom means the communication to any person which presents sufficient information on: (a) the shares to be offered; and (b) the terms on which they are to be offered, to enable an investor to decide to buy or subscribe for the shares and the expressions “POATR” means the Public Offers and Admissions to Trading Regulations 2024.
Hong Kong
The shares of Class A Common Stock have not been offered or sold and will not be offered or sold in Hong Kong, by means of any document, other than (a) to “professional investors” as defined in the Securities and Futures Ordinance (Cap. 571) of Hong Kong and any rules made under that Ordinance or (b) in other circumstances which do not result in the document being a “prospectus” as defined in the Companies Ordinance (Cap. 32) of Hong Kong or which do not constitute an offer to the public within the meaning of that Ordinance. No advertisement, invitation or document relating to the shares of Class A Common Stock has been or may be issued or has been or may be in the possession of any person for the purposes of issue, whether in Hong Kong or elsewhere, which is directed at, or the contents of which are likely to be accessed or read by, the public of Hong Kong (except if permitted to do so under the securities laws of Hong Kong) other than with respect to shares of Class A Common Stock which are or are intended to be disposed of only to persons outside Hong Kong or only to “professional investors” as defined in the Securities and Futures Ordinance and any rules made under that Ordinance.
Japan
The shares of Class A Common Stock have not been and will not be registered under the Financial Instruments and Exchange Law of Japan (Law No. 25 of 1948, as amended) and, accordingly, will not be offered or sold,
236
directly or indirectly, in Japan, or for the benefit of any Japanese Person (as defined below) or to others for re-offering or resale, directly or indirectly, in Japan or to any Japanese Person, except in compliance with all applicable laws, regulations and ministerial guidelines promulgated by relevant Japanese governmental or regulatory authorities in effect at the relevant time. For the purposes of this paragraph, “Japanese Person” means any person resident in Japan, including any corporation or other entity organized under the laws of Japan.
Singapore
This prospectus has not been registered as a prospectus with the Monetary Authority of Singapore. Accordingly, the shares of Class A Common Stock were not offered or sold or caused to be made the subject of an invitation for subscription or purchase and will not be offered or sold or caused to be made the subject of an invitation for subscription or purchase, and this prospectus or any other document or material in connection with the offer or sale, or invitation for subscription or purchase, of the shares of Class A Common Stock, has not been circulated or distributed, nor will it be circulated or distributed, whether directly or indirectly, to any person in Singapore other than (i) to an institutional investor (as defined in Section 4A of the Securities and Futures Act (Chapter 289) of Singapore (as modified or amended from time to time, the SFA)) pursuant to Section 274 of the SFA, (ii) to a relevant person (as defined in Section 275(2) of the SFA) pursuant to Section 275(1) of the SFA, or any person pursuant to Section 275(1A) of the SFA, and in accordance with the conditions specified in Section 275 of the SFA, or (iii) otherwise pursuant to, and in accordance with the conditions of, any other applicable provision of the SFA.
Where the shares of Class A Common Stock are subscribed or purchased under Section 275 of the SFA by a relevant person which is:
(a)
a corporation (which is not an accredited investor (as defined in Section 4A of the SFA)) the sole business of which is to hold investments and the entire share capital of which is owned by one or more individuals, each of whom is an accredited investor; or
(b)
a trust (where the trustee is not an accredited investor) whose sole purpose is to hold investments and each beneficiary of the trust is an individual who is an accredited investor;
securities or securities-based derivatives contracts (each term as defined in Section 2(1) of the SFA) of that corporation or the beneficiaries’ rights and interest (howsoever described) in that trust shall not be transferred within six months after that corporation or that trust has acquired the securities pursuant to an offer made under Section 275 of the SFA except:
(a)
to an institutional investor or to a relevant person, or to any person arising from an offer referred to in Section 275(1A) or Section 276(4)(i)(B) of the SFA;
(b)
where no consideration is or will be given for the transfer;
(c)
where the transfer is by operation of law; or
(d)
as specified in Section 276(7) of the SFA.
Switzerland
The shares may not be publicly offered in Switzerland and will not be listed on the SIX Swiss Exchange (the SIX) or on any other stock exchange or regulated trading facility in Switzerland. This prospectus has been prepared without regard to the disclosure standards for issuance prospectuses under art. 652a or art. 1156 of the Swiss Code of Obligations or the disclosure standards for listing prospectuses under art. 27 ff. of the SIX Listing Rules or the listing rules of any other stock exchange or regulated trading facility in Switzerland. Neither this prospectus nor any other offering or marketing material relating to the shares or the offering may be publicly distributed or otherwise made publicly available in Switzerland.
Neither this prospectus nor any other offering or marketing material relating to us, the offering, or the shares have been or will be filed with or approved by any Swiss regulatory authority. In particular, this prospectus will not be filed with, and the offering of shares will not be supervised by, the Swiss Financial Market Supervisory Authority FINMA, and the offering of shares has not been and will not be authorized under the
237
Swiss Federal Act on Collective Investment Schemes (the CISA). The investor protection afforded to acquirers of interests in collective investment schemes under the CISA does not extend to acquirers of the shares.
Australia
No placement document, prospectus, product disclosure statement or other disclosure document has been lodged with the Australian Securities and Investments Commission, in relation to the offering. This prospectus does not constitute a prospectus, product disclosure statement or other disclosure document under the Corporations Act 2001 (the Corporations Act), and does not purport to include the information required for a prospectus, product disclosure statement or other disclosure document under the Corporations Act.
Any offer in Australia of the shares may only be made to persons (Exempt Investors) who are “sophisticated investors” (within the meaning of section 708(8) of the Corporations Act), “professional investors” (within the meaning of section 708(11) of the Corporations Act) or otherwise pursuant to one or more exemptions contained in section 708 of the Corporations Act so that it is lawful to offer the shares without disclosure to investors under Chapter 6D of the Corporations Act.
The shares applied for by Exempt Investors in Australia must not be offered for sale in Australia in the period of 12 months after the date of allotment under the offering, except in circumstances where disclosure to investors under Chapter 6D of the Corporations Act would not be required pursuant to an exemption under section 708 of the Corporations Act or otherwise or where the offer is pursuant to a disclosure document which complies with Chapter 6D of the Corporations Act. Any person acquiring the shares must observe such Australian on-sale restrictions.
This prospectus contains general information only and does not take account of the investment objectives, financial situation or particular needs of any particular person. It does not contain any securities recommendations or financial product advice. Before making an investment decision, investors need to consider whether the information in this prospectus is appropriate to their needs, objectives and circumstances, and, if necessary, seek expert advice on those matters.
Brazil
The offer and sale of the shares have not been and will not be registered with the Brazilian Securities Commission (Comissão de Valores Mobiliários, or CVM) and, therefore, will not be carried out by any means that would constitute a public offering in Brazil under CVM Resolution No. 160, Dated 13 July 2022, as amended, or CVM Resolution 160, or unauthorized distribution under Brazilian laws and regulations. The shares will be authorized for trading on organized non-Brazilian securities markets and may only be offered to Brazilian Professional Investors (as defined by applicable CVM regulation), who may only acquire the shares through a non-Brazilian account, with settlement outside Brazil in non-Brazilian currency. The trading of these shares on regulation securities markets in Brazil is prohibited.
Canada
The shares may be sold only to purchasers purchasing, or deemed to be purchasing, as principal that are accredited investors, as defined in National Instrument 45-106 Prospectus Exemptions, and are permitted clients, as defined in National Instrument 31-103 Registration Requirements, Exemptions and Ongoing Registrant Obligations. Any resale of the shares must be made in accordance with an exemption from, or in a transaction not subject to, the prospectus requirements of applicable securities laws.
Securities legislation in certain provinces or territories of Canada may provide a purchaser with remedies for rescission or damages if this prospectus (including any amendment thereto) contains a misrepresentation, provided that the remedies for rescission or damages are exercised by the purchaser within the time limit prescribed by the securities legislation of the purchaser’s province or territory. The purchaser should refer to any applicable provisions of the securities legislation of the purchaser’s province or territory for particulars of these rights or consult with a legal advisor.
Pursuant to section 3A.3 (or, in the case of securities issued or guaranteed by the government of a non-Canadian jurisdiction, section 3A.4) of National Instrument 33-105 Underwriting Conflicts (NI 33-105), the
238
underwriters are not required to comply with the disclosure requirements of NI 33-105 regarding underwriter conflicts of interest in connection with this offering.
France
This prospectus has only been prepared in the context of a public offering in France pursuant to an exemption under Article L. 411-2 1° of the French Monetary and Financial Code (Code monétaire et financier) and the Prospectus Regulation and therefore this prospectus has not been approved by, registered or filed with the Autorité des Marchés Financiers (the “AMF”). Therefore, the Shares may not be, directly or indirectly, offered or caused to be offered or sold to the public in France (offre au public de titres financiers) other than to a limited number of investors acting for their own account (cercle restreint d’investisseurs agissant pour compte propre) in accordance with Articles L.411-2 and D.411-4 of the French Monetary and Financial Code (Code monétaire et financier) or to qualified investors (investisseurs qualifiés) within the meaning of Article 2(e) of the Prospectus Regulation and Article L.411-2 of the French Monetary and Financial Code.
This prospectus and any other offering or marketing material or information relating to the Shares has not been and will not be released, issued or distributed or caused to be released, issued or distributed, directly or indirectly, to the public in France or used in connection with any offer for subscription or sales of the Shares to the public in France other than pursuant to an exemption under the Prospectus Regulation. Offers, sales and distributions have only been and shall only be made in France to a limited number of investors acting for their own account or qualified investors in accordance with Articles L.411-1, L.411-2, L.762-1, D.411-4, D.754- 1, D.764-1 of the French Monetary and Financial Code and applicable regulations thereunder.
Israel
The shares offered by this document have not been approved or disapproved by the Israel Securities Authority (the “ISA”), nor have such shares been registered for sale in Israel. The shares may not be offered or sold, directly or indirectly, to the public in Israel, absent the publication of a prospectus that has been approved by the ISA. The ISA has not issued permits, approvals or licenses in connection with this offering or publishing this document, nor has it authenticated the details included herein, confirmed their reliability or completeness, or rendered an opinion as to the quality of the shares being offered.
This document does not constitute a prospectus under the Israeli Securities Law, 5728-1968 (the “Israeli Securities Law”), and has not been filed with or approved by the ISA. In Israel, this prospectus is being distributed only to, and is directed only at, and any offer of the shares is directed only at, (i) a limited number of persons in accordance with the Israeli Securities Law and (ii) investors listed in the first addendum (the “Addendum”) to the Israeli Securities Law, consisting primarily of joint investment in trust funds, provident funds, insurance companies, banks, portfolio managers, investment advisors, members of the Tel Aviv Stock Exchange, underwriters, venture capital funds, entities with equity in excess of NIS 50 million and “qualified individuals,” each as defined in the Addendum (as it may be amended from time to time), collectively referred to as qualified investors (in each case, purchasing for their own account or, where permitted under the Addendum, for the accounts of their clients who are investors listed in the Addendum). Qualified investors are required to submit written confirmation that they fall within the scope of the Addendum, are aware of the meaning of same and agree to it.
United Arab Emirates (excluding the ADGM and the DIFC)
This prospectus is strictly private and confidential and is being distributed to a limited number of Professional Investors, within the meaning of the United Arab Emirates (the “UAE”) Securities and Commodities Authority’s (the “SCA”) Board of Directors Decision No. (13/Chairman) of 2021 on the Regulations Manual of the Financial Activities and Status Regularization Mechanisms Rule Book (as amended), and must not be provided to any person other than the original recipient, and may not be reproduced or used for any other purpose. If you are in any doubt about the contents of this prospectus, you should consult an authorized financial adviser.
By receiving this prospectus, the person or entity to whom it has been issued understands, acknowledges and agrees that this prospectus has not been approved by or filed with the UAE Central Bank, the SCA or any other authorities in the UAE, nor have the underwriters received authorization or licensing from the UAE
239
Central Bank, the SCA or any other authorities in the UAE to market or sell securities or other investments within the UAE. No marketing of any financial products or services has been or will be made from within the UAE other than in compliance with the laws of the UAE and no subscription to any securities or other investments may or will be consummated within the UAE. It should not be assumed that any of the underwriters is a licensed broker, dealer or investment adviser under the laws applicable in the UAE, or that any of them advise individuals resident in the UAE as to the appropriateness of investing in or purchasing or selling securities or other financial products. The shares of common stock offered pursuant to this prospectus may not be offered or sold directly or indirectly to the public in the UAE and do not constitute a public offer of securities in the UAE in accordance with Federal Decree No. 32 of 2021 on Commercial Companies (as amended) or otherwise.
Abu Dhabi Global Market (“ADGM”)
This prospectus relates to an exempt offer which is not subject to any form of regulation or approval by the Financial Services Regulatory Authority (the “FSRA”). The FSRA has not approved this prospectus nor has any responsibility for reviewing or verifying any document or other documents in connection with the offering. Accordingly, the FSRA has not approved this prospectus or any other associated documents nor taken any steps to verify the information set out in this prospectus, and has no responsibility for it.
The shares of common stock have not been offered and will not be offered to any persons in the ADGM except on the basis that an offer is:
(i)
an “Exempt Offer” in accordance with the ADGM Financial Services and Markets Regulations 2015, as amended (the “FSMR”) and the Markets Rules of the FSRA; and
(ii)
made only to persons who are “Authorised Persons” or “Recognised Bodies” (as such terms are defined in the FSMR) or persons to whom an invitation or inducement to engage in investment activity (within the meaning of section 18 of the FSMR) in connection with the issue or sale of any securities may otherwise lawfully be communicated or caused to be communicated.
Dubai International Financial Centre (“DIFC”)
This prospectus relates to an exempt offer which is not subject to any form of regulation or approval by the Dubai Financial Services Authority (the “DFSA”). The DFSA has not approved this prospectus nor has any responsibility for reviewing or verifying any document or other documents in connection with the offering. Accordingly, the DFSA has not approved this prospectus or any other associated documents nor taken any steps to verify the information set out in this prospectus, and has no responsibility for it.
The shares of common stock have not been offered and will not be offered to any persons in the DIFC except on the basis that an offer is:
(i)
an “Exempt Offer” in accordance with the Markets Rules (MKT) Module of the DFSA Rulebook; and
(ii)
made only to persons who meet the “Deemed Professional Client” criteria set out in Rule 2.3.4 of the Conduct of Business (COB) module of the DFSA Rulebook, who are not natural persons.
240
LEGAL MATTERS
The validity of the issuance of our Class A Common Stock offered in this prospectus will be passed upon for us by Blank Rome LLP and for the underwriters by Latham & Watkins LLP.
EXPERTS
The financial statements of Centinel Spine Holdco, Inc. as of April 24, 2026 and the consolidated financial statements of Centinel Spine, LLC and subsidiaries as of December 31, 2025 and 2024, and for each of the two years in the period ended December 31, 2025, appearing in this prospectus and Registration Statement have been audited by Ernst & Young LLP, independent registered public accounting firm, as set forth in their reports thereon appearing elsewhere herein, and are included in reliance upon such reports given on their authority of such firm as experts in accounting and auditing.
WHERE YOU CAN FIND ADDITIONAL INFORMATION
We have filed with the SEC a registration statement on Form S-1 under the Securities Act with respect to the shares of Class A Common Stock offered by this prospectus. This prospectus does not contain all of the information included in the registration statement. For further information pertaining to us and our Class A Common Stock and other securities, you should refer to the registration statement and to its exhibits. Statements contained in this prospectus regarding the contents of any contract or any other document that is filed as an exhibit to the registration statement are not necessarily complete, and each such statement is qualified in all respects by reference to the full text of such contract or other document filed as an exhibit to the registration statement.
Upon the closing of this offering, we will be subject to the informational requirements of the Exchange Act and will file annual, quarterly and current reports, proxy statements and other information with the SEC. You can read our SEC filings, including the registration statement, at the SEC’s website at www.sec.gov. We also maintain a website at www.centinelspine.com. Upon completion of the offering, you may access, free of charge, our annual reports on Form 10-K, quarterly reports on Form 10-Q, current reports on Form 8-K and amendment to those reports filed or furnished pursuant to Section 13(a) or 15(d) of the Exchange Act as soon as reasonably practicable after such material is electronically filed with, or furnished to, the SEC. Information contained on our website is not a part of this prospectus and the inclusion of our website address in this prospectus is an inactive textual reference only.
241
INDEX TO FINANCIAL STATEMENTS
| | Centinel Spine Holdco, Inc. | | | | | | | |
| | | | | | F-2 | | | |
| | | | | | F-3 | | | |
| | | | | | F-4 | | | |
| | | | | | F-6 | | | |
| | | | | | F-7 | | | |
| | Centinel Spine, LLC | | | | | | | |
| |
Audited Consolidated Financial Statements as of and for the Years Ended December 31, 2025 and 2024
|
| | | | | | |
| | | | | | F-8 | | | |
| | | | | | F-9 | | | |
| | | | | | F-11 | | | |
| | | | | | F-12 | | | |
| | | | | | F-13 | | | |
| | | | | | F-15 | | | |
| |
Unaudited Condensed Consolidated Financial Statements as of and for the Three and Six Months Ended June 30, 2026 and 2025
|
| | | | | | |
| | | | | | F-40 | | | |
| | | | | | F-42 | | | |
| | | | | | F-43 | | | |
| | | | | | F-44 | | | |
| | | | | | F-45 | | |
F-1
Report of Independent Registered Public Accounting Firm
To the Stockholders and the Board of Directors of Centinel Spine Holdco, Inc
Opinion on the Financial Statements
We have audited the accompanying balance sheet of Centinel Spine Holdco, Inc. (the Company) as of April 24, 2026, and the related notes (collectively referred to as the “financial statements”). In our opinion, the financial statements present fairly, in all material respects, the financial position of the Company as of April 24, 2026, in conformity with U.S. generally accepted accounting principles.
Basis for Opinion
These financial statements are the responsibility of the Company’s management. Our responsibility is to express an opinion on the Company’s financial statements based on our audit. We are a public accounting firm registered with the Public Company Accounting Oversight Board (United States) (PCAOB) and are required to be independent with respect to the Company in accordance with the U.S. federal securities laws and the applicable rules and regulations of the Securities and Exchange Commission and the PCAOB.
We conducted our audit in accordance with the standards of the PCAOB. Those standards require that we plan and perform the audit to obtain reasonable assurance about whether the financial statements are free of material misstatement, whether due to error or fraud. The Company is not required to have, nor were we engaged to perform, an audit of its internal control over financial reporting. As part of our audit we are required to obtain an understanding of internal control over financial reporting but not for the purpose of expressing an opinion on the effectiveness of the Company’s internal control over financial reporting. Accordingly, we express no such opinion.
Our audit included performing procedures to assess the risks of material misstatement of the financial statements, whether due to error or fraud, and performing procedures that respond to those risks. Such procedures included examining, on a test basis, evidence regarding the amounts and disclosures in the financial statements. Our audit also included evaluating the accounting principles used and significant estimates made by management as well as evaluating the overall financial statement presentation. We believe that our audit provides a reasonable basis for our opinion.
/s/ Ernst & Young
We have served as the Company’s auditor since 2026
Philadelphia, Pennsylvania
May 7, 2026
F-2
CENTINEL SPINE HOLDCO, INC.
BALANCE SHEET
|
(In thousands)
|
| |
April 24,
2026 |
| |||
| ASSETS | | | | | | | |
|
Total assets
|
| | | $ | 0.01 | | |
| STOCKHOLDER’S EQUITY: | | | | | | | |
|
Common stock, par value $0.01, 1,000 shares authorized, 1 share issued and outstanding
|
| | | | 0.01 | | |
|
Total stockholder’s equity
|
| | | $ | 0.01 | | |
See accompanying notes to the financial statements
F-3
1.
Nature of Organization and Operations:
Centinel Spine Holdco, Inc. (the “Corporation”) was organized as a Delaware corporation on April 24, 2026. The Corporation’s fiscal year end is December 31. Pursuant to a reorganization into a holding corporation structure, the Corporation will become a holding corporation and its sole assets are expected to be an equity interest in Centinel Spine, LLC.
The Corporation will be the managing member of Centinel Spine, LLC and will operate and control all of the business affairs of Centinel Spine, LLC and through Centinel Spine, LLC and its subsidiaries, will continue to conduct the business now conducted by these entities.
2.
Basis of Presentation and Summary of Significant Accounting Policies:
Basis of Presentation:
The Balance Sheet has been prepared in accordance with U.S. generally accepted accounting principles. Separate statements of income, changes in stockholder’s equity, and cash flows have not been presented in the financial statements because there have been no activities in this entity.
3.
Stockholder’s Equity:
The Corporation is authorized to issue 1,000 shares of common stock, at par value of $0.01 per share. Under the Corporation’s certificate of incorporation in effect as of April 24, 2026, there is only one class of common stock. On April 24, 2026, the Corporation issued 1 share of common stock for a total consideration of $0.01.
4.
Subsequent Events:
Subsequent events have been evaluated through May 7, 2026, which is the date the consolidated financial statements were issued.
F-4
CENTINEL SPINE HOLDCO, Inc.
FINANCIAL STATEMENT
June 30, 2026
June 30, 2026
CENTINEL SPINE HOLDCO, Inc.
BALANCE SHEET
(Unaudited)
(Unaudited)
| | | |
June 30,
2026 |
| |||
| ASSETS | | | | | | | |
|
Total assets
|
| | | $ | 0.01 | | |
| STOCKHOLDER’S EQUITY: | | | | | | | |
|
Common stock, par value $0.01, 1,000 shares authorized, 1 share issued and outstanding
|
| | | | 0.01 | | |
|
Total stockholder’s equity
|
| | | $ | 0.01 | | |
See accompanying notes to unaudited balance sheet.
F-6
CENTINEL SPINE HOLDCO, Inc.
NOTES TO BALANCE SHEET
(Unaudited)
(Unaudited)
1.
Nature of Organization and Operations:
Centinel Spine Holdco, Inc. (the “Corporation”) was organized as a Delaware corporation on April 24, 2026. The Corporation’s fiscal year end is December 31. Pursuant to a reorganization into a holding corporation structure, the Corporation will become a holding corporation and its sole assets are expected to be an equity interest in Centinel Spine, LLC.
The Corporation will be the managing member of Centinel Spine, LLC and will operate and control all of the business affairs of Centinel Spine, LLC and through Centinel Spine, LLC and its subsidiaries, will continue to conduct the business now conducted by these entities.
2.
Basis of Presentation and Summary of Significant Accounting Policies:
Basis of Presentation:
The Balance Sheet has been prepared in accordance with U.S. generally accepted accounting principles. Separate statements of income, changes in stockholder’s equity, and cash flows have not been presented in the financial statements because there have been no activities in this entity.
3.
Stockholder’s Equity:
The Corporation is authorized to issue 1,000 shares of common stock, at par value of $0.01 per share. Under the Corporation’s certificate of incorporation in effect as of April 24, 2026, there is only one class of common stock. On April 24, 2026, the Corporation issued 1 share of common stock for a total consideration of $0.01.
4.
Subsequent Events:
The Company has evaluated subsequent events through September 8, 2026, the date on which the balance sheet was available for issuance, and is not aware of any subsequent events that would require recognition or disclosure in the financial statement.
F-7
Report of Independent Registered Public Accounting Firm
To the Members and the Board of Directors of Centinel Spine, LLC and Subsidiaries
Opinion on the Financial Statements
We have audited the accompanying consolidated balance sheets of Centinel Spine, LLC and Subsidiaries (the Company) as of December 31, 2025 and 2024, and the related consolidated statements of comprehensive income (loss), redeemable convertible preferred units and members deficit and cash flows for each of the two years in the period ended December 31, 2025, and the related notes (collectively referred to as the “consolidated financial statements”). In our opinion, the consolidated financial statements present fairly, in all material respects, the financial position of the Company as of December 31, 2025 and 2024, and the results of its operations and its cash flows for each of the two years in the period ended December 31, 2025, in conformity with U.S. generally accepted accounting principles.
Basis for Opinion
These financial statements are the responsibility of the Company’s management. Our responsibility is to express an opinion on the Company’s financial statements based on our audits. We are a public accounting firm registered with the Public Company Accounting Oversight Board (United States) (PCAOB) and are required to be independent with respect to the Company in accordance with the U.S. federal securities laws and the applicable rules and regulations of the Securities and Exchange Commission and the PCAOB.
We conducted our audits in accordance with the standards of the PCAOB and in accordance with auditing standards generally accepted in the United States of America. Those standards require that we plan and perform the audit to obtain reasonable assurance about whether the financial statements are free of material misstatement, whether due to error or fraud. The Company is not required to have, nor were we engaged to perform, an audit of its internal control over financial reporting. As part of our audits, we are required to obtain an understanding of internal control over financial reporting but not for the purpose of expressing an opinion on the effectiveness of the Company’s internal control over financial reporting. Accordingly, we express no such opinion.
Our audits included performing procedures to assess the risks of material misstatement of the financial statements, whether due to error or fraud, and performing procedures that respond to those risks. Such procedures included examining, on a test basis, evidence regarding the amounts and disclosures in the financial statements. Our audits also included evaluating the accounting principles used and significant estimates made by management, as well as evaluating the overall financial statement presentation. We believe that our audits provide a reasonable basis for our opinion.
/s/ Ernst & Young LLP
We have served as the Company’s auditor since 2018
Philadelphia, Pennsylvania
May 7, 2026
F-8
CENTINEL SPINE, LLC AND SUBSIDIARIES
CONSOLIDATED BALANCE SHEETS
|
(In thousands)
|
| |
As of December 31,
|
| |||||||||
| |
2025
|
| |
2024
|
| ||||||||
| ASSETS | | | | | | | | | | | | | |
| Current assets: | | | | | | | | | | | | | |
|
Cash and cash equivalents
|
| | | $ | 21,289 | | | | | $ | 6,146 | | |
|
Accounts receivable, net of allowances of $838 and $545, respectively
|
| | | | 26,817 | | | | | | 20,322 | | |
|
Inventory, net
|
| | | | 20,433 | | | | | | 16,460 | | |
|
Prepaid expenses and other current assets
|
| | | | 772 | | | | | | 1,009 | | |
|
Total current assets
|
| | | | 69,311 | | | | | | 43,937 | | |
| Non-Current assets: | | | | | | | | | | | | | |
|
Property and equipment, net
|
| | | | 7,276 | | | | | | 5,130 | | |
|
Right of use asset
|
| | | | 672 | | | | | | 1,056 | | |
|
Goodwill
|
| | | | 18,820 | | | | | | 17,247 | | |
|
Intangible assets, net
|
| | | | 5,626 | | | | | | 6,152 | | |
|
Total assets
|
| | | $ | 101,705 | | | | | $ | 73,522 | | |
|
LIABILITIES, REDEEMABLE CONVERTIBLE PREFFERED UNITS AND MEMBERS’ DEFICIT
|
| | | | | | | | | | | | |
| Current liabilities: | | | | | | | | | | | | | |
|
Accounts payable
|
| | | $ | 6,337 | | | | | $ | 6,605 | | |
|
Accrued expenses
|
| | | | 15,584 | | | | | | 12,410 | | |
|
Due to related parties
|
| | | | 16 | | | | | | 18 | | |
|
Current portion of lease liability
|
| | | | 426 | | | | | | 405 | | |
|
Current portion of note payable, net
|
| | | | — | | | | | | 42,522 | | |
|
Total current liabilities
|
| | | | 22,363 | | | | | | 61,960 | | |
| Non-Current liabilities: | | | | | | | | | | | | | |
|
Warrant and derivative liabilities
|
| | | | 10,282 | | | | | | 1,308 | | |
|
Lease liability, net of current portion
|
| | | | 246 | | | | | | 651 | | |
|
Deferred tax liability
|
| | | | 1,687 | | | | | | 1,425 | | |
|
Long-term note payable, net of current portion
|
| | | | 58,986 | | | | | | — | | |
|
Convertible notes payable, net
|
| | | | 61,048 | | | | | | 60,081 | | |
|
Term notes payable, net
|
| | | | 11,872 | | | | | | 9,104 | | |
|
Total liabilities
|
| | | | 166,484 | | | | | | 134,529 | | |
| Commitments and contingencies (Note 12) | | | | | | | | | | | | | |
|
Redeemable Convertible Class A Preferred Units; no par value, 66,518,221 units authorized as of December 31, 2025 and 2024, 63,290,921 units outstanding as of December 31, 2025 and 2024 and accumulated liquidation value of $88,250 as of December 31, 2025 and 2024, respectively.
|
| | | | 83,019 | | | | | | 83,019 | | |
F-9
CENTINEL SPINE, LLC AND SUBSIDIARIES
CONSOLIDATED BALANCE SHEETS (Continued)
|
(In thousands)
|
| |
As of December 31,
|
| |||||||||
| |
2025
|
| |
2024
|
| ||||||||
|
Redeemable Convertible Class B Preferred Units; no par value, 48,888,107 and
47,566,535 units authorized as of December 31, 2025 and 2024, 35,978,863 and 34,657,291 units outstanding as of December 31, 2025 and 2024, and accumulated liquidation value of $50,167 and $49,692 as of December 31, 2025 and 2024, respectively. |
| | | | 50,106 | | | | | | 48,264 | | |
|
Redeemable Convertible Special Member Unit; no par value, 1 unit authorized and outstanding as of December 31, 2025 and 2024, and accumulated liquidation value of $109,971 and $104,980 as of December 31, 2025 and 2024, respectively.
|
| | | | — | | | | | | — | | |
| Members’ deficit: | | | | | | | | | | | | | |
|
Common Units no par value, 150,709,394 and 149,387,822 units authorized as of
December 31, 2025 and 2024, and 32,037,413 and 35,303,066 units outstanding as of December 31, 2025 and 2024, respectively. |
| | | | — | | | | | | — | | |
|
Incentive Units no par value, 17,480,254 units authorized as of December 31, 2025
and 2024, and 1,437,987 and 1,305,614 units outstanding as of December 31, 2025 and 2024, respectively. |
| | | | — | | | | | | — | | |
|
Additional paid-in capital
|
| | | | 3,859 | | | | | | 3,678 | | |
|
Accumulated deficit
|
| | | | (198,681) | | | | | | (194,360) | | |
|
Accumulated other comprehensive loss
|
| | | | (3,082) | | | | | | (1,608) | | |
|
Total members’ deficit
|
| | | | (197,904) | | | | | | (192,290) | | |
|
Total liabilities, redeemable convertible preferred units and members’ deficit
|
| | | $ | 101,705 | | | | | $ | 73,522 | | |
| | |||||||||||||
See accompanying notes to the consolidated financial statements
F-10
CENTINEL SPINE, LLC AND SUBSIDIARIES
CONSOLIDATED STATEMENTS OF COMPREHENSIVE INCOME (LOSS)
| | | |
For the year ended December 31,
|
| |||||||||
|
(In thousands)
|
| |
2025
|
| |
2024
|
| ||||||
|
Net revenue
|
| | | $ | 132,163 | | | | | $ | 95,056 | | |
|
Cost of sales
|
| | | | 26,143 | | | | | | 22,232 | | |
|
Gross profit
|
| | | | 106,020 | | | | | | 72,824 | | |
| Operating expenses: | | | | | | | | | | | | | |
|
Selling and marketing
|
| | | | 67,497 | | | | | | 49,370 | | |
|
General and administrative
|
| | | | 19,157 | | | | | | 16,749 | | |
|
Research and development
|
| | | | 3,660 | | | | | | 4,954 | | |
|
Total operating expenses
|
| | | | 90,314 | | | | | | 71,073 | | |
|
Operating income
|
| | | | 15,706 | | | | | | 1,751 | | |
| Other income (expense): | | | | | | | | | | | | | |
|
Other expense, net
|
| | | | (9,359) | | | | | | (5) | | |
|
Foreign currency gain (loss)
|
| | | | 4,089 | | | | | | (1,830) | | |
|
Interest expense
|
| | | | (11,070) | | | | | | (12,141) | | |
|
Loss on extinguishment of debt
|
| | | | (3,458) | | | | | | — | | |
|
Total other expense, net
|
| | | | (19,798) | | | | | | (13,976) | | |
|
Net loss before taxes
|
| | | | (4,092) | | | | | | (12,225) | | |
|
Income tax expense (benefit)
|
| | | | 229 | | | | | | (102) | | |
|
Net loss
|
| | | | (4,321) | | | | | | (12,123) | | |
| Other comprehensive (loss) income: | | | | | | | | | | | | | |
|
Foreign currency translation
|
| | | | (1,474) | | | | | | 473 | | |
|
Comprehensive loss
|
| | | $ | (5,795) | | | | | $ | (11,650) | | |
See accompanying notes to the consolidated financial statements
F-11
CENTINEL SPINE, LLC AND SUBSIDIARIES
CONSOLIDATED STATEMENTS OF REDEEMABLE CONVERTIBLE PREFERRED UNITS AND MEMBERS’ DEFICIT
| | | |
Redeemable Convertible Preferred Units
|
| | | | | | | | | | | | | | | | | | | | | | | | | |||||||||||||||||||||||||||||||||||||||||||||||||||||||||
| | | |
Series A
Preferred Units |
| |
Series B
Preferred Units |
| |
Special
Member Unit |
| |
Common Units
|
| |
Incentive Units
|
| |
Additional
Paid-in Capital |
| |
Accumulated
Deficit |
| |
Accumulated
Other Comprehensive Loss |
| |
Total
members’ deficit |
| |||||||||||||||||||||||||||||||||||||||||||||||||||||||||
|
(In thousands, except unit amounts)
|
| |
Units
|
| |
Cost
|
| |
Units
|
| |
Cost
|
| |
Units
|
| |
Cost
|
| |
Units
|
| |
Cost
|
| |
Units
|
| |
Cost
|
| ||||||||||||||||||||||||||||||||||||||||||||||||||||||
|
Beginning Balance, January 1, 2024
|
| | | | 63,290,921 | | | | | | 83,019 | | | | | | 34,657,291 | | | | | | 48,264 | | | | | | 1 | | | | | | — | | | | | | 35,303,066 | | | | | | — | | | | | | 1,272,426 | | | | | | — | | | | | | 3,435 | | | | | | (182,237) | | | | | | (2,081) | | | | | | (180,883) | | |
|
Unit-based compensation expense
|
| | | | — | | | | | | — | | | | | | — | | | | | | — | | | | | | — | | | | | | — | | | | | | — | | | | | | — | | | | | | — | | | | | | — | | | | | | 229 | | | | | | — | | | | | | — | | | | | | 229 | | |
|
Exercise of stock options
|
| | | | — | | | | | | — | | | | | | — | | | | | | — | | | | | | — | | | | | | — | | | | | | — | | | | | | — | | | | | | 33,188 | | | | | | — | | | | | | 14 | | | | | | — | | | | | | — | | | | | | 14 | | |
|
Net loss
|
| | | | — | | | | | | — | | | | | | — | | | | | | — | | | | | | — | | | | | | — | | | | | | — | | | | | | — | | | | | | — | | | | | | — | | | | | | — | | | | | | (12,123) | | | | | | — | | | | | | (12,123) | | |
|
Foreign currency translation
|
| | | | — | | | | | | — | | | | | | — | | | | | | — | | | | | | — | | | | | | — | | | | | | — | | | | | | — | | | | | | — | | | | | | — | | | | | | — | | | | | | — | | | | | | 473 | | | | | | 473 | | |
|
Balance, December 31, 2024
|
| | | | 63,290,921 | | | | | $ | 83,019 | | | | | | 34,657,291 | | | | | $ | 48,264 | | | | | | 1 | | | | | $ | — | | | | | | 35,303,066 | | | | | $ | — | | | | | | 1,305,614 | | | | | $ | — | | | | | $ | 3,678 | | | | | $ | (194,360) | | | | | $ | (1,608) | | | | | $ | (192,290) | | |
|
Unit-based compensation expense
|
| | | | — | | | | | | — | | | | | | — | | | | | | — | | | | | | — | | | | | | — | | | | | | — | | | | | | — | | | | | | — | | | | | | — | | | | | | 135 | | | | | | — | | | | | | — | | | | | | 135 | | |
|
Exercise of stock options
|
| | | | — | | | | | | — | | | | | | — | | | | | | — | | | | | | — | | | | | | — | | | | | | — | | | | | | — | | | | | | 132,373 | | | | | | — | | | | | | 46 | | | | | | — | | | | | | — | | | | | | 46 | | |
|
Notes payable converted to equity
|
| | | | — | | | | | | — | | | | | | 1,321,572 | | | | | | 1,842 | | | | | | — | | | | | | — | | | | | | — | | | | | | — | | | | | | — | | | | | | — | | | | | | — | | | | | | — | | | | | | — | | | | | | — | | |
|
Cancellation of common units
|
| | | | — | | | | | | — | | | | | | — | | | | | | — | | | | | | — | | | | | | — | | | | | | (3,265,653) | | | | | | — | | | | | | — | | | | | | — | | | | | | — | | | | | | — | | | | | | — | | | | | | — | | |
|
Net loss
|
| | | | — | | | | | | — | | | | | | — | | | | | | — | | | | | | — | | | | | | — | | | | | | — | | | | | | — | | | | | | — | | | | | | — | | | | | | — | | | | | | (4,321) | | | | | | — | | | | | | (4,321) | | |
|
Foreign currency translation
|
| | | | — | | | | | | — | | | | | | — | | | | | | — | | | | | | — | | | | | | — | | | | | | — | | | | | | — | | | | | | — | | | | | | — | | | | | | — | | | | | | — | | | | | | (1,474) | | | | | | (1,474) | | |
|
Balance, December 31, 2025
|
| | | | 63,290,921 | | | | | $ | 83,019 | | | | | | 35,978,863 | | | | | $ | 50,106 | | | | | | 1 | | | | | $ | — | | | | | | 32,037,413 | | | | | $ | — | | | | | | 1,437,987 | | | | | $ | — | | | | | $ | 3,859 | | | | | $ | (198,681) | | | | | $ | (3,082) | | | | | $ | (197,904) | | |
See accompanying notes to the consolidated financial statements
F-12
CENTINEL SPINE, LLC AND SUBSIDIARIES
CONSOLIDATED STATEMENTS OF CASH FLOWS
| | | |
For the year ended December 31,
|
| |||||||||
|
(In thousands)
|
| |
2025
|
| |
2024
|
| ||||||
| Cash flows from operating activities: | | | | | | | | | | | | | |
|
Net loss
|
| | | $ | (4,321) | | | | | $ | (12,123) | | |
| Adjustments to reconcile net loss to net cash | | | | | | | | | | | | | |
|
(used for) provided by operating activities:
|
| | | | | | | | | | | | |
|
Depreciation and amortization
|
| | | | 4,447 | | | | | | 4,153 | | |
|
Amortization of debt discount and issuance cost
|
| | | | 2,392 | | | | | | 2,890 | | |
|
Loss on extinguishment of debt
|
| | | | 3,458 | | | | | | — | | |
|
Loss on sale of fixed assets
|
| | | | — | | | | | | (30) | | |
|
Operating lease expense
|
| | | | 419 | | | | | | 409 | | |
|
Deferred income tax expense (benefit)
|
| | | | 76 | | | | | | (2) | | |
|
Unrealized and realized loss (gain) on warrant and derivative liabilities,
net |
| | | | 9,410 | | | | | | (179) | | |
|
Provision for excess and obsolete inventory
|
| | | | 1,614 | | | | | | 1,477 | | |
|
Paid in kind interest
|
| | | | 2,842 | | | | | | 3,012 | | |
|
Bad debt expense
|
| | | | 569 | | | | | | 244 | | |
|
Unit-based compensation expense
|
| | | | 135 | | | | | | 229 | | |
|
Foreign currency remeasurement (gain) loss
|
| | | | (4,089) | | | | | | 1,830 | | |
|
Changes in operating assets and liabilities:
|
| | | | | | | | | | | | |
|
Accounts receivable
|
| | | | (6,586) | | | | | | (3,926) | | |
|
Inventory
|
| | | | (4,810) | | | | | | (3,448) | | |
|
Prepaid expenses and other current assets
|
| | | | 186 | | | | | | 29 | | |
|
Accounts payable
|
| | | | (858) | | | | | | (1,897) | | |
|
Accrued expenses and other expenses
|
| | | | (3,229) | | | | | | 371 | | |
|
Net cash provided by (used for) operating activities
|
| | | | 1,655 | | | | | | (6,961) | | |
| Cash flows from investing activities: | | | | | | | | | | | | | |
|
Purchases of property and equipment
|
| | | | (5,803) | | | | | | (3,847) | | |
|
Proceeds from disposition of fusion portfolio and/or assets, net of direct costs to sell
|
| | | | — | | | | | | (2) | | |
|
Proceeds from sale of property and equipment
|
| | | | 159 | | | | | | 33 | | |
|
Net cash used for investing activities
|
| | | | (5,644) | | | | | | (3,816) | | |
| Cash flows from financing activities: | | | | | | | | | | | | | |
|
Proceeds from convertible promissory notes
|
| | | | — | | | | | | 7,434 | | |
|
Proceeds from long-term debt
|
| | | | 60,000 | | | | | | — | | |
|
Payments on long-term debt and note payable
|
| | | | (36,500) | | | | | | — | | |
|
Payment for debt extinguishment costs
|
| | | | (1,990) | | | | | | — | | |
|
Payment for debt issuance costs
|
| | | | (2,300) | | | | | | — | | |
|
Proceeds from exercise of stock options
|
| | | | 45 | | | | | | 14 | | |
|
Net cash provided by financing activities
|
| | | | 19,255 | | | | | | 7,448 | | |
|
Effect of the exchange rate on cash
|
| | | | (123) | | | | | | (60) | | |
F-13
CENTINEL SPINE, LLC AND SUBSIDIARIES
CONSOLIDATED STATEMENTS OF CASH FLOWS (Continued)
| | | |
For the year ended December 31,
|
| |||||||||
|
(In thousands)
|
| |
2025
|
| |
2024
|
| ||||||
|
Net increase (decrease) in cash and cash equivalents
|
| | | | 15,143 | | | | | | (3,389) | | |
|
Cash and cash equivalents, beginning of year
|
| | | | 6,146 | | | | | | 9,535 | | |
|
Cash and cash equivalents, end of year
|
| | | $ | 21,289 | | | | | $ | 6,146 | | |
| Supplemental cash flow information | | | | | | | | | | | | | |
|
Cash paid for interest
|
| | | $ | 5,777 | | | | | $ | 6,163 | | |
|
Cash paid for accrued paid-in-kind interest and final fee upon extinguishment
|
| | | $ | 6,719 | | | | | $ | — | | |
|
Cash paid for taxes
|
| | | $ | 365 | | | | | $ | 225 | | |
| Non-cash financing activities | | | | | | | | | | | | | |
|
Conversion of debt to equity
|
| | | $ | 1,842 | | | | | $ | — | | |
See accompanying notes to the consolidated financial statements
F-14
Centinel Spine, LLC and Subsidiaries
NOTES TO CONSOLIDATED FINANCIAL STATEMENTS
(In thousands, except unit and per unit amounts)
(In thousands, except unit and per unit amounts)
1. Nature of Organization and Operations:
Centinel Spine, LLC (the “Company” or “Centinel”) was formed on August 15, 2017 as a limited liability company in the state of Delaware. Centinel is the manufacturer of record (outsourcing manufacturing to third parties) and distributor of spinal implants with distribution and operations facilities located in West Chester, Pennsylvania, Waalwijk, Netherlands and Kent Town, Australia. Inventory is consigned with distributors and at hospitals throughout the world.
Business activities of Centinel consist of product research and development, product manufacturing, and marketing and sales. Centinel’s corporate office is located in West Chester, Pennsylvania.
2. Basis of Presentation and Summary of Significant Accounting Policies:
Principles of Consolidation:
The Company prepared the consolidated financial statements in conformity with accounting principles generally accepted in the United States of America (“US GAAP”), which contemplate the continued existence of the Company.
The accompanying consolidated financial statements include Centinel Spine, LLC, CS Swiss Holdings, LLC (a wholly owned subsidiary of Centinel), Centinel Spine Schweiz GmbH (“Schweiz”), a wholly owned subsidiary of CS Swiss Holdings, LLC, and Centinel Spine GmbH and Centinel Spine Australia PTY (wholly owned subsidiaries of Schweiz). Intercompany accounts and transactions have been eliminated in the consolidated financial statements.
Concentrations of Credit and Market Risk:
Financial instruments that potentially expose the Company to concentrations of credit and market risk consist primarily of cash and cash equivalents, and accounts receivable. Cash is maintained at Federal Deposit Insurance Corporation (“FDIC”) insured financial institutions. The Company has not experienced any losses with respect to its cash balances. Based on management’s review of the strength of the financial institutions, management feels the risk of loss on its cash balances is minimal. The Company has amounts in excess of the FDIC limit as of December 31, 2025 and 2024.
Accounts receivable consists primarily of amounts due from hospitals, ambulatory medical centers, surgical centers, healthcare providers and international stocking distributors. Generally, Centinel does not require collateral from customers. The Company carries its accounts receivable at the net amount expected to be collected. The Company uses a forward-looking model to evaluate its receivables and establishes an allowance for credit losses, based on a history of past write-offs, collections, and current credit conditions. Accounts are written off as uncollectible at the time management determines that collections are unlikely. No customer accounted for 10% or more of sales for the years presented.
Risks and Uncertainties:
The Company is subject to risks common to companies in the medical device industry including, but not limited to, uncertainties related to commercialization of competitor products, regulatory approvals, dependence on key products, dependence on key customers and suppliers, and protection of intellectual property rights.
Use of Estimates:
In the preparation of consolidated financial statements in conformity with US GAAP, management is required to make estimates and assumptions that affect the reported amounts of assets and liabilities and disclosure of contingent assets and liabilities at the date of the consolidated financial statements and the reported amounts
F-15
Centinel Spine, LLC and Subsidiaries
NOTES TO CONSOLIDATED FINANCIAL STATEMENTS (Continued)
(In thousands, except unit and per unit amounts)
(In thousands, except unit and per unit amounts)
2. Basis of Presentation and Summary of Significant Accounting Policies: (Continued)
of revenue and expense during the reported period. Actual results could differ from those estimates. Estimates and assumptions are periodically reviewed, and the effects of revisions are reflected in the consolidated financial statements in the period they are determined to be necessary.
Significant areas that require estimates include intangible assets, allowance for credit losses, unit-based compensation, reserves for excess and obsolete inventory, useful lives of assets, recoverability of intangible assets, warrant and derivative liabilities and deferred tax assets. The Company is subject to risks and uncertainties due to changes in the healthcare environment, regulatory oversight, competition, and legislation that may cause actual results to differ from estimated results.
Segment Information:
Operating segments are defined as components of an enterprise about which separate discrete information is available for evaluation by the chief operating decision maker in deciding how to allocate resources and in assessing performance. The Company manages its global operations and business in one operating segment.
Cash and Cash Equivalents:
The Company considers all highly liquid investments with an insignificant interest rate risk and original maturities of three months or less to be cash equivalents.
Inventory, net:
Inventory is recorded at the lower of cost or net realizable value. Cost is determined on a first-in, first-out basis. The Company’s inventory is comprised primarily of finished goods available for sale.
The Company periodically evaluates the carrying value of inventory in relation to estimated forecasts of product demand, which takes into consideration the life cycle of product releases. When quantities on hand exceed estimated sales forecasts, the Company records a reserve for such excess inventory. Once inventory has been written down, it creates a new cost basis for inventory that is not subsequently written up. As of December 31, 2025 and 2024, the inventory reserve was $7,955 and $6,226, respectively. The following table sets for the components of the Company’s inventories at December 31, 2025 and 2024.
| | | |
2025
|
| |
2024
|
| ||||||
|
Finished products
|
| | | $ | 22,870 | | | | | $ | 18,521 | | |
|
Work in process
|
| | | | 1,590 | | | | | | 1,258 | | |
|
Raw Materials
|
| | | | 3,928 | | | | | | 2,907 | | |
|
Inventories before reserve
|
| | | | 28,388 | | | | | | 22,686 | | |
|
Inventory reserve
|
| | | | (7,955) | | | | | | (6,226) | | |
|
Inventory
|
| | | $ | 20,433 | | | | | $ | 16,460 | | |
Concentration of Suppliers:
During the year ended December 31, 2025, purchases of inventory from five vendors accounted for approximately 94% of the Company’s inventory purchases. During the year ended December 31, 2024, purchases of inventory from five vendors accounted for approximately 91% of the Company’s inventory purchases.
Property and Equipment, net:
Property and equipment are stated at cost less accumulated depreciation. Expenditures for additions, improvements and major renewals are capitalized, whereas expenditures for maintenance and repairs are
F-16
Centinel Spine, LLC and Subsidiaries
NOTES TO CONSOLIDATED FINANCIAL STATEMENTS (Continued)
(In thousands, except unit and per unit amounts)
(In thousands, except unit and per unit amounts)
2. Basis of Presentation and Summary of Significant Accounting Policies: (Continued)
charged to earnings when incurred. Gains and losses from sales or other dispositions of property and equipment are included in other income in the consolidated statements of comprehensive loss.
The Company maintains surgical instrument sets that are used by surgeons and healthcare facilities to perform procedures using the Company’s implantable spinal products. These surgical instrument sets are generally loaned to hospital and ambulatory surgery center customers for use in connection with procedures involving the Company’s implantable products at no additional charge and remain the property of the Company. The Company retains title to and the risk of loss for the instrument sets.
The Company evaluated the provision of surgical instrument sets under ASC 842, Leases, and concluded that the arrangements do not contain a lease because the Company has provided the right to use its asset for no consideration. Accordingly, no consideration is allocated to the right to use the instrument sets.
The instrument sets are not considered a promise for purposes of identifying performance obligations under ASC 606, Revenue from Contracts with Customers, because control of the instrument sets is not transferred to the customer. As such, the Company’s contracts contain a single performance obligation, that is, the delivery of spinal implants, and the entire transaction price is recognized upon delivery to the customer.
Surgical instrument sets are recorded as property and equipment under ASC 360, Property, Plant, and Equipment, and are depreciated on a straight-line basis over their estimated useful lives once placed in service. Depreciation expense related to surgical instrument sets is included in cost of goods sold in the statement of comprehensive income (loss).
Depreciation is provided for using the straight-line method over the estimated useful lives of the respective assets. Assets are being depreciated over a period of three to five years.
Impairment of Long-Lived Assets:
The Company reviews long-lived assets, which include property and equipment, for impairment whenever events or changes in circumstances indicate that the carrying amount of an asset may not be recoverable. An impairment is assessed when the undiscounted future cash flows from the use and eventual disposition of an asset group are less than its carrying value. If an impairment is indicated, the Company measures the amount of the impairment loss as the amount by which the carrying amount exceeds the fair value of the asset group. The fair value methodology is based on quoted market prices, if available. If quoted market prices are not available, an estimate of fair value is made based on prices of similar assets or other valuation techniques including present value techniques. There were no impairments recorded during the years ended December 31, 2025 and 2024.
Goodwill and Intangible Assets, net:
Goodwill represents the excess of purchase price over the fair values of the identifiable assets acquired less the liabilities assumed in the acquisition of a business. Goodwill is not amortized but is evaluated for impairment annually or when indicators of a potential impairment are present by assessing qualitative factors or performing a quantitative analysis in determining whether it is more likely than not that the fair value of net assets is below the carrying amounts. The annual evaluation for impairment is based on valuation methods that incorporate assumptions and internal projections of expected future cash flows and operating plans. The Company believes such assumptions are also comparable to those that would be used by other market participants. The Company performs its annual impairment test of goodwill in the fourth quarter of each year. The goodwill of Schweiz is remeasured at the month-end rate. Due to the increase in the value of the dollar to the euro during the year ended December 31, 2025, the result of remeasurement was an increase in goodwill of $1,573. Due to the decrease in the value of the dollar to the euro during the year ended
F-17
Centinel Spine, LLC and Subsidiaries
NOTES TO CONSOLIDATED FINANCIAL STATEMENTS (Continued)
(In thousands, except unit and per unit amounts)
(In thousands, except unit and per unit amounts)
2. Basis of Presentation and Summary of Significant Accounting Policies: (Continued)
December 31, 2024, the result of remeasurement was a decrease in goodwill of $756. During the years ended December 31, 2025 and 2024, the Company did not record any impairment charges related to goodwill.
Intangible assets, net consist of trademarks/trade names, patents and surgeon relationships acquired in business combinations, which are reported at acquisition date fair value, less accumulated amortization. Intangible assets with finite lives are amortized over their estimated useful lives using either the straight-line or an accelerated method. There were no impairments of finite-lived intangible assets during the years ended December 31, 2025 or 2024.
Revenue Recognition:
The Company recognizes revenue from its sales when its performance obligations with its customers have been satisfied. In the contracts with its customers, the Company has identified a single performance obligation to provide motion preservation products, for which revenue is recognized at a point in time.
The Company sells its products through a distributor network, the majority of which do not take title to the inventory but facilitate the sale to the end customer (non-stocking distributors) and others who hold inventory in the Company’s products (stocking distributors in international markets). For sales through non-stocking distributors, the Company has determined that the hospital or ambulatory surgical center is the customer and recognize revenue at the time the product is used or implanted. For these sales, the Company has determined it is the principal in the transaction as it has the ability to direct the use of the products prior to transfer to the end customer, is responsible for fulfilling the promise to the end customer, has latitude in establishing price and controls the relationship with the end customer. Accordingly, revenues are recognized at the gross amount charged to the end customer with expense recognized for commissions paid to distributors classified as selling and marketing expenses in the Statement of Comprehensive Income (Loss). For sales through stocking distributors, the Company has determined the distributor is the customer and recognizes revenue upon shipment as control of the product transfers based on the contractual terms.
The Company invoices its customers after control of the product has been transferred to the customer and invoice payments are generally due within 30 days of invoice date. In determining the transaction price, a significant financing component does not exist since the timing from when the Company delivers its products to when the customers pay for the products is typically less than one year. The Company does not have material variable consideration, including discounts and rebates.
The nature of the Company’s products and services does not give rise to contract assets as costs are not incurred to fulfill a contract before a product or service is provided to a customer. Costs to obtain contracts are in the form of commissions paid to employees or third-party agents. The Company expenses commissions associated with obtaining a contract at the time of sale or as incurred, which is typically less than one year from date of sale. The Company has elected to present these costs within selling and marketing expenses. As such, the Company did not have any contract assets as of December 31, 2025 and 2024.
Cost of Sales:
Cost of sales consists primarily of costs of the components of implants, instrument set depreciation, amortization of intangible assets, royalties, scrap and inventory obsolescence, as well as distribution-related expenses such as logistics and shipping costs. Commissions resulting from sales are included in operating expenses within selling and marketing.
Research and Development:
Research and development expenses include pre-approval regulatory and clinical trial expenses, third party expenses, personnel and consultants’ compensation, employee benefits, unit-based compensation expense and
F-18
Centinel Spine, LLC and Subsidiaries
NOTES TO CONSOLIDATED FINANCIAL STATEMENTS (Continued)
(In thousands, except unit and per unit amounts)
(In thousands, except unit and per unit amounts)
2. Basis of Presentation and Summary of Significant Accounting Policies: (Continued)
other headcount-related expenses associated with product development. Research and development costs are expensed as they are incurred.
Advertising:
Advertising costs are expensed as incurred and are included in selling and marketing expenses. Advertising costs were $124 and $119 for the year ended December 31, 2025 and 2024, respectively.
Unit-Based Compensation:
The Company accounts for unit-based employee and nonemployee compensation arrangements in accordance with provisions of ASC 718, Compensation—Unit Compensation. ASC 718 requires the recognition of compensation expense, using a fair-value based method, for costs related to all unit-based payments including unit options. ASC 718 requires companies to estimate the fair value of unit-based payment awards on the date of grant using an option-pricing model, which uses both historical and current market data to estimate fair value. The Company uses the Black-Scholes option-pricing model (“Black Scholes”) to determine the fair value of options granted. The Company’s unit-based awards are subject to service-based vesting conditions and compensation expense is recognized on an accelerated basis.
Black-Scholes requires inputs based on certain subjective assumptions, including (i) the expected volatility of the price of the Company’s common units, (ii) the expected term of the option, (iii) the risk-free interest rate and (iv) expected dividends. Due to the lack of a public market for the Company’s common unit and lack of company-specific historical and implied volatility data, the Company has based its computation of expected volatility on the historical volatility of a representative group of public companies with similar characteristics to the Company, including stage of product development and life science industry focus. The historical volatility is calculated based on a period of time commensurate with expected term assumption. The Company uses the simplified method to calculate the expected term for options granted to employees and nonemployees whereby the expected term equals the arithmetic average of the vesting term and the original contractual term of the options due to its lack of sufficient historical data. The risk-free interest rate is based on U.S. Treasury securities with a maturity date commensurate with the expected term of the associated option. The expected dividend yield is assumed to be zero as the Company has never paid dividends and has no current plans to pay any dividends on its common units. Forfeitures are recognized as they occur.
Due to the absence of an active market for the Company’s common units, the Company utilized methodologies in accordance with the framework of the American Institute of Certified Public Accountants Technical Practice Aid, Valuation of Privately-Held Company Equity Securities Issued as Compensation, to estimate the fair value of its common stock. In determining the exercise prices for option units granted, the Company has considered the estimated fair value of the common unit as of the measurement date. The estimated fair value of the common unit has been determined at each grant date based upon a variety of factors, including the illiquid nature of the common unit, arm’s-length sales of the common units, the effect of the rights and preferences of the preferred unitholders, and the prospects of a liquidity event. Among other factors are the Company’s financial position and historical financial performance, the status of technological developments within the Company’s research, the composition and ability of the current research and management team, an evaluation or benchmark of the Company’s competition, and the current business climate in the marketplace. Significant changes to the key assumptions underlying the factors used could result in different fair values of common units at each valuation date.
Foreign Currency Translation and Transactions:
The reporting currency of the Company is the U.S. dollar. Foreign subsidiaries whose functional currency is a currency other than the U.S. dollar translate their assets and liabilities into U.S. dollars at current exchange
F-19
Centinel Spine, LLC and Subsidiaries
NOTES TO CONSOLIDATED FINANCIAL STATEMENTS (Continued)
(In thousands, except unit and per unit amounts)
(In thousands, except unit and per unit amounts)
2. Basis of Presentation and Summary of Significant Accounting Policies: (Continued)
rates in effect at the end of the fiscal period. Revenues and expenses are translated at average exchange rates during the reporting period. The gains or losses that result from this process are shown as cumulative translation adjustments within accumulated other comprehensive loss on the consolidated balance sheets.
Some transactions of the Company and its subsidiaries are conducted in currencies different from their respective functional currency. Foreign currency exchange transaction gain (loss) is the result of re-measuring transactions denominated in a currency other than the functional currency of the entity recording the transaction. The Company realized net foreign currency transaction gains of $4,089 and realized net foreign currency transaction losses of $1,830, for the period ending December 31, 2025 and 2024, respectively, which are included in other income (expense), net on the consolidated statements of comprehensive loss. Centinel Spine Schweiz GmbH has an outstanding loan with its parent company Centinel Spine LLC with a principal balance of $29,114. The remeasurement of the intercompany loan denominated in the U.S. dollar is recorded in accumulated other comprehensive loss on the balance sheet as repayment is not expected in the foreseeable future.
Income Tax:
The company accounts for income taxes in accordance with ASC Topic 740 which prescribes the asset and liability method, and requires the company to recognize current tax liabilities or receivables for the amount of taxes estimated to be payable or refundable for the current year and deferred tax assets and liabilities for the expected future tax consequences attributable to temporary differences between the financial statement carrying amounts and their respective tax bases of assets and liabilities and the expected benefits of net operating loss and credit carryforwards. Deferred tax assets and liabilities are measured using enacted tax rates expected to apply to taxable income in the years in which those temporary differences are expected to be recovered or settled. The effect on deferred tax assets and liabilities of a change in tax rates is recognized in operations in the period enacted. A valuation allowance is provided when it is more likely than not that a portion or all of a deferred tax asset will not be realized. The ultimate realization of deferred tax assets is dependent upon the generation of future taxable income and the reversal of deferred tax liabilities during the period in which related temporary differences become deductible.
ASC 740 provides a two-step approach to recognize and measure uncertain tax positions. The first step is to evaluate the tax position taken or expected to be taken in a tax return by determining if the weight of available evidence indicates that it is more likely than not that, on an evaluation of the technical merits, the tax position will be sustained on audit. The second step is to measure the tax benefit as the largest amount that is more than 50% likely to be realized on ultimate settlement. As of December 31, 2025 and 2024, no liability for unrecognized tax benefits or interest or penalties related to unrecognized tax benefits have been recorded. It is the company’s policy that any interest or penalties associated with unrecognized tax benefits would be reflected as interest expense or as component of other expense, respectively.
Centinel Spine, LLC is a U.S. limited liability company treated as a partnership for income tax purposes and is therefore not taxable for federal and most state income tax purposes. As a result, Centinel’s earnings or losses for federal and most state purposes are included in the tax returns of the members. Net earnings for financial statement purposes may differ significantly from taxable income reportable to members as a result of differences between the tax basis and financial basis of assets and liabilities, differences between the tax accounting and financial accounting treatment of certain items, and due to allocation requirements related to taxable income under our Limited Liability Company Agreement.
CS Swiss Holdings, LLC is also a U.S. limited liability company, but which is treated as a disregarded entity for most U.S. income tax purposes. Its earnings or losses for federal and most state purposes are included in the taxable income reportable by Centinel to its members.
F-20
Centinel Spine, LLC and Subsidiaries
NOTES TO CONSOLIDATED FINANCIAL STATEMENTS (Continued)
(In thousands, except unit and per unit amounts)
(In thousands, except unit and per unit amounts)
2. Basis of Presentation and Summary of Significant Accounting Policies: (Continued)
Fair Value Measurements:
The Company measures certain assets and liabilities at fair value. Fair value is defined as the price that would be received to sell an asset or paid to transfer a liability (an exit price) in an orderly transaction between market participants at the reporting date. The hierarchy below lists the three levels of fair value based on the extent to which inputs used in measuring fair value are observable in the market. The Company categorizes each of the Company’s fair value measurements in one of these three levels based on the lowest level input that is significant to the fair value measurement in its entirety.
These levels are:
•
Level 1—inputs based upon unadjusted quoted prices for identical instruments traded in active markets.
•
Level 2—inputs are based upon observable market-based inputs or unobservable inputs that are corroborated by market data.
•
Level 3—inputs are generally unobservable and typically reflect management’s estimates of assumptions that market participants would use in pricing the asset or liability.
| | | |
December 31, 2025
|
| |||||||||||||||||||||
| | | |
Level 1
|
| |
Level 2
|
| |
Level 3
|
| |
Total
|
| ||||||||||||
|
Cash equivalents
|
| | | $ | 21,289 | | | | | $ | — | | | | | $ | — | | | | | $ | 21,289 | | |
|
Total Assets
|
| | | $ | 21,289 | | | | | $ | — | | | | | $ | — | | | | | $ | 21,289 | | |
|
Derivative
|
| | | $ | — | | | | | $ | — | | | | | $ | (6,640) | | | | | $ | (6,640) | | |
|
Warrants
|
| | | | — | | | | | | — | | | | | | (3,642) | | | | | | (3,642) | | |
|
Total Liabilities
|
| | | $ | — | | | | | $ | — | | | | | $ | (10,282) | | | | | $ | (10,282) | | |
| | | |
December 31, 2024
|
| |||||||||||||||||||||
| | | |
Level 1
|
| |
Level 2
|
| |
Level 3
|
| |
Total
|
| ||||||||||||
|
Cash equivalents
|
| | | $ | 6,146 | | | | | $ | — | | | | | $ | — | | | | | $ | 6,146 | | |
|
Total Assets
|
| | | $ | 6,146 | | | | | $ | — | | | | | $ | — | | | | | $ | 6,146 | | |
|
Warrants
|
| | | $ | — | | | | | $ | — | | | | | $ | (1,308) | | | | | $ | (1,308) | | |
|
Total Liabilities
|
| | | $ | — | | | | | $ | — | | | | | $ | (1,308) | | | | | $ | (1,308) | | |
The following table presents a rollforward of the level 3 warrant liability:
| |
Balance as of December 31, 2024
|
| | | $ | (1,308) | | |
| |
Forfeiture
|
| | | | 436 | | |
| |
Unrealized and realized loss on fair value of warrants for the year ended December 31, 2025
|
| | | | (2,770) | | |
| |
Balance as of December 31, 2025
|
| | | $ | (3,642) | | |
The following table presents a rollforward of the level 3 derivative liability:
| |
Balance as of December 31, 2024
|
| | | $ | — | | |
| |
Unrealized and realized loss on fair value of derivatives for the year ended December 31, 2025
|
| | | | (6,640) | | |
| |
Balance as of December 31, 2025
|
| | | $ | (6,640) | | |
F-21
Centinel Spine, LLC and Subsidiaries
NOTES TO CONSOLIDATED FINANCIAL STATEMENTS (Continued)
(In thousands, except unit and per unit amounts)
(In thousands, except unit and per unit amounts)
2. Basis of Presentation and Summary of Significant Accounting Policies: (Continued)
The change in fair value of warrants and embedded derivatives is not significant for the year ended December 31, 2024.
The Company evaluates assets and liabilities subject to fair value measurements on a recurring and non-recurring basis to determine the appropriate level to classify them for each reporting period. This determination requires significant judgments to be made by the Company.
The estimated fair value of the warrant liability at December 31, 2025 and 2024 was determined using Level 3 inputs. Inherent in an option pricing model are assumptions related to the fair value of the unit, the expected unit-price volatility, term to exit/remaining life, risk-free interest rate and dividend yield. The Company estimates the volatility of its common unit price based on projected volatility of comparable public companies that matches the expected remaining life of the warrants. The risk-free interest rate is based on the U.S. Treasury zero-coupon yield curve on the grant date for a maturity similar to the expected remaining life of the warrants. The expected life of the warrants is based on the remaining restriction period. The dividend rate is based on the historical rate, which the Company anticipates to remain at zero. Significant changes in any of those inputs in isolation would have resulted in a significantly different fair value measurement. The Company recognized the change in fair value of the warrant liability in the consolidated statements of comprehensive income (loss) in other income (expense).
The derivative liability is associated with the 2021 issuances of Promissory Notes Payable (see Note 7). The Company computed the fair value related to the embedded share settlement feature providing for conversion of the notes at a 30% discount to the price of the shares issued in the event of an initial public offering (“IPO”). The Company estimated the fair value using a probability weighted approach and is accounted for at fair value based on significant inputs not observable in the market and thus represents a Level 3 measurement within the fair value hierarchy. The derivative liability was valued using a scenario-based (or probability weighted) approach, and the put options are valued using Black Scholes. The Black-Scholes valuation methodology was used as the Company believes the model embodies all the relevant assumptions that address the features underlying this instrument. Inherent in an embedded derivative model are assumptions related to the fair value of the unit, expected unit-price volatility, risk-free interest rate and dividend yield. As of December 31, 2025 and 2024, the fair value of the embedded derivative is $6,640 and de minimis, respectively. The Company recognized the change in fair value of the derivative liability in the consolidated statements of comprehensive income (loss) in other income (expense).
Change In Control Bonus Plan:
In December 2024, Centinel adopted a Change In Control Bonus Plan (the “CIC Plan”) designed to retain key personnel and incentivize their efforts in connection with a potential change in control transaction involving the Company. A “Change in Control” is broadly defined to include a sale or disposition of substantially all of the Company’s assets, or a merger, consolidation, or reorganization where existing equity holders retain less than 50% voting power of the surviving entity. The CIC Plan could result in payments of up to a maximum of $13.0 million upon a change of control based on the enterprise value. As of December 31, 2025 and 2024, the Company did not accrue the CIC Plan bonus as it was not probable of occurring at the time.
Recently Adopted Accounting Pronouncements
In December 2023, the Financial Accounting Standards Board (“FASB”) issued Accounting Standards Update (“ASU”) 2023-09, “Improvements to Income Tax Disclosures,” which enhances the transparency and decision usefulness of income tax disclosures. The guidance is effective for the Company’s annual reporting period ending December 31, 2025. The adoption of this standard during the year ended December 31, 2025 did not have a material impact on the Company’s financial statements.
F-22
Centinel Spine, LLC and Subsidiaries
NOTES TO CONSOLIDATED FINANCIAL STATEMENTS (Continued)
(In thousands, except unit and per unit amounts)
(In thousands, except unit and per unit amounts)
2. Basis of Presentation and Summary of Significant Accounting Policies: (Continued)
In November 2023, the FASB issued ASU 2023-07, “Improvements to Reportable Segment Disclosures”. This new guidance is intended to improve reportable segment disclosure requirements primarily through enhanced disclosures about significant segment expenses. The Company adopted this ASU in fiscal 2025.
Recent Accounting Pronouncements, Not Yet Effective
In November 2024, the FASB issued ASU 2024-03, “ASC 220- Income Statement—Reporting Comprehensive Income—Expense Disaggregation Disclosures,” which requires entities, in the notes to financial statements, to disclose specified information about certain costs and expenses. The guidance is effective for the Company’s annual periods beginning after December 15, 2026, and interim periods within annual reporting periods beginning after December 15, 2027. Early adoption is permitted. The Company is assessing the impact of adopting this guidance on its financial statements.
In December 2025, the FASB issued ASU 2025-11, “Interim Reporting (Topic 270): Narrow-Scope Improvements” (“ASU 2025-11”). ASU 2025-11 is intended to update the guidance in Topic 270 by improving navigability of the required interim disclosures, clarifying when that guidance is applicable and adding a principle that requires entities to disclose events since the end of the last annual reporting period that have a material impact on the entity. ASU 2025-11 will be effective for the interim reporting periods within annual reporting periods beginning after December 15, 2027, with the option to early adopt at any time prior to the effective date and should be applied either prospectively to financial statements issued for reporting periods after the effective date or retrospectively to any or all prior periods presented in the financial statements. The Company is assessing the impact of adopting this guidance on its financial statements.
3. Property and Equipment, net:
Property and equipment consist of the following at December 31:
| | | |
Useful Life (Years)
|
| |
2025
|
| |
2024
|
| |||||||||
|
Machinery, furniture, and equipment
|
| | | | 5 | | | | | $ | 755 | | | | | $ | 652 | | |
|
Computer software
|
| | | | 3 | | | | | | 81 | | | | | | 81 | | |
|
Instrument sets and medical models
|
| | | | 3 | | | | | | 30,778 | | | | | | 24,415 | | |
| | | | | | | | | | | | 31,614 | | | | | | 25,148 | | |
|
Accumulated depreciation
|
| | | | | | | | | | (24,338) | | | | | | (20,018) | | |
| | | | | | | | | | | $ | 7,276 | | | | | $ | 5,130 | | |
Depreciation expense for the years ended December 31, 2025 and 2024 was $3,695 and $3,196, respectively.
4. Intangibles, net:
Intangible assets as of December 31, 2025 included the following:
| | | |
Useful Life (Years)
|
| |
Gross Carrying
Amount |
| |
Accumulated
Amortization |
| |
Intangible Assets,
net |
| ||||||||||||
|
Trademarks / trade names
|
| | | | 17–25 | | | | | $ | 7,796 | | | | | $ | (3,360) | | | | | $ | 4,436 | | |
|
Patents
|
| | | | 8–15 | | | | | | 5,631 | | | | | | (5,619) | | | | | | 12 | | |
|
Surgeon relationships
|
| | | | 17–25 | | | | | | 3,532 | | | | | | (2,354) | | | | | | 1,178 | | |
| | | | | | | | | | | $ | 16,959 | | | | | $ | (11,333) | | | | | $ | 5,626 | | |
F-23
Centinel Spine, LLC and Subsidiaries
NOTES TO CONSOLIDATED FINANCIAL STATEMENTS (Continued)
(In thousands, except unit and per unit amounts)
(In thousands, except unit and per unit amounts)
4. Intangibles, net: (Continued)
Intangible assets as of December 31, 2024 included the following:
| | | |
Useful Life (Years)
|
| |
Gross Carrying
Amount |
| |
Accumulated
Amortization |
| |
Intangible Assets,
net |
| ||||||||||||
|
Trademarks / trade names
|
| | | | 17–25 | | | | | $ | 7,549 | | | | | $ | (2,872) | | | | | $ | 4,677 | | |
|
Patents
|
| | | | 8–15 | | | | | | 5,482 | | | | | | (5,355) | | | | | | 127 | | |
|
Surgeon relationships
|
| | | | 17–25 | | | | | | 3,432 | | | | | | (2,084) | | | | | | 1,348 | | |
| | | | | | | | | | | $ | 16,463 | | | | | $ | (10,311) | | | | | $ | 6,152 | | |
Amortization expense was $752 and $957 for the years ended December 31, 2025 and 2024, respectively.
At December 31, 2025, the weighted average useful life of amortizable assets is projected to be:
| | | |
Weighted Average Remaining Life (Years)
|
| |||
|
Trademarks / trade names
|
| | | | 11.20 | | |
|
Patents
|
| | | | 0.11 | | |
|
Surgeon relationships
|
| | | | 10.98 | | |
Amortization expense is estimated to be the following over the next five years:
| |
2026
|
| | | $ | 622 | | |
| |
2027
|
| | | | 602 | | |
| |
2028
|
| | | | 582 | | |
| |
2029
|
| | | | 562 | | |
| |
2030
|
| | | | 541 | | |
| |
Thereafter
|
| | | | 2,717 | | |
| | | | | | $ | 5,626 | | |
5. Note Payable, net:
Loan Agreement:
The Company entered into a Loan Agreement dated as of March 8, 2021, with Innovatus Life Sciences Lending Fund I, LP (“Innovatus”), pursuant to which the Company borrowed $54,000. The loan agreement had a maturity date of March 1, 2026 and required monthly principal and interest payments of $2,056 beginning April 2024, which was amended to February 2025, through maturity.
The amounts outstanding under the Loan Agreement accrue interest at the floating per annum rate of interest equal to the sum of (a) the greater of (i) Prime Rate or (ii) 3.25%, and (b) 7.25% or upon the satisfaction of certain conditions described in the Loan Agreement, 6.5%. The Company issued Innovatus warrants to purchase 1,262,237 Redeemable Convertible Class B Preferred Units. The warrants have an exercise price of $1.39435 and will expire ten years from the effective date of the warrant issuance. In addition, the Company was required to pay a final fee upon maturity or prepayment that increased in the event the Company elected to cancel the warrants. The Company amortized the final fee to interest expense over the term of the Loan Agreement.
Total financing costs related to the Loan Agreement amounted to $1,693 which have been deferred and presented net against the related debt in the accompanying Consolidated Balance Sheets. The debt issuance
F-24
Centinel Spine, LLC and Subsidiaries
NOTES TO CONSOLIDATED FINANCIAL STATEMENTS (Continued)
(In thousands, except unit and per unit amounts)
(In thousands, except unit and per unit amounts)
5. Note Payable, net: (Continued)
costs are amortized into interest expense over the period of the related debt. Amortization of these costs during the years ended December 31, 2025 and 2024 were $39 and $278, respectively, which were recorded as interest expense.
On February 25, 2025, the Company entered into a new secured loan agreement (the “Senior Loan Agreement”) which proceeds were used to repay the outstanding Loan Agreement. The Company repaid in full its Loan Agreement with an outstanding principal balance of $36,500, paid related fees and expenses including accumulated paid-in-kind interest of $3,479 and a final fee of $5,130. The final fee was related to an amount due upon payment plus an amount related to the cancellation of the outstanding warrants held by Innovatus. In connection with this repayment, the Company incurred total debt extinguishment costs of $2,098, which primarily related to the final fees paid to lenders.
These costs were recognized as a loss on extinguishment of debt and are included in “Loss on extinguishment of debt” in the consolidated statements of comprehensive income (loss) for the year ended December 31, 2025.
The extinguishment resulted in the termination of all obligations under the Loan Agreement.
Senior Loan Agreement:
On February 25, 2025, the Company entered into a senior secured loan agreement (“Senior Loan Agreement”) with credit funds managed by SLR Capital Partners, LLC (“SLR”) to provide the Company with $60 million of capital. On February 25, 2025, the Company also entered into a credit agreement, with Gemino Healthcare Finance, LLC d/b/a SLR Healthcare ABL, or Gemino, pursuant to which the Company may borrow up to $5 million in revolving loans and may request Gemino to increase the amount up to an aggregate amount of $10 million (“Revolving Loans”). The proceeds from the initial funding of the Senior Loan Agreement were used to retire the Company’s existing Loan Agreement, pay related fees and expenses, and provide additional working capital. The borrowings under the Senior Loan Agreement are secured by substantially all of the Company’s assets.
The Senior Loan Agreement has a term of five years and has a floating interest rate per annum equal to the Term SOFR plus 5.30% and the Revolving Loans accrue interest at a floating interest rate per annum equal to the Term SOFR plus 3.95%. Beginning in March 2028, the Company is required to make monthly principal payments of $2,500 through maturity on February 25, 2030. At maturity, the Company is required to pay a final fee of $3.0 million. The final fee is being amortized to interest expense over the term of the Senior Loan Agreement. Upon occurrence of certain specified events, including an initial public offering, the Company will be required to pay an exit fee of $1.8 million. In addition, the Senior Loan Agreement includes a revenue covenant that requires the Company to maintain a minimum trailing six-month net product revenue. The Company was in compliance with such covenant as of December 31, 2025.
Total financing costs related to the Loan Agreement amounted to $2,300 which have been deferred and presented net against the related debt in the accompanying Consolidated Balance Sheets. The debt issuance costs are amortized into interest expense over the period of the related debt. Amortization of these costs during the years ended December 31, 2025 were $389, which were recorded as interest expense.
As of December 31, 2025 the principal outstanding loan payable of $60,000, accumulated final fee of $898, net of unamortized financing fee of $1,912, are presented as notes payable on the Company’s consolidated balance sheet.
F-25
Centinel Spine, LLC and Subsidiaries
NOTES TO CONSOLIDATED FINANCIAL STATEMENTS (Continued)
(In thousands, except unit and per unit amounts)
(In thousands, except unit and per unit amounts)
6. Convertible Promissory Notes Payable:
On March 29, 2021, the Company entered into a convertible promissory note agreement, and subsequent amendments, (as amended, the “Note Agreement”) with Vision Biobanc pursuant to which the Company borrowed $10,000 evidenced by the Convertible Notes. The Convertible Note had an initial term of five years which was amended in conjunction with the new Senior Loan Agreement for an additional four and a half years, is unsecured and is subordinated to the obligations owing to SLR under the Senior Loan Agreement and previously Innovatus under the Loan Agreement. The outstanding principal amount of the Convertible Note accrues interest at 6.0% per year, compounded and payable quarterly, except that under the subordination agreement between SLR and Vision Biobanc, the Company may only pay one-half of the interest in cash, provided the Company is not in default under the SLR Senior Loan Agreement, and must defer payment of the other half. The Company paid cash interest of $0 and $226 for the years ended December 31, 2025 and 2024 respectively.
Vision Biobanc has the option of converting the outstanding principal amount of the Convertible Note and accrued and unpaid interest thereon into Redeemable Convertible Class B Preferred Units of the Company at a price per unit equal to $1.39435. On February 20, 2025, Vision Biobanc elected to convert the accrued and unpaid interest into Redeemable Convertible Class B Preferred Units of the Company at a price per unit equal to $1.39435. As a result, in 2025, $1,842 of outstanding and unpaid interest was converted to 1,321,572 Class B Preferred Units.
The outstanding principal amount of the Convertible Note and accrued interest thereon will automatically convert into Redeemable Convertible Class B Preferred Units prior to the completion of a qualified public offering.
Total financing costs related to the Note Agreement amounted to $94 which have been deferred and presented net against the related debt in the accompanying Consolidated Balance Sheets. The debt issuance costs will be amortized into interest expense over the period of the related debt.
As of December 31, 2025 the principal outstanding on the Convertible Note of $10,000 is presented as convertible notes payable, net of accumulated interest and unamortized financing fees, on the Company’s consolidated balance sheet.
In November 2021, the Company entered into an agreement (“The Subordinated Convertible Note Agreement”) with various investors, including certain of our officers, directors and entities controlled by certain of our directors, pursuant to which it issued the first tranche of subordinate convertible promissory notes (the “Subordinated Convertible Promissory Notes”) to various investors, with subsequent issuances through May 2024. The interest rate on the Subordinated Convertible Promissory Notes are subject to increases to match any greater interest rate agreed upon by the Company in subsequent issuances of subordinated convertible promissory notes. The current interest rate on these Notes is 4.42%. As of December 31, 2025 and 2024, the amount of Subordinated Convertible Promissory Notes held by our officers, directors, and entities controlled by certain of our directors was $36,919.
F-26
Centinel Spine, LLC and Subsidiaries
NOTES TO CONSOLIDATED FINANCIAL STATEMENTS (Continued)
(In thousands, except unit and per unit amounts)
(In thousands, except unit and per unit amounts)
6. Convertible Promissory Notes Payable: (Continued)
The maturity dates for the various tranches of outstanding Subordinated Convertible Promissory Notes issued through December 31, 2025 are as follows:
| | | |
Tranche Amount
|
| |
Maturity Date
|
| | | | |||
| | | | | $ | 5,200 | | | |
November 2030
|
| | | |
| | | | | | 7,000 | | | |
December 2030
|
| | | |
| | | | | | 10,659 | | | |
April 2031
|
| | | |
| | | | | | 250 | | | |
May 2031
|
| | | |
| | | | | | 4,466 | | | |
July 2031
|
| | | |
| | | | | | 980 | | | |
March 2032
|
| | | |
| | | | | | 10,000 | | | |
April 2032
|
| | | |
| | | | | | 6,250 | | | |
March 2033
|
| | | |
| | | | | | 250 | | | |
April 2033
|
| | | |
| | | | | | 994 | | | |
May 2033
|
| | | |
| | | | | $ | 46,049 | | | | | | | | |
For all Subordinated Convertible Promissory Notes issued, the holders of the Subordinated Convertible Promissory Notes have the option of converting the outstanding principal amount of the Subordinated Convertible Promissory Notes and accrued and unpaid interest thereon at any time into Redeemable Convertible Class B Preferred Units of the Company at a price per unit equal to $1.39435.
Additionally, such holders have the option to convert the outstanding principal amount of the Subordinated Convertible Promissory Notes and accrued and unpaid interest thereon to equity interests under a newly-created preferred unit class, should the Company issue new preferred units subsequent to November 17, 2021 at a conversion price equal to the lowest purchase price of the new preferred units minus a discount described in the Subordinated Convertible Promissory Notes Agreement. The outstanding principal amount of the Subordinated Convertible Promissory Notes and accrued and unpaid interest thereon will automatically convert into the same type of security issued in connection with a public offering at a conversion price equal to a thirty percent discount to the purchase price of the security issued in such public offering. This feature has been accounted for as an embedded derivative (see Note 2).
As of December 31, 2025 the principal outstanding on the Subordinated Convertible Promissory Notes of $46,049 and the accumulated paid-in-kind interest, of $5,927, are presented as convertible notes payable, net of unamortized financing fees of $896, on the Company’s consolidated balance sheet.
7. Credit Agreement:
The Company entered into an agreement (“Subordinated Credit Agreement”) dated as of April 18, 2023, with entities and a trust controlled by some of our equity holders and board observers under which term loans in an aggregate principal amount equal to $5,250 and an initial interest rate of 10%, which shall be payable in-kind, were issued (the “Term Loans”). Each lender under the Subordinated Credit Agreement was issued warrants, or the Class B Warrants, to purchase Class B Preferred Units at an exercise price of $0.01. The Class B Warrants provide the lenders holding such warrants the right to purchase, in the aggregate, 564,779 Class B Preferred Units.
In the event of any repayment of the Term Loans, an initial amount equal to $7,875 minus the aggregate amount of interest accrued will be payable to the Term Loan investors (“Make-Whole amount”).
F-27
Centinel Spine, LLC and Subsidiaries
NOTES TO CONSOLIDATED FINANCIAL STATEMENTS (Continued)
(In thousands, except unit and per unit amounts)
(In thousands, except unit and per unit amounts)
7. Credit Agreement: (Continued)
Total financing costs and origination costs related to the Term Loans agreements issued in 2023 amounted to $182 which have been deferred and presented net against the related debt in the accompanying consolidated balance sheet. The debt issuance costs will be amortized as interest expense over the period of the related debt.
On February 25, 2025, the Company entered into Amendment No. 1 to its Subordinated Credit Agreement with certain lenders under which the Term Loans were modified (the “New Term Loans”). The New Term Loans extended the maturity date to September 30, 2030 and revised the make-whole provisions to a multiple-based construct with the following Make-Whole Multiples: (i) through August 31, 2026, 2.50; (ii) September 1, 2026 to August 31, 2027, 2.75; (iii) September 1, 2027 to August 31, 2028, 3.00; (iv) September 1, 2028 to August 31, 2029, 3.25; and (v) thereafter, 3.50. All other material terms, including 10% per annum PIK interest, repayment ordering, subordination to Senior Loan Agreement, and lender origination fees, remained unchanged.
The Term Loans bear interest at 10% per annum, payable in kind by adding accrued interest to principal annually on each loan’s anniversary date. The loans are repayable on the earlier of maturity or the occurrence of a Repayment Trigger Event, which includes (i) a sale of the Company, (ii) an initial public offering of the Company or its successor, or (iii) a refinancing of the Senior Debt. Notwithstanding the foregoing, no principal, interest, or make-whole amounts are payable until full payment of the Senior Debt, in accordance with the subordination provisions.
Upon repayment, the Company is required to pay the “Make-Whole Amount,” defined as the product of $5,250 and the applicable Make-Whole Multiple then in effect, less $5,250, less the aggregate amount of interest accrued on the loans from origination to the repayment date.
The effective interest rates (the “EIR”) on the New Term Loans ranges from 10.44%—10.78%.
The Company recognizes interest expense for each New Term Loan using the effective interest method based on the applicable EIR and opening amortized cost basis. The Company accretes 10% PIK interest and the contractual Make-Whole Amount as non-cash increases to the New Term Loans balance over the remaining term. Premium amortization is recognized within interest expense as the difference between EIR-based interest expense and the combined contractual accretion for PIK and Make-Whole Amount.
On December 31, 2025, the principal amount outstanding under the New Term Loans is $5,250, accumulated paid-in-kind interest $1,522, accrued make-whole amount is $1,028 and unamortized premium is $4,072, resulting in a net carrying amount of $11,872, which is presented as “Notes payable, net” within noncurrent liabilities.
Principal payments are not due until the New Term Loans mature in 2030.
Upon repayment (at maturity or upon a Repayment Trigger Event), accrued and unpaid paid-in-kind interest through the repayment date and the contractual Make-Whole amount, if any, will also be due in accordance with the Subordinated Credit Agreement, as amended.
The Company evaluated the amendment under the debt modification and extinguishment guidance and concluded it resulted in an extinguishment of the Term Loans. The Company derecognized the old debt (aggregate carrying amount of $9,390), recognized the New Term Loans at fair value of $10,750, and recorded a loss on extinguishment of debt of $1,360 for the year ended December 31, 2025, presented as “Loss on extinguishment of debt” in the statement of comprehensive income (loss).
F-28
Centinel Spine, LLC and Subsidiaries
NOTES TO CONSOLIDATED FINANCIAL STATEMENTS (Continued)
(In thousands, except unit and per unit amounts)
(In thousands, except unit and per unit amounts)
8. Accrued Expenses:
Accrued expenses are comprised of the following as of December 31:
| | | |
2025
|
| |
2024
|
| ||||||
|
Accrued employee compensation & benefits
|
| | | $ | 3,784 | | | | | $ | 1,818 | | |
|
Accrued commissions & royalties
|
| | | | 8,677 | | | | | | 5,840 | | |
|
Clinical study accrual
|
| | | | 1,289 | | | | | | 2,813 | | |
|
Accrued professional services
|
| | | | 782 | | | | | | 512 | | |
|
Accrued interest payable
|
| | | | 63 | | | | | | 186 | | |
|
Accrued other liabilities
|
| | | | 989 | | | | | | 1,241 | | |
|
Total
|
| | | $ | 15,584 | | | | | $ | 12,410 | | |
9. Member’s Equity:
Capital Structure:
Centinel Spine, LLC was authorized to issue 280,952,833 units of which (a) 66,518,221 units are Redeemable Convertible Class A Preferred Units (including 717,178 Units of VB Fee Redeemable Convertible Class A Preferred Units), (b) 47,566,535 are Redeemable Convertible Class B Preferred Units, (c) 149,387,822 Units are Common units, (d) 1 unit is a Redeemable Convertible Special Member Unit, and (e) 17,480,254 units are Incentive Units. The number of authorized units is not fixed and increases automatically in accordance with the operating agreement upon the execution of conversions in accordance with the terms of certain debt instruments. The number of units authorized are sufficient to accommodate any unissued common units to provide for the conversion of all outstanding Redeemable Convertible Class A Preferred Units (including any Redeemable Convertible Class A Preferred Units underlying the outstanding warrants), Redeemable Convertible Class B Preferred Units and the exercise of all outstanding options and warrants to purchase Common units.
During the year ended December 31, 2025, Vision Biobanc converted outstanding and unpaid interest to 1,321,572 Class B Preferred Units (Note 6). As of December 31, 2025, Centinel Spine, LLC was authorized to issue 283,595,977 units of which (a) 66,518,221 units are Redeemable Convertible Class A Preferred Units (including 717,178 Units of VB Fee Redeemable Convertible Class A Preferred Units), (b) 48,888,107 are Redeemable Convertible Class B Preferred Units, (c) 150,709,394 Units are Common units, (d) 1 unit is a Redeemable Convertible Special Member Unit, and (e) 17,480,254 units are Incentive Units.
During the year ended December 31, 2025, a common unit holder voluntarily cancelled 3,265,653 Common units for no cash consideration.
The VB Fee Redeemable Convertible Class A Preferred Units are intended to be treated as profit interests for income tax purposes but maintain the same rights and preferences as the Redeemable Convertible Class A Preferred Units. The VB Fee Redeemable Convertible Class A Preferred Units are included in the disclosures below for Redeemable Convertible Class A Preferred Units unless otherwise noted.
The holders of the issued warrants will be treated as members with respect to Redeemable Convertible Class A Preferred Units underlying the warrants only if, when, and to the extent the warrants are exercised and the applicable Redeemable Convertible Class A Preferred Units are issued to such holder. There are 3,227,300 warrants with an exercise price of $1.39435 outstanding at December 31, 2025.
The Redeemable Convertible Class A Preferred Units, Redeemable Convertible Class B Preferred Units and Redeemable Convertible Special Member Unit are classified as temporary, or mezzanine, equity on the accompanying consolidated balance sheets since the units contained certain conversion and redemption
F-29
Centinel Spine, LLC and Subsidiaries
NOTES TO CONSOLIDATED FINANCIAL STATEMENTS (Continued)
(In thousands, except unit and per unit amounts)
(In thousands, except unit and per unit amounts)
9. Member’s Equity: (Continued)
features that are not solely within the control of the Company. The Company has not accreted the Redeemable Convertible Preferred Units to their redemption values since the units are not currently redeemable and redemption is not deemed to be probable.
Voting:
Common unit holders are entitled to one vote per common unit. Redeemable Convertible Class A Preferred Unit, not including the VB Fee Redeemable Convertible Class A Preferred Unit, and Redeemable Convertible Class B Preferred Unit holders are entitled to one vote per common unit as if such units are converted to common units. The Redeemable Convertible Special Member unit holder does not have the right to vote. The VB Fee Redeemable Convertible Class A Preferred Units holders do not have the right to vote. The Incentive Units holders do not have the right to vote.
Conversion:
All Redeemable Convertible Preferred Units shall be convertible after the issuance of such Redeemable Convertible Preferred Unit upon the election of the majority preferred investors (means the preferred unit holders, collectively, holding at least a majority of the aggregate number of outstanding Redeemable Convertible Class A Preferred Units and Redeemable Convertible Class B Preferred Units (or converted common units) then-held by all Preferred Members (other than with respect to any VB Fee Redeemable Convertible Class A Preferred Units)).
Each Redeemable Convertible Preferred Unit shall automatically be converted into Common Units at the then-applicable conversion price upon the occurrence of a public offering where the Company receives aggregate gross proceeds in an amount equal to or more than $75,000 and at a price per share of common stock to be issued in such public offering of no less than $2.79 per share after giving effect to the conversion or reorganization of the Company into another entity form and subject to appropriate adjustments in the event of any equity split, equity dividend, recapitalization, combination or similar transaction (a “Qualified Public Offering”).
Redeemable Convertible Class A Preferred Units are convertible to common units by dividing the initial unit value on December 19, 2017 subject to adjustment by the conversion price, as defined, at the time of conversion. Redeemable Convertible Class B Preferred Units are convertible to common units by dividing the initial unit value on March 30, 2020 subject to adjustment by the conversion price, as defined, at the time of conversion.
Upon Board approval of an entity conversion, change in control or Qualified Public Offering, the Redeemable Convertible Special Membership Unit shall be converted into shares of a class of common stock of the Company (or such converted entity) junior to the common stock of the Company (or such converted entity).
Distributions, Liquidation and Redemption:
Periodic distributions including those made upon any company sale, entity conversion or company liquidation will be made in order of priority as such: (a) 100% pro rata to Redeemable Convertible Class B Preferred Unit holders’ contributions, (b) Redeemable Convertible Class A Preferred Unit holders to the extent of such unit holders’ contributions, then (c) the unconverted-basis Redeemable Convertible Special Member, and then (d) Common unit holders and Incentive unit holders in proportion to their number of vested units held. If the Redeemable Convertible Class A Preferred Unit and Redeemable Convertible Class B Preferred Unit holders had already converted their units to common units, they continue to maintain respective preferences. The Special Membership Unit earns a yield of 8% per year.
F-30
Centinel Spine, LLC and Subsidiaries
NOTES TO CONSOLIDATED FINANCIAL STATEMENTS (Continued)
(In thousands, except unit and per unit amounts)
(In thousands, except unit and per unit amounts)
9. Member’s Equity: (Continued)
Redemption of the Redeemable Convertible Class A, Redeemable Convertible Class B units and Redeemable Convertible Special Member Unit will occur upon liquidation of the Company. There are no redemption features at the option of the holder.
Certain of Member’s units in Centinel Spine LLC are subject to certain buy back provisions as outlined in the Operating Agreement giving Centinel first refusal to purchase back such units.
Term:
Centinel’s term shall continue until dissolved in accordance with Article IX of the Operating Agreement and for as long as is reasonably necessary for winding up the business.
10. Unit-based compensation:
Centinel has a unit incentive option plan that provides the Company’s compensation committee with the ability to issue options to purchase units to employees, officers, directors and consultants of the Company. Units that are expired, forfeited, canceled or otherwise terminated without having been fully exercised will be available for future grant under the plan. As of December 31, 2025 there were 17,480,254 units of incentive units authorized and 2,046,615 units available for issuance under the plan.
| | | |
Options Outstanding
|
| | | | ||||||||||||||||||||||||
| | | |
Units Available
for Grant |
| |
Number of Units
|
| |
Weighted
Average Exercise Price |
| |
Weighted
Average Remaining Contractual Life (in years) |
| |
Aggregate
intrinsic value |
| |||||||||||||||
|
Balances, January 1, 2024
|
| | | | 2,520,270 | | | | | | 13,687,558 | | | | | $ | 0.32 | | | | | | 6.52 | | | | | | | | |
|
Units granted
|
| | | | (991,000) | | | | | | 991,000 | | | | | | 0.21 | | | | | | | | | | | | | | |
|
Units exercised
|
| | | | — | | | | | | (33,188) | | | | | | 0.39 | | | | | | | | | | | | | | |
|
Units forfeited/cancelled/expired
|
| | | | 363,718 | | | | | | (363,718) | | | | | | 0.32 | | | | | | | | | | | | | | |
|
Balances, December 31, 2024
|
| | | | 1,892,988 | | | | | | 14,281,652 | | | | | $ | 0.31 | | | | | | 5.91 | | | | | | | | |
|
Units granted
|
| | | | (272,500) | | | | | | 272,500 | | | | | $ | 0.14 | | | | | | | | | | | | | | |
|
Units exercised
|
| | | | — | | | | | | (132,373) | | | | | | 0.34 | | | | | | | | | | | | | | |
|
Units forfeited/cancelled/expired
|
| | | | 426,127 | | | | | | (426,127) | | | | | | 0.34 | | | | | | | | | | | | | | |
|
Balances, December 31, 2025
|
| | | | 2,046,615 | | | | | | 13,995,652 | | | | | $ | 0.31 | | | | | | 5.04 | | | | | $ | 10,970 | | |
|
Vested and exercisable at December 31, 2025
|
| | | | | | | | | | 11,194,282 | | | | | $ | 0.32 | | | | | | 4.75 | | | | | $ | 8,573 | | |
The weighted average grant date fair value of unit options granted during the years ended December 31, 2025 and 2024 was $0.10 and $0.15, respectively.
Unit-Based Compensation:
Employee options generally vest over four years where 25% vest upon the first anniversary of the issuance date and 1/12th per quarter thereafter. As of December 31, 2025, there were total unrecognized compensation costs of $66 related to employee unit option awards. The unrecognized compensation cost as of December 31, 2025 is expected to be recognized over a weighted-average amortization period of 2.3 years.
F-31
Centinel Spine, LLC and Subsidiaries
NOTES TO CONSOLIDATED FINANCIAL STATEMENTS (Continued)
(In thousands, except unit and per unit amounts)
(In thousands, except unit and per unit amounts)
10. Unit-based compensation: (Continued)
The following table summarizes the components of unit-based compensation expense recorded in the Company’s statement of comprehensive income (loss):
| | | |
For the years ended December 31,
|
| |||||||||
| | | |
2025
|
| |
2024
|
| ||||||
|
Selling and marketing expenses
|
| | | $ | 38 | | | | | $ | 52 | | |
|
General and administrative expenses
|
| | | | 82 | | | | | | 157 | | |
|
Research and development expenses
|
| | | | 15 | | | | | | 20 | | |
|
Total unit -based compensation
|
| | | $ | 135 | | | | | $ | 229 | | |
The Company estimated the fair value of unit options using the Black-Scholes options valuation model. The fair value of employee unit options is being amortized on a straight-line basis. The fair value of employee unit options was estimated using the following assumptions:
| | | |
2025
|
| |
2024
|
|
|
Risk-free interest rate
|
| |
3.75%–4.06%
|
| |
3.66%–4.23%
|
|
|
Expected term (in years)
|
| |
6.25
|
| |
6.25
|
|
|
Dividend yield
|
| |
0%
|
| |
0%
|
|
|
Expected volatility
|
| |
79.0%–79.5%
|
| |
78.7%–78.9%
|
|
Risk free interest rate: The risk-free rate is based on the U.S. Treasury yields in effect at the time of grant for periods corresponding with the expected term of the option.
Expected term: The Company uses the simplified method to calculate expected term described in the Securities and Exchange Commission’s Staff Accounting Bulletin No. 107, which takes into account vesting term and expiration date of the options.
Dividend yield: The Company has never declared or paid any cash dividends and does not plan to pay cash dividends in the foreseeable future, and therefore, used an expected dividend yield of zero in the valuation model.
Expected volatility: Volatility is based on an average of the historical volatilities of comparable publicly traded companies for the expected term.
Fair value per unit: The fair values per unit is determined by our board of directors as of the date of each grant based on the independent third-party valuations, taking into consideration various objective and subjective factors.
Forfeitures: The Company accounts for forfeitures when they occur. Ultimately, the actual expense recognized over the vesting period will be for only those units that vest.
11. Income Taxes:
The Company is a U.S. limited liability company classified as a partnership for income tax purposes and is therefore not a taxable entity in the U.S. and in many state jurisdictions. The Company is subject to state income taxes imposed directly on partnerships in certain state jurisdictions and the Company’s foreign subsidiaries are subject to corporate income taxes in their respective country of organization.
F-32
Centinel Spine, LLC and Subsidiaries
NOTES TO CONSOLIDATED FINANCIAL STATEMENTS (Continued)
(In thousands, except unit and per unit amounts)
(In thousands, except unit and per unit amounts)
11. Income Taxes: (Continued)
The Company had loss before taxes and income tax expense as follows as of December 31, 2025 and 2024, respectively:
| | | |
2025
|
| |
2024
|
| ||||||
| Income before taxes | | | | | | | | | | | | | |
|
U.S.
|
| | | $ | (4,548) | | | | | $ | (6,743) | | |
|
Non-U.S.
|
| | | | 456 | | | | | | (5,482) | | |
| | | | | $ | (4,092) | | | | | $ | (12,225) | | |
| | | |
2025
|
| |
2024
|
| ||||||
| Income tax expense (benefit) | | | | | | | | | | | | | |
| Current: | | | | | | | | | | | | | |
|
Federal
|
| | | $ | — | | | | | $ | — | | |
|
State
|
| | | | 90 | | | | | | 55 | | |
|
Foreign
|
| | | | 63 | | | | | | (155) | | |
|
Total current
|
| | | | 153 | | | | | | (100) | | |
| Deferred: | | | | | | | | | | | | | |
|
Federal
|
| | | | — | | | | | | — | | |
|
State
|
| | | | — | | | | | | — | | |
|
Foreign
|
| | | | 76 | | | | | | (2) | | |
|
Total deferred
|
| | | | 76 | | | | | | (2) | | |
|
Total Tax Expense (benefit)
|
| | | $ | 229 | | | | | $ | (102) | | |
The U.S. federal statutory income tax rate is reconciled to the effective rate as follows.
| | | |
2025
|
| |
2024
|
| ||||||||||||||||||
| | | |
Amount
|
| |
Percentage
|
| |
Amount
|
| |
Percentage
|
| ||||||||||||
|
U.S. federal statutory tax rate
|
| | | $ | (859) | | | | | | 21.0% | | | | | $ | (2,567) | | | | | | 21.0% | | |
|
State and local taxes, net of federal benefit(a)
|
| | | | 71 | | | | | | (1.8)% | | | | | | 44 | | | | | | (0.4)% | | |
| Foreign tax effects | | | | | | | | | | | | | | | | | | | | | | | | | |
|
Switzerland
|
| | | | | | | | | | | | | | | | | | | | | | | | |
|
Change in valuation allowance
|
| | | | (1,241) | | | | | | 30.3% | | | | | | 663 | | | | | | (5.4)% | | |
|
Statutory tax rate difference
|
| | | | 26 | | | | | | (0.6)% | | | | | | 516 | | | | | | (4.2)% | | |
|
Net operating loss expiration
|
| | | | 1,215 | | | | | | (29.7)% | | | | | | — | | | | | | 0.0% | | |
|
Germany
|
| | | | | | | | | | | | | | | | | | | | | | | | |
|
Amended return
|
| | | | — | | | | | | 0.0% | | | | | | (238) | | | | | | 1.9% | | |
|
Other
|
| | | | 30 | | | | | | (0.7)% | | | | | | 11 | | | | | | (0.1)% | | |
|
Australia
|
| | | | 26 | | | | | | (0.6)% | | | | | | 24 | | | | | | (0.2)% | | |
| Nontaxable or nondeductible items | | | | | | | | | | | | | | | | | | | | | | | | | |
|
Partnership income not subject to tax
|
| | | | 974 | | | | | | (23.8)% | | | | | | 1,428 | | | | | | (11.7)% | | |
|
Other
|
| | | | (13) | | | | | | 0.3% | | | | | | 17 | | | | | | (0.1)% | | |
| | | | | $ | 229 | | | | | | (5.6)% | | | | | $ | (102) | | | | | | 0.8% | | |
(a)
During the years ended December 31, 2025 and December 31, 2024, state taxes in Texas comprised a majority (greater than 50%) of the tax effect in this category.
F-33
Centinel Spine, LLC and Subsidiaries
NOTES TO CONSOLIDATED FINANCIAL STATEMENTS (Continued)
(In thousands, except unit and per unit amounts)
(In thousands, except unit and per unit amounts)
11. Income Taxes: (Continued)
Cash paid for income taxes, net of refunds, during the tax years ended December 31, 2025 and December 31, 2024 were as follows:
| | | |
Year Ended December 31,
|
| |||||||||
| | | |
2025
|
| |
2024
|
| ||||||
| Income taxes paid and refunds: | | | | | | | | | | | | | |
|
State and local taxes paid, net of refunds
|
| | | $ | 90 | | | | | $ | 67 | | |
|
Foreign taxes paid, net of refunds
|
| | | | 275 | | | | | | 158 | | |
|
Income taxes paid, net of refunds
|
| | | $ | 365 | | | | | $ | 225 | | |
The Company had deferred tax assets and liabilities as follows as of December 31, 2025 and 2024, respectively:
| | | |
2025
|
| |
2024
|
| ||||||
|
Net operating loss
|
| | | $ | 6,956 | | | | | $ | 7,515 | | |
|
Other deferred tax asset
|
| | | | 7 | | | | | | 2 | | |
|
Gross deferred tax asset
|
| | | | 6,963 | | | | | | 7,517 | | |
|
(Less) valuation allowance
|
| | | | (6,883) | | | | | | (7,030) | | |
|
Net deferred tax asset
|
| | | | 80 | | | | | | 487 | | |
|
Amortization
|
| | | | (1,611) | | | | | | (1,422) | | |
|
Other deferred tax liability
|
| | | | (133) | | | | | | (476) | | |
|
Deferred tax liability
|
| | | | (1,744) | | | | | | (1,898) | | |
|
Net deferred tax liability
|
| | | $ | (1,664) | | | | | $ | (1,411) | | |
Deferred tax valuation allowance:
| | | |
Beginning
Balance |
| |
Additions
|
| |
Deductions
|
| |
Ending
Balance |
| ||||||||||||
|
Year ended December 31, 2025
|
| | | $ | 7,030 | | | | | $ | 149 | | | | | $ | (296) | | | | | $ | 6,883 | | |
|
Year ended December 31, 2024
|
| | | $ | 6,853 | | | | | $ | 177 | | | | | | | | | | | $ | 7,030 | | |
Centinel Spine Schweiz GmbH had net operating losses of approximately $57,670 and $63,468, as of December 31, 2025, and 2024, respectively. These net operating losses will begin to expire in 2026. Centinel Spine Australia Pty Ltd had net operating losses of zero and approximately $85 as of December 31, 2025, and 2024, respectively. These net operating losses carryforward indefinitely.
In assessing the realization of deferred tax assets, management considers whether it is more likely than not that all or some portion of the deferred tax assets will not be realized. The ultimate realization of the deferred tax assets is dependent on the generation of future taxable income during the period in which temporary differences are deductible and net operating losses are utilized. Based on consideration of these factors, the company provided a valuation allowance of approximately $6,883 and $7,030, as of December 31, 2025 and 2024, respectively. In analyzing deferred tax liabilities as a source of potential income for recognizing deferred tax assets, the deferred tax liabilities related to excess book basis in goodwill over tax basis in goodwill were considered a source of income for benefiting deferred tax assets with indefinite lives only due to the indefinite life and uncertain reversal of these liabilities.
On July 4, 2025, the U.S. government enacted the One Big Beautiful Bill Act (the “OBBBA”) which extends certain business tax provisions of the 2017 Tax Cuts and Jobs Act. These provisions include the reinstatement of 100% bonus depreciation for qualifying property, full and immediate expensing of domestic research and development expenditures, and changes to the calculation of the business interest expense limitation.
F-34
Centinel Spine, LLC and Subsidiaries
NOTES TO CONSOLIDATED FINANCIAL STATEMENTS (Continued)
(In thousands, except unit and per unit amounts)
(In thousands, except unit and per unit amounts)
11. Income Taxes: (Continued)
As of December 31, 2025 and 2024, there were no material undistributed earnings of the Company’s foreign subsidiaries and, as such, the Company has not provided a deferred tax liability for undistributed earnings.
CS Swiss Holdings, LLC is also a U.S. limited liability company, but which is treated as a disregarded entity for most U.S. income tax purposes. Its earnings or losses for federal and most state purposes are included in the taxable income reportable by Centinel to its members.
Centinel Spine Schweiz GmbH, Centinel Spine GmbH and Centinel Spine Australia Pty Ltd are subject to corporate income taxes in Switzerland, Germany and Australia, respectively. Centinel Spine Schweiz GmbH and Centinel Spine Australia Pty Ltd are treated as disregarded entities for most U.S. income tax purposes, such that the earnings or losses from these entities are generally included in the taxable income reportable by Centinel to its members. The foreign income taxes paid by these foreign subsidiaries, if any, may be eligible to be claimed as foreign tax credits in reducing the U.S. tax liability on the Centinel members’ foreign source income. Centinel Spine GmbH elected to change its U.S. entity classification to a controlled foreign corporation for 2023 and future tax years.
Swiss income tax returns remain open to examination for tax years 2018 through 2025. German income tax returns remain open to examination for tax years 2020 through 2025. Australian income tax returns remain open to examination for tax years 2021 through 2025. In addition, if and when the company claims net operating loss carryforwards from any prior years against taxable income, those losses may be examined by the taxing authorities.
The Company did not have any unrecognized tax benefits relating to uncertain tax positions and did not recognize any interest or penalties related to uncertain tax positions as of December 31, 2025 and 2024.
12. Related Party Transactions:
Centinel Spine Holdings, Inc. (Holdings) is a unit holder of the Company. The Company has a net receivable to Holdings as a result of transactions enacted on Holding’s behalf of $15 at both December 31, 2025 and 2024, recorded in prepaid expenses and other current assets in the consolidated balance sheets. There were no expenses incurred in either period.
The Viscogliosi Brothers, LLC (“VB”), who has membership interest in the Company, incurred expenses on behalf of the Company which were subsequently submitted to Centinel for reimbursement, totaling $3 for the year ended December 31, 2024. There were no expenses incurred as of 2025. Amounts due of $16 and $18 at December 31, 2025 and 2024, are included within accrued expenses in the consolidated balance sheets.
Centinel pays Musculoskeletal Clinical & Regulatory Advisors, LLC (MCRA), which was a majority owned subsidiary of VB, for services rendered for clinical, regulatory and reimbursement services. On August 1, 2024, MCRA was sold and is no longer a related party of Centinel Spine. Centinel incurred $2,048 for services provided by MCRA through August 1, 2024.
During 2025, an investor in the Company invested in Summit Orthopedic (Summit). The Company engages in manufacturing service arrangements with Summit which provides contract manufacturing and related production services for the Company’s products. During the year ended December 31, 2025, the Company incurred manufacturing service expenses of approximately $184 from Summit.
13. Commitments and Contingencies:
Litigation:
The Company may be subject to claims and suits arising in the ordinary course of business. The Company accrues for such liabilities when they are known if they are deemed probable and can be reasonably estimated.
F-35
Centinel Spine, LLC and Subsidiaries
NOTES TO CONSOLIDATED FINANCIAL STATEMENTS (Continued)
(In thousands, except unit and per unit amounts)
(In thousands, except unit and per unit amounts)
13. Commitments and Contingencies: (Continued)
Such matters are subject to many uncertainties, and the outcomes of these matters are not within the control of the Company and may not be known for prolonged periods of time. In some actions, the claimants seek damages, as well as other relief, including injunctions prohibiting us from engaging in certain activities, which, if granted, could require significant expenditures and/or result in lost revenues. If the reasonable estimate of a probable loss is a range, and no amount within the range is a better estimate than any other, the minimum amount of the range is accrued. If a loss is reasonably possible but not known or probable, and can be reasonably estimated, the estimated loss or range of loss is disclosed. In most cases, significant judgment is required to estimate the amount and timing of a loss to be recorded. The estimates are based on consultation with legal counsel, previous settlement experience and settlement strategies. If actual outcomes are less favorable than those estimated by management, additional expense may be incurred, which could unfavorably affect future operating results. The Company expenses legal costs related to loss contingencies as incurred. The Company is not currently involved in any significant claims or legal actions that, in the opinion of management, will have a material adverse impact on the Company’s operations, financial position or cash flows.
14. Leases:
The Company leases certain facilities, equipment, and vehicles under operating leases. Our leases have initial lease terms ranging from one year to three years. Certain leases contain options to extend terms beyond the lease termination date. In these leases, we use judgment to determine whether it is reasonably possible that we will extend the lease beyond the initial term and the length of the possible extension. Leases that have terms of less than 12 months are treated as short-term and are not recognized as right of use assets or lease liabilities. As most leases do not provide an implicit rate, we use an incremental borrowing rate based on the information available at commencement date in determining the present value of future payments.
Lease expense is recognized, on a straight-line basis over the term of the lease, as a component of operating income on the Consolidated Statement of Income.
Amounts reported in the consolidated balance sheet as of the years ended December 31, 2025 are as follows:
| | | |
December 31,
2025 |
| |
December 31,
2024 |
| ||||||
| Operating leases: | | | | ||||||||||
|
Right of use assets
|
| | | $ | 672 | | | | | $ | 1,056 | | |
|
Lease liability–short term
|
| | | | 426 | | | | | | 405 | | |
|
Lease liability–long term
|
| | | | 246 | | | | | | 651 | | |
|
Total operating lease liability
|
| | | $ | 672 | | | | | $ | 1,056 | | |
|
Lease expense as of December 31, 2025
|
| | | $ | 419 | | | | | $ | 409 | | |
| Supplemental non-cash information: | | | | | | | | | | | | | |
|
Weighted-average remaining lease term (years)
|
| | | | 1.7 | | | | | | 3.1 | | |
|
Weighted-average discount rate
|
| | | | 5.3% | | | | | | 4.8% | | |
F-36
Centinel Spine, LLC and Subsidiaries
NOTES TO CONSOLIDATED FINANCIAL STATEMENTS (Continued)
(In thousands, except unit and per unit amounts)
(In thousands, except unit and per unit amounts)
14. Leases: (Continued)
Future minimum lease payments under non-cancellable leases as of the year ended December 31, 2025 are as follows:
| | | |
Operating Leases
|
| |||
|
2026
|
| | | $ | 426 | | |
|
2027
|
| | | | 224 | | |
|
2028
|
| | | | 27 | | |
|
2029
|
| | | | 2 | | |
|
2030
|
| | | | — | | |
|
Total undiscounted lease payments
|
| | | $ | 679 | | |
|
Less: imputed interest
|
| | | | 7 | | |
|
Total lease liability
|
| | | $ | 672 | | |
15. Segment Reporting:
The Company’s business consists of one operating segment, which is also its one reportable segment. The Company operates in the United States and Internationally and derives revenues by providing motion preservation products to customers. The Company’s chief operating decision maker (“CODM”) is its chief executive officer, who reviews financial information presented on a consolidated basis. The CODM assesses performance and decides how to allocate resources based on segment net income (loss). This measure is used to monitor budget versus actual results to assess performance of the segment. The Company’s measure of segment assets is total assets, as reported on the consolidated balance sheets. Accounting policies for the company’s single operating segment are the same as those described in Note 2—Summary of Significant Accounting Policies.
F-37
Centinel Spine, LLC and Subsidiaries
NOTES TO CONSOLIDATED FINANCIAL STATEMENTS (Continued)
(In thousands, except unit and per unit amounts)
(In thousands, except unit and per unit amounts)
15. Segment Reporting: (Continued)
The following table presents our single segment revenue, significant expenses, and net income (loss) for the years ended December 31, 2025 and 2024):
| | | |
2025
|
| |
2024
|
| ||||||
| Revenue: | | | | | | | | | | | | | |
|
Revenue–US
|
| | | $ | 110,455 | | | | | $ | 76,618 | | |
|
Revenue–International
|
| | | | 21,708 | | | | | | 18,438 | | |
|
Total revenue
|
| | | | 132,163 | | | | | | 95,056 | | |
| Segment operating expenses: | | | | ||||||||||
|
Cost of goods sold
|
| | | | 20,070 | | | | | | 16,601 | | |
|
General & Administrative
|
| | | | 11,503 | | | | | | 10,022 | | |
|
Sales
|
| | | | 60,822 | | | | | | 43,770 | | |
|
Marketing
|
| | | | 3,713 | | | | | | 3,165 | | |
|
Research & Development
|
| | | | 1,208 | | | | | | 846 | | |
|
Regulatory Affairs & Quality Assurance
|
| | | | 2,017 | | | | | | 1,838 | | |
|
Clinical
|
| | | | 2,453 | | | | | | 4,108 | | |
|
Operations
|
| | | | 4,506 | | | | | | 3,901 | | |
|
Reimbursement
|
| | | | 1,130 | | | | | | 988 | | |
|
Medical Education
|
| | | | 2,962 | | | | | | 2,435 | | |
|
Depreciation and amortization
|
| | | | 4,447 | | | | | | 4,155 | | |
|
Inventory reserves
|
| | | | 1,626 | | | | | | 1,476 | | |
|
Total segment operating expense
|
| | | | 116,457 | | | | | | 93,305 | | |
|
Other segment expenses(1)
|
| | | | (20,027) | | | | | | (13,874) | | |
|
Net loss
|
| | | $ | (4,321) | | | | | $ | (12,123) | | |
(1)
Other segment expenses includes other expense, net, foreign currency gain (loss), interest expense, loss on extinguishment of debt, and income tax expense (benefit).
16. Geographic Area Information
The following table represents revenue, by geographic area, based on the location of the customer for the years presented:
| | | |
2025
|
| |
2024
|
| ||||||
|
U.S.
|
| | | $ | 110,455 | | | | | $ | 76,618 | | |
|
International
|
| | | | 21,708 | | | | | | 18,438 | | |
|
Total revenue
|
| | | $ | 132,163 | | | | | $ | 95,056 | | |
The table below presents property and equipment, net by geographic area:
| | | |
2025
|
| |
2024
|
| ||||||
|
U.S.
|
| | | $ | 5,840 | | | | | $ | 3,972 | | |
|
International
|
| | | | 1,436 | | | | | | 1,158 | | |
|
Total property and equipment, net
|
| | | $ | 7,276 | | | | | $ | 5,130 | | |
17. Subsequent Events:
Subsequent events have been evaluated through May 7, 2026, which is the date the consolidated financial statements were issued.
F-38
CENTINEL SPINE, LLC AND SUBSIDIARIES
CONDENSED CONSOLIDATED FINANCIAL STATEMENTS
For the Quarterly Period Ended June 30, 2026
For the Quarterly Period Ended June 30, 2026
CENTINEL SPINE, LLC AND SUBSIDIARIES
CONDENSED CONSOLIDATED BALANCE SHEETS
|
(In thousands)
|
| |
June 30,
2026 |
| |
December 31,
2025 |
| ||||||
| | | |
(unaudited)
|
| | | | ||||||
| ASSETS | | | | | | | | | | | | | |
| Current assets: | | | | | | | | | | | | | |
|
Cash and cash equivalents
|
| | | $ | 25,106 | | | | | | 21,289 | | |
|
Accounts receivable, net of allowances of $1,162 and $838, respectively
|
| | | | 30,281 | | | | | | 26,817 | | |
|
Inventory, net
|
| | | | 22,250 | | | | | | 20,433 | | |
|
Prepaid expenses and other current assets
|
| | | | 2,126 | | | | | | 772 | | |
|
Total current assets
|
| | | | 79,763 | | | | | | 69,311 | | |
| Non-Current assets: | | | | | | | | | | | | | |
|
Property and equipment, net of accumulated depreciation of $26,117 and $24,338, respectively
|
| | | | 8,909 | | | | | | 7,276 | | |
|
Right of use asset
|
| | | | 457 | | | | | | 672 | | |
|
Goodwill
|
| | | | 18,434 | | | | | | 18,820 | | |
|
Intangible assets, net
|
| | | | 5,264 | | | | | | 5,626 | | |
|
Other long-term assets
|
| | | | 2,402 | | | | | | — | | |
|
Total assets
|
| | | $ | 115,229 | | | | | | 101,705 | | |
|
LIABILITIES, REDEEMABLE CONVERTIBLE PREFERRED UNITS AND MEMBERS’ DEFICIT
|
| | | | | | | | | | | | |
| Current liabilities: | | | | | | | | | | | | | |
|
Accounts payable
|
| | | $ | 10,630 | | | | | | 6,337 | | |
|
Accrued expenses
|
| | | | 15,288 | | | | | | 15,584 | | |
|
Due to related parties
|
| | | | 16 | | | | | | 16 | | |
|
Lease liability
|
| | | | 422 | | | | | | 426 | | |
|
Total current liabilities
|
| | | | 26,356 | | | | | | 22,363 | | |
| Non-Current liabilities: | | | | | | | | | | | | | |
|
Warrant and derivative liabilities
|
| | | | 6,523 | | | | | | 10,282 | | |
|
Lease liability
|
| | | | 35 | | | | | | 246 | | |
|
Deferred tax liability
|
| | | | 1,642 | | | | | | 1,687 | | |
|
Note payable, net
|
| | | | 59,740 | | | | | | 58,986 | | |
|
Convertible notes payable, net
|
| | | | 62,139 | | | | | | 61,048 | | |
|
Term notes payable, net
|
| | | | 12,498 | | | | | | 11,872 | | |
|
Total liabilities
|
| | | | 168,933 | | | | | | 166,484 | | |
| Commitments and contingencies (Note 11) | | | | | | | | | | | | | |
|
Redeemable Convertible Class A Preferred Units; no par value, 66,518,221 units authorized as of June 30, 2026 and December 31, 2025, 63,290,921 units outstanding as of June 30, 2026 and December 31, 2025 and accumulated liquidation value of $88,250 as of June 30, 2026 and December 31, 2025
|
| | | | 83,019 | | | | | | 83,019 | | |
F-40
CENTINEL SPINE, LLC AND SUBSIDIARIES
CONDENSED CONSOLIDATED BALANCE SHEETS (Continued)
|
(In thousands)
|
| |
June 30,
2026 |
| |
December 31,
2025 |
| ||||||
| | | |
(unaudited)
|
| | | | ||||||
|
Redeemable Convertible Class B Preferred Units; no par value, 49,103,261 and 48,888,107 units authorized as of June 30, 2026 and December 31, 2025, respectively, 36,194,017 and 35,978,863 units outstanding as of June 30, 2026 and December 31, 2025, respectively and accumulated liquidation value of $50,467 and $50,167 as of June 30, 2026 and December 31, 2025, respectively
|
| | | | 50,406 | | | | | | 50,106 | | |
|
Redeemable Convertible Special Member Unit; no par value, 1 unit authorized and
outstanding as of June 30, 2026 and December 31, 2025, and accumulated liquidation value of $112,487 and $109,971 as of June 30, 2026 and December 31, 2025, respectively |
| | | | — | | | | | | — | | |
| Members’ deficit: | | | | | | | | | | | | | |
|
Common Units no par value, 150,924,548 and 150,709,394 units authorized as of June 30, 2026 and December 31, 2025, respectively, and 32,037,413 units outstanding as of June 30, 2026 and December 31, 2025, respectively
|
| | | | — | | | | | | — | | |
|
Incentive Units no par value, 17,480,254 units authorized as of June 30, 2026 and December 31, 2025, respectively, and 1,447,987 and 1,437,987 units outstanding as of June 30, 2026 and December 31, 2025, respectively
|
| | | | — | | | | | | | | |
|
Additional paid-in capital
|
| | | | 4,002 | | | | | | 3,859 | | |
|
Accumulated deficit
|
| | | | (188,445) | | | | | | (198,681) | | |
|
Accumulated other comprehensive loss
|
| | | | (2,686) | | | | | | (3,082) | | |
|
Total members’ deficit
|
| | | | (187,129) | | | | | | (197,904) | | |
|
Total liabilities, redeemable convertible preferred units and members’ deficit
|
| | | $ | 115,229 | | | | | | 101,705 | | |
| | |||||||||||||
See accompanying notes to the condensed consolidated financial statements
F-41
CENTINEL SPINE, LLC AND SUBSIDIARIES
CONDENSED CONSOLIDATED STATEMENTS OF COMPREHENSIVE INCOME (LOSS)
| | | |
Three Months Ended
June 30, |
| |
Six Months Ended
June 30, |
| ||||||||||||||||||
|
(In thousands)
|
| |
2026
|
| |
2025
|
| |
2026
|
| |
2025
|
| ||||||||||||
|
Net revenue
|
| | | $ | 44,739 | | | | | $ | 32,377 | | | | | $ | 85,244 | | | | | $ | 60,058 | | |
|
Cost of sales
|
| | | | 7,880 | | | | | | 6,336 | | | | | | 15,159 | | | | | | 12,083 | | |
|
Gross profit
|
| | | | 36,859 | | | | | | 26,041 | | | | | | 70,085 | | | | | | 47,975 | | |
| Operating expenses: | | | | | | | | | | | | | | | | | | | | | | | | | |
|
Selling and marketing
|
| | | | 21,809 | | | | | | 17,056 | | | | | | 42,151 | | | | | | 31,801 | | |
|
General and administrative
|
| | | | 6,347 | | | | | | 4,951 | | | | | | 12,092 | | | | | | 9,234 | | |
|
Research and development
|
| | | | 1,429 | | | | | | 1,385 | | | | | | 2,818 | | | | | | 2,469 | | |
|
Total operating expenses
|
| | | | 29,585 | | | | | | 23,392 | | | | | | 57,061 | | | | | | 43,504 | | |
|
Operating income (loss)
|
| | | | 7,274 | | | | | | 2,649 | | | | | | 13,024 | | | | | | 4,471 | | |
| Other income (expense): | | | | | | | | | | | | | | | | | | | | | | | | | |
|
Other income (expense), net
|
| | | | 3,804 | | | | | | 20 | | | | | | 3,885 | | | | | | 34 | | |
|
Foreign currency (loss) gain
|
| | | | (317) | | | | | | 2,722 | | | | | | (1,058) | | | | | | 4,089 | | |
|
Interest expense
|
| | | | (2,774) | | | | | | (2,670) | | | | | | (5,507) | | | | | | (5,489) | | |
|
Loss on extinguishment of debt
|
| | | | — | | | | | | — | | | | | | — | | | | | | (3,458) | | |
|
Total other income (expense), net
|
| | | | 713 | | | | | | 72 | | | | | | (2,680) | | | | | | (4,824) | | |
|
Net income (loss) before taxes
|
| | | | 7,987 | | | | | | 2,721 | | | | | | 10,344 | | | | | | (353) | | |
|
Income tax expense (benefit)
|
| | | | 61 | | | | | | 36 | | | | | | 108 | | | | | | 150 | | |
|
Net income (loss)
|
| | | | 7,926 | | | | | | 2,685 | | | | | | 10,236 | | | | | | (503) | | |
| Other comprehensive income (loss): | | | | | | | | | | | | | | | | | | | | | | | | | |
|
Foreign currency translation
|
| | | | 118 | | | | | | (917) | | | | | | 396 | | | | | | (1,434) | | |
|
Comprehensive income (loss)
|
| | | $ | 8,044 | | | | | $ | 1,768 | | | | | $ | 10,632 | | | | | $ | (1,937) | | |
See accompanying notes to the condensed consolidated financial statements
F-42
CENTINEL SPINE, LLC AND SUBSIDIARIES
CONSOLIDATED STATEMENTS OF REDEEMABLE CONVERTIBLE PREFERRED UNITS AND MEMBERS’ DEFICIT
| | | |
Redeemable Convertible Preferred Units
|
| | | | | | | | | | | | | | | | | | | | | | | | | |||||||||||||||||||||||||||||||||||||||||||||||||||||||||
| | | |
Series A
Preferred Units |
| |
Series B
Preferred Units |
| |
Special
Member Unit |
| |
Common Units
|
| |
Incentive Units
|
| |
Additional
Paid-in Capital |
| |
Accumulated
Deficit |
| |
Accumulated
Other Comprehensive |
| |
Total
members’ deficit |
| |||||||||||||||||||||||||||||||||||||||||||||||||||||||||
|
(In thousands, except unit amounts)
|
| |
Units
|
| |
Cost
|
| |
Units
|
| |
Cost
|
| |
Units
|
| |
Cost
|
| |
Units
|
| |
Cost
|
| |
Units
|
| |
Cost
|
| ||||||||||||||||||||||||||||||||||||||||||||||||||||||
|
Balance, December 31, 2025
|
| | | | 63,290,921 | | | | | $ | 83,019 | | | | | | 35,978,863 | | | | | $ | 50,106 | | | | | | 1 | | | | | $ | — | | | | | | 32,037,413 | | | | | $ | — | | | | | | 1,437,987 | | | | | $ | — | | | | | $ | 3,859 | | | | | $ | (198,681) | | | | | $ | (3,082) | | | | | $ | (197,904) | | |
|
Unit-based compensation expense
|
| | | | — | | | | | | — | | | | | | — | | | | | | — | | | | | | — | | | | | | — | | | | | | — | | | | | | — | | | | | | — | | | | | | — | | | | | | 23 | | | | | | — | | | | | | — | | | | | | 23 | | |
|
Notes payable converted to equity
|
| | | | — | | | | | | — | | | | | | 107,577 | | | | | | 150 | | | | | | — | | | | | | — | | | | | | — | | | | | | — | | | | | | — | | | | | | — | | | | | | — | | | | | | — | | | | | | — | | | | | | — | | |
|
Net income (loss)
|
| | | | — | | | | | | — | | | | | | — | | | | | | — | | | | | | — | | | | | | — | | | | | | — | | | | | | — | | | | | | — | | | | | | — | | | | | | — | | | | | | 2,310 | | | | | | — | | | | | | 2,310 | | |
|
Foreign currency translation
|
| | | | — | | | | | | — | | | | | | — | | | | | | — | | | | | | — | | | | | | — | | | | | | — | | | | | | — | | | | | | — | | | | | | — | | | | | | — | | | | | | — | | | | | | 278 | | | | | | 278 | | |
|
Balance, March 31, 2026
|
| | | | 63,290,921 | | | | | $ | 83,019 | | | | | | 36,086,440 | | | | | $ | 50,256 | | | | | | 1 | | | | | $ | — | | | | | | 32,037,413 | | | | | $ | — | | | | | | 1,437,987 | | | | | $ | — | | | | | $ | 3,882 | | | | | $ | (196,371) | | | | | $ | (2,804) | | | | | $ | (195,293) | | |
|
Unit-based compensation expense
|
| | | | — | | | | | | — | | | | | | — | | | | | | — | | | | | | — | | | | | | — | | | | | | — | | | | | | — | | | | | | — | | | | | | — | | | | | | 116 | | | | | | — | | | | | | — | | | | | | 116 | | |
|
Exercise of stock options
|
| | | | — | | | | | | — | | | | | | — | | | | | | — | | | | | | — | | | | | | — | | | | | | — | | | | | | — | | | | | | 10,000 | | | | | | — | | | | | | 4 | | | | | | — | | | | | | — | | | | | | 4 | | |
|
Notes payable converted to equity
|
| | | | — | | | | | | — | | | | | | 107,577 | | | | | | 150 | | | | | | — | | | | | | — | | | | | | — | | | | | | — | | | | | | — | | | | | | — | | | | | | — | | | | | | — | | | | | | — | | | | | | — | | |
|
Net income (loss)
|
| | | | — | | | | | | — | | | | | | — | | | | | | — | | | | | | — | | | | | | — | | | | | | — | | | | | | — | | | | | | — | | | | | | — | | | | | | — | | | | | | 7,926 | | | | | | — | | | | | | 7,926 | | |
|
Foreign currency translation
|
| | | | — | | | | | | — | | | | | | — | | | | | | — | | | | | | — | | | | | | — | | | | | | — | | | | | | — | | | | | | — | | | | | | — | | | | | | — | | | | | | — | | | | | | 118 | | | | | | 118 | | |
|
Balance, June 30, 2026
|
| | | | 63,290,921 | | | | | $ | 83,019 | | | | | | 36,194,017 | | | | | $ | 50,406 | | | | | | 1 | | | | | $ | — | | | | | | 32,037,413 | | | | | $ | — | | | | | | 1,447,987 | | | | | $ | — | | | | | $ | 4,002 | | | | | $ | (188,445) | | | | | $ | (2,686) | | | | | $ | (187,129) | | |
| | | |
Redeemable Convertible Preferred Units
|
| | | | | | | | | | | | | | | | | | | | | | | | | |||||||||||||||||||||||||||||||||||||||||||||||||||||||||
| | | |
Series A
Preferred Units |
| |
Series B
Preferred Units |
| |
Special
Member Unit |
| |
Common Units
|
| |
Incentive Units
|
| |
Additional
Paid-in Capital |
| |
Accumulated
Deficit |
| |
Other
Comprehensive Loss |
| |
Total
members’ deficit |
| |||||||||||||||||||||||||||||||||||||||||||||||||||||||||
|
(In thousands, except unit amounts)
|
| |
Units
|
| |
Cost
|
| |
Units
|
| |
Cost
|
| |
Units
|
| |
Cost
|
| |
Units
|
| |
Cost
|
| |
Units
|
| |
Cost
|
| ||||||||||||||||||||||||||||||||||||||||||||||||||||||
|
Beginning Balance, December 31,
2024 |
| | | | 63,290,921 | | | | | $ | 83,019 | | | | | | 34,657,291 | | | | | $ | 48,264 | | | | | | 1 | | | | | $ | — | | | | | | 35,303,066 | | | | | $ | — | | | | | | 1,305,614 | | | | | $ | — | | | | | $ | 3,678 | | | | | $ | (194,360) | | | | | $ | (1,608) | | | | | $ | (192,290) | | |
|
Unit-based compensation expense
|
| | | | — | | | | | | — | | | | | | — | | | | | | — | | | | | | — | | | | | | — | | | | | | — | | | | | | — | | | | | | — | | | | | | — | | | | | | 46 | | | | | | — | | | | | | — | | | | | | 46 | | |
|
Exercise of stock options
|
| | | | — | | | | | | — | | | | | | — | | | | | | — | | | | | | — | | | | | | — | | | | | | — | | | | | | — | | | | | | 50,000 | | | | | | — | | | | | | 18 | | | | | | — | | | | | | — | | | | | | 18 | | |
|
Notes payable converted to equity
|
| | | | — | | | | | | — | | | | | | 1,042,384 | | | | | | 1,453 | | | | | | — | | | | | | — | | | | | | — | | | | | | — | | | | | | — | | | | | | — | | | | | | — | | | | | | — | | | | | | — | | | | | | — | | |
|
Net income (loss)
|
| | | | — | | | | | | — | | | | | | — | | | | | | — | | | | | | — | | | | | | — | | | | | | — | | | | | | — | | | | | | — | | | | | | — | | | | | | — | | | | | | (3,188) | | | | | | — | | | | | | (3,188) | | |
|
Foreign currency translation
|
| | | | — | | | | | | — | | | | | | — | | | | | | — | | | | | | — | | | | | | — | | | | | | — | | | | | | — | | | | | | — | | | | | | — | | | | | | — | | | | | | — | | | | | | (517) | | | | | | (517) | | |
|
Beginning Balance, March 31, 2025
|
| | | | 63,290,921 | | | | | $ | 83,019 | | | | | | 35,699,675 | | | | | $ | 49,717 | | | | | | 1 | | | | | | — | | | | | | 35,303,066 | | | | | $ | — | | | | | | 1,355,614 | | | | | $ | — | | | | | $ | 3,742 | | | | | $ | (197,548) | | | | | $ | (2,125) | | | | | $ | (195,931) | | |
|
Unit-based compensation expense
|
| | | | — | | | | | | — | | | | | | — | | | | | | — | | | | | | — | | | | | | — | | | | | | — | | | | | | — | | | | | | — | | | | | | — | | | | | | 35 | | | | | | — | | | | | | — | | | | | | 35 | | |
|
Notes payable converted to equity
|
| | | | — | | | | | | — | | | | | | 64,034 | | | | | | 89 | | | | | | — | | | | | | — | | | | | | — | | | | | | — | | | | | | — | | | | | | — | | | | | | — | | | | | | — | | | | | | — | | | | | | — | | |
|
Net income (loss)
|
| | | | — | | | | | | — | | | | | | — | | | | | | — | | | | | | — | | | | | | — | | | | | | — | | | | | | — | | | | | | — | | | | | | — | | | | | | — | | | | | | 2,685 | | | | | | — | | | | | | 2,685 | | |
|
Foreign currency translation
|
| | | | — | | | | | | — | | | | | | — | | | | | | — | | | | | | — | | | | | | — | | | | | | — | | | | | | — | | | | | | — | | | | | | — | | | | | | — | | | | | | — | | | | | | (917) | | | | | | (917) | | |
|
Balance, June 30, 2025
|
| | | | 63,290,921 | | | | | $ | 83,019 | | | | | | 35,763,709 | | | | | $ | 49,806 | | | | | | 1 | | | | | $ | — | | | | | | 35,303,066 | | | | | $ | — | | | | | | 1,355,614 | | | | | $ | — | | | | | $ | 3,777 | | | | | $ | (194,863) | | | | | $ | (3,042) | | | | | $ | (194,128) | | |
See accompanying notes to the condensed consolidated financial statements
F-43
CENTINEL SPINE, LLC AND SUBSIDIARIES
CONDENSED CONSOLIDATED STATEMENTS OF CASH FLOWS
| | | |
Six Months Ended
June 30, |
| |||||||||
|
(In thousands)
|
| |
2026
|
| |
2025
|
| ||||||
| Cash flows from operating activities: | | | | | | | | | | | | | |
|
Net income (loss)
|
| | | $ | 10,236 | | | | | $ | (503) | | |
|
Adjustments to reconcile net income (loss) to net cash provided by (used for) operating activities:
|
| | | | | | | | | | | | |
|
Depreciation and amortization
|
| | | | 2,490 | | | | | | 2,080 | | |
|
Amortization of debt discount and issuance cost
|
| | | | 1,140 | | | | | | 1,243 | | |
|
Loss on extinguishment of debt
|
| | | | — | | | | | | 3,458 | | |
|
Operating lease expense
|
| | | | 213 | | | | | | 207 | | |
|
Unrealized and realized loss (gain) on warrant and derivative liabilities, net
|
| | | | (3,758) | | | | | | — | | |
|
Provision for excess and obsolete inventory
|
| | | | 42 | | | | | | 350 | | |
|
Paid in kind interest
|
| | | | 1,480 | | | | | | 1,435 | | |
|
Bad debt expense
|
| | | | 304 | | | | | | 328 | | |
|
Unit-based compensation expense
|
| | | | 139 | | | | | | 80 | | |
|
Foreign currency remeasurement (gain) loss
|
| | | | 1,058 | | | | | | (4,089) | | |
|
Changes in operating assets and liabilities:
|
| | | | | | | | | | | | |
|
Accounts receivable
|
| | | | (3,887) | | | | | | (1,699) | | |
|
Inventory
|
| | | | (2,034) | | | | | | (2,262) | | |
|
Prepaid expenses and other assets
|
| | | | (3,449) | | | | | | (1,588) | | |
|
Accounts payable
|
| | | | 3,811 | | | | | | 1,702 | | |
|
Accrued expenses
|
| | | | (80) | | | | | | (5,296) | | |
|
Net cash provided by (used for) operating activities
|
| | | | 7,705 | | | | | | (4,554) | | |
| Cash flows from investing activities: | | | | | | | | | | | | | |
|
Purchases of property and equipment
|
| | | | (3,883) | | | | | | (2,888) | | |
|
Proceeds from sale of property and equipment
|
| | | | 77 | | | | | | 73 | | |
|
Net cash (used for) investing activities
|
| | | | (3,806) | | | | | | (2,815) | | |
| Cash flows from financing activities: | | | | | | | | | | | | | |
|
Proceeds from long-term debt
|
| | | | — | | | | | | 60,000 | | |
|
Payments on long-term debt and note payable
|
| | | | — | | | | | | (36,500) | | |
|
Payment for debt extinguishment costs
|
| | | | — | | | | | | (1,990) | | |
|
Payment for debt issuance costs
|
| | | | — | | | | | | (2,300) | | |
|
Proceeds from exercise of stock options
|
| | | | — | | | | | | 18 | | |
|
Net cash provided by financing activities
|
| | | | — | | | | | | 19,228 | | |
|
Effect of the exchange rate on cash
|
| | | | (82) | | | | | | (50) | | |
|
Net increase in cash and cash equivalents
|
| | | | 3,817 | | | | | | 11,809 | | |
|
Cash and cash equivalents, beginning of year
|
| | | | 21,289 | | | | | | 6,146 | | |
|
Cash and cash equivalents, end of period
|
| | | $ | 25,106 | | | | | $ | 17,955 | | |
| Supplemental cash flow information: | | | | | | | | | | | | | |
|
Cash paid for interest
|
| | | $ | 2,872 | | | | | $ | 2,858 | | |
|
Cash paid for taxes
|
| | | $ | 204 | | | | | $ | 102 | | |
|
Cash paid for accrued paid-in-kind interest and final fee upon extinguishment
|
| | | $ | — | | | | | $ | 6,719 | | |
| Non-cash financing activities | | | | | | | | | | | | | |
|
Conversion of debt to equity
|
| | | $ | 300 | | | | | $ | 1,542 | | |
See accompanying notes to the condensed consolidated financial statements
F-44
Centinel Spine, LLC and Subsidiaries
NOTES TO CONDENSED CONSOLIDATED FINANCIAL STATEMENTS
(unaudited)
(In thousands, except unit and per unit amounts)
(unaudited)
(In thousands, except unit and per unit amounts)
1. Nature of Organization and Operations:
Centinel Spine, LLC (the “Company” or “Centinel”) was formed on August 15, 2017 as a limited liability company in the state of Delaware. Centinel is the manufacturer of record (outsourcing manufacturing to third parties) and distributor of spinal implants with distribution and operations facilities located in West Chester, Pennsylvania, Waalwijk, Netherlands and Kent Town, Australia. Inventory is consigned with distributors and at hospitals throughout the world.
Business activities of Centinel consist of product research and development, product manufacturing, and marketing and sales. Centinel’s corporate office is located in West Chester, Pennsylvania.
2. Basis of Presentation and Summary of Significant Accounting Policies:
Principles of Consolidation:
The accompanying unaudited condensed consolidated financial statements have been prepared in accordance with generally accepted accounting principles in the United States of America (“US GAAP”) and the applicable rules and regulations of the Securities and Exchange Commission (“SEC”) for interim reporting, which contemplate the continued existence of the Company. Certain information and note disclosures included in the Company’s annual financial statements prepared in accordance with GAAP have been condensed or omitted pursuant to such rules and regulations. These unaudited interim condensed consolidated financial statements should be read in conjunction with the audited annual financial statements for the year ended December 31, 2025. There have been no material changes in our significant accounting policies as described in our audited annual financial statements for the year ended December 31, 2025. In the opinion of management, these unaudited interim condensed consolidated financial statements reflect all adjustments, including those of a normal and recurring nature, which are necessary for a fair presentation of the results for the interim period presented. The results of operations for the interim periods should not be considered indicative of results for the full year.
The accompanying unaudited condensed consolidated financial statements include Centinel Spine, LLC, CS Swiss Holdings, LLC (a wholly owned subsidiary of Centinel), Centinel Spine Schweiz GmbH (“Schweiz”), a wholly owned subsidiary of CS Swiss Holdings, LLC, and Centinel Spine GmbH and Centinel Spine Australia PTY (wholly owned subsidiaries of Schweiz). Intercompany accounts and transactions have been eliminated in the consolidated financial statements.
Concentrations of Credit and Market Risk:
Financial instruments that potentially expose the Company to concentrations of credit and market risk consist primarily of cash and cash equivalents, and accounts receivable. Cash is maintained at Federal Deposit Insurance Corporation (“FDIC”) insured financial institutions. The Company has not experienced any losses with respect to its cash balances. Based on management’s review of the strength of the financial institutions, management feels the risk of loss on its cash balances is minimal. The Company has amounts in excess of the FDIC limit as of June 30, 2026 and December 31, 2025.
Risks and Uncertainties:
The Company is subject to risks common to companies in the medical device industry including, but not limited to, uncertainties related to commercialization of competitor products, regulatory approvals, dependence on key products, dependence on key customers and suppliers, and protection of intellectual property rights.
Use of Estimates:
In the preparation of consolidated financial statements in conformity with US GAAP, management is required to make estimates and assumptions that affect the reported amounts of assets and liabilities and disclosure of
F-45
Centinel Spine, LLC and Subsidiaries
NOTES TO CONDENSED CONSOLIDATED FINANCIAL STATEMENTS (Continued)
(unaudited)
(In thousands, except unit and per unit amounts)
(unaudited)
(In thousands, except unit and per unit amounts)
2. Basis of Presentation and Summary of Significant Accounting Policies: (Continued)
contingent assets and liabilities at the date of the consolidated financial statements and the reported amounts of revenue and expense during the reported period. Actual results could differ from those estimates. Estimates and assumptions are periodically reviewed, and the effects of revisions are reflected in the consolidated financial statements in the period they are determined to be necessary.
Significant areas that require estimates include intangible assets, allowance for credit losses, unit-based compensation, reserves for excess and obsolete inventory, useful lives of assets, recoverability of intangible assets, warrant and derivative liabilities and deferred tax assets. The Company is subject to risks and uncertainties due to changes in the healthcare environment, regulatory oversight, competition, and legislation that may cause actual results to differ from estimated results.
Segment Information:
Operating segments are defined as components of an enterprise about which separate discrete information is available for evaluation by the chief operating decision maker in deciding how to allocate resources and in assessing performance. The Company manages its global operations and business in one operating segment.
Inventory, net:
Inventory is recorded at the lower of cost or net realizable value. Cost is determined on a first-in, first-out basis. The Company’s inventory is comprised primarily of finished goods available for sale.
The Company periodically evaluates the carrying value of inventory in relation to estimated forecasts of product demand, which takes into consideration the life cycle of product releases. When quantities on hand exceed estimated sales forecasts, the Company records a reserve for such excess inventory. Once inventory has been written down, it creates a new cost basis for inventory that is not subsequently written up. The following table sets forth the components of the Company’s inventories at June 30, 2026 and December 31, 2025.
| | | |
June 30,
2026 |
| |
December 31,
2025 |
| ||||||
|
Finished products
|
| | | $ | 23,022 | | | | | $ | 22,870 | | |
|
Work in process
|
| | | | 2,832 | | | | | | 1,590 | | |
|
Raw Materials
|
| | | | 4,325 | | | | | | 3,928 | | |
|
Inventories before reserve
|
| | | | 30,179 | | | | | | 28,388 | | |
|
Inventory reserve
|
| | | | (7,929) | | | | | | (7,955) | | |
|
Inventory
|
| | | $ | 22,250 | | | | | $ | 20,433 | | |
Other long-term assets:
The Company capitalizes specific incremental costs directly attributable to its planned initial public offering, including qualifying legal, accounting, printing, filing and other offering-related costs. Such costs are recorded within other long-term assets in the consolidated balance sheets. Upon completion of the offering, the deferred offering costs will be reclassified to stockholders’ equity and recorded as a reduction of the gross proceeds from the offering. If the planned offering is abandoned, the deferred offering costs will be expensed in the period in which the offering is determined to be abandoned.
Revenue Recognition:
The Company recognizes revenue from its sales when its performance obligations with its customers have been satisfied. In the contracts with its customers, the Company has identified a single performance obligation to provide motion preservation products, for which revenue is recognized at a point in time.
F-46
Centinel Spine, LLC and Subsidiaries
NOTES TO CONDENSED CONSOLIDATED FINANCIAL STATEMENTS (Continued)
(unaudited)
(In thousands, except unit and per unit amounts)
(unaudited)
(In thousands, except unit and per unit amounts)
2. Basis of Presentation and Summary of Significant Accounting Policies: (Continued)
The Company sells its products through a distributor network, the majority of which do not take title to the inventory but facilitate the sale to the end customer (non-stocking distributors) and others who hold inventory in the Company’s products (stocking distributors in international markets). For sales through non-stocking distributors, the Company has determined that the hospital or ambulatory surgical center is the customer and recognize revenue at the time the product is used or implanted. For these sales, the Company has determined it is the principal in the transaction as it has the ability to direct the use of the products prior to transfer to the end customer, is responsible for fulfilling the promise to the end customer, has latitude in establishing price and controls the relationship with the end customer. Accordingly, revenues are recognized at the gross amount charged to the end customer with expense recognized for commissions paid to distributors classified as selling and marketing expenses in the Statement of Comprehensive Income (Loss). For sales through stocking distributors, the Company has determined the distributor is the customer and recognizes revenue upon shipment as control of the product transfers based on the contractual terms.
The Company invoices its customers after control of the product has been transferred to the customer and invoice payments are generally due within 30 days of invoice date. In determining the transaction price, a significant financing component does not exist since the timing from when the Company delivers its products to when the customers pay for the products is typically less than one year. The Company does not have material variable consideration, including discounts and rebates.
The nature of the Company’s products and services does not give rise to contract assets as costs are not incurred to fulfill a contract before a product or service is provided to a customer. Costs to obtain contracts are in the form of commissions paid to employees or third-party agents. The Company expenses commissions associated with obtaining a contract at the time of sale or as incurred, which is typically less than one year from date of sale. The Company has elected to present these costs within selling and marketing expenses. As such, the Company did not have any contract assets as of June 30, 2026 and December 31, 2025.
Unit Based Compensation:
The Company accounts for unit-based employee and nonemployee compensation arrangements in accordance with provisions of ASC 718, Compensation—Unit Compensation. ASC 718 requires the recognition of compensation expense, using a fair-value based method, for costs related to all unit-based payments including unit options. ASC 718 requires companies to estimate the fair value of unit-based payment awards on the date of grant using an option-pricing model, which uses both historical and current market data to estimate fair value. The Company uses the Black-Scholes option-pricing model (“Black Scholes”) to determine the fair value of options granted. The Company’s unit-based awards are subject to service-based vesting conditions and compensation expense is recognized on an accelerated basis.
Black-Scholes requires inputs based on certain subjective assumptions, including (i) the expected volatility of the price of the Company’s common units, (ii) the expected term of the option, (iii) the risk-free interest rate and (iv) expected dividends. Due to the lack of a public market for the Company’s common unit and lack of company-specific historical and implied volatility data, the Company has based its computation of expected volatility on the historical volatility of a representative group of public companies with similar characteristics to the Company, including stage of product development and life science industry focus. The historical volatility is calculated based on a period of time commensurate with expected term assumption. The Company uses the simplified method to calculate the expected term for options granted to employees and nonemployees whereby the expected term equals the arithmetic average of the vesting term and the original contractual term of the options due to its lack of sufficient historical data. The risk-free interest rate is based on U.S. Treasury securities with a maturity date commensurate with the expected term of the associated option. The expected dividend yield is assumed to be zero as the Company has never paid dividends and has no current plans to pay any dividends on its common units. Forfeitures are recognized as they occur.
F-47
Centinel Spine, LLC and Subsidiaries
NOTES TO CONDENSED CONSOLIDATED FINANCIAL STATEMENTS (Continued)
(unaudited)
(In thousands, except unit and per unit amounts)
(unaudited)
(In thousands, except unit and per unit amounts)
2. Basis of Presentation and Summary of Significant Accounting Policies: (Continued)
Due to the absence of an active market for the Company’s common units, the Company utilized methodologies in accordance with the framework of the American Institute of Certified Public Accountants Technical Practice Aid, Valuation of Privately-Held Company Equity Securities Issued as Compensation, to estimate the fair value of its common stock. In determining the exercise prices for option units granted, the Company has considered the estimated fair value of the common unit as of the measurement date. The estimated fair value of the common unit has been determined at each grant date based upon a variety of factors, including the illiquid nature of the common unit, arm’s-length sales of the common units, the effect of the rights and preferences of the preferred unitholders, and the prospects of a liquidity event. Among other factors are the Company’s financial position and historical financial performance, the status of technological developments within the Company’s research, the composition and ability of the current research and management team, an evaluation or benchmark of the Company’s competition, and the current business climate in the marketplace. Significant changes to the key assumptions underlying the factors used could result in different fair values of common units at each valuation date.
Fair Value Measurements:
The Company measures certain assets and liabilities at fair value. Fair value is defined as the price that would be received to sell an asset or paid to transfer a liability (an exit price) in an orderly transaction between market participants at the reporting date. The hierarchy below lists the three levels of fair value based on the extent to which inputs used in measuring fair value are observable in the market. The Company categorizes each of the Company’s fair value measurements in one of these three levels based on the lowest level input that is significant to the fair value measurement in its entirety.
These levels are:
•
Level 1—inputs based upon unadjusted quoted prices for identical instruments traded in active markets.
•
Level 2—inputs are based upon observable market-based inputs or unobservable inputs that are corroborated by market data.
•
Level 3—inputs are generally unobservable and typically reflect management’s estimates of assumptions that market participants would use in pricing the asset or liability.
| | | |
June 30, 2026
|
| |||||||||||||||||||||
| | | |
Level 1
|
| |
Level 2
|
| |
Level 3
|
| |
Total
|
| ||||||||||||
|
Cash equivalents
|
| | | $ | 25,106 | | | | | $ | — | | | | | $ | — | | | | | $ | 25,106 | | |
|
Total Assets
|
| | | $ | 25,106 | | | | | $ | — | | | | | $ | — | | | | | $ | 25,106 | | |
|
Derivative
|
| | | $ | — | | | | | $ | — | | | | | $ | (1,696) | | | | | $ | (1,696) | | |
|
Warrants
|
| | | | — | | | | | | — | | | | | | (4,827) | | | | | | (4,827) | | |
|
Total Liabilities
|
| | | $ | — | | | | | $ | — | | | | | $ | (6,523) | | | | | $ | (6,523) | | |
| | | |
December 31, 2025
|
| |||||||||||||||||||||
| | | |
Level 1
|
| |
Level 2
|
| |
Level 3
|
| |
Total
|
| ||||||||||||
|
Cash equivalents
|
| | | $ | 21,289 | | | | | $ | — | | | | | $ | — | | | | | $ | 21,289 | | |
|
Total Assets
|
| | | $ | 21,289 | | | | | $ | — | | | | | $ | — | | | | | $ | 21,289 | | |
|
Derivative
|
| | | $ | — | | | | | $ | — | | | | | $ | (6,640) | | | | | $ | (6,640) | | |
|
Warrants
|
| | | | — | | | | | | — | | | | | | (3,642) | | | | | | (3,642) | | |
|
Total Liabilities
|
| | | $ | — | | | | | $ | — | | | | | $ | (10,282) | | | | | $ | (10,282) | | |
F-48
Centinel Spine, LLC and Subsidiaries
NOTES TO CONDENSED CONSOLIDATED FINANCIAL STATEMENTS (Continued)
(unaudited)
(In thousands, except unit and per unit amounts)
(unaudited)
(In thousands, except unit and per unit amounts)
2. Basis of Presentation and Summary of Significant Accounting Policies: (Continued)
The Company evaluates assets and liabilities subject to fair value measurements on a recurring basis to determine the appropriate level to classify them for each reporting period. This determination requires significant judgments to be made by the Company.
The estimated fair value of the warrant liability at June 30, 2026 and December 31, 2025 was determined using Level 3 inputs. Inherent in an option pricing model are assumptions related to the fair value of the unit, the expected unit-price volatility, term to exit/remaining life, risk-free interest rate and dividend yield. The Company estimates the volatility of its common unit price based on projected volatility of comparable public companies that matches the expected remaining life of the warrants. The risk-free interest rate is based on the U.S. Treasury zero-coupon yield curve on the grant date for a maturity similar to the expected remaining life of the warrants. The expected life of the warrants is based on the remaining restriction period. The dividend rate is based on the historical rate, which the Company anticipates to remain at zero. Significant changes in any of those inputs in isolation would have resulted in a significantly different fair value measurement.
The decrease in the fair value of the derivative liability during the period ending June 30, 2026, was primarily driven by an increase in the Company’s estimated IPO valuation, which reduced the incremental value attributable to the embedded feature allowing noteholders to convert at a 30% discount to the IPO price, resulting in a lower fair value of the embedded derivative.
The derivative liability is associated with the 2021 issuances of Promissory Notes Payable (see Note 4). The Company computed the fair value related to the embedded share settlement feature providing for conversion of the notes at a 30% discount to the price of the shares issued in the event of an initial public offering (“IPO”). The Company estimated the fair value using a probability weighted approach and is accounted for at fair value based on significant inputs not observable in the market and thus represents a Level 3 measurement within the fair value hierarchy. The derivative liability was valued using a scenario-based (or probability weighted) approach, and the put options are valued using Black Scholes. The Black-Scholes valuation methodology was used as the Company believes the model embodies all the relevant assumptions that address the features underlying this instrument. Inherent in an embedded derivative model are assumptions related to the fair value of the unit, expected unit-price volatility, risk-free interest rate and dividend yield.
Change In Control Bonus Plan:
In December 2024, Centinel adopted a Change In Control Bonus Plan (the “CIC Plan”) designed to retain key personnel and incentivize their efforts in connection with a potential change in control transaction involving the Company. A “Change in Control” is broadly defined to include a sale or disposition of substantially all of the Company’s assets, or a merger, consolidation, or reorganization where existing equity holders retain less than 50% voting power of the surviving entity. The CIC Plan could result in payments of up to a maximum of $13.0 million upon a change of control based on the enterprise value. As of June 30, 2026 and December 31, 2025, the Company did not accrue the CIC Plan bonus as it was not probable of occurring at the time.
Recent Accounting Pronouncements, Not Yet Effective
In November 2024, the FASB issued ASU 2024-03, “ASC 220- Income Statement—Reporting Comprehensive Income—Expense Disaggregation Disclosures,” which requires entities, in the notes to financial statements, to disclose specified information about certain costs and expenses. The guidance is effective for the Company’s annual periods beginning after December 15, 2026, and interim periods within annual reporting periods beginning after December 15, 2027. Early adoption is permitted. The Company is assessing the impact of adopting this guidance on its financial statements.
F-49
Centinel Spine, LLC and Subsidiaries
NOTES TO CONDENSED CONSOLIDATED FINANCIAL STATEMENTS (Continued)
(unaudited)
(In thousands, except unit and per unit amounts)
(unaudited)
(In thousands, except unit and per unit amounts)
3. Note Payable, net:
Loan Agreement:
The Company entered into a Loan Agreement dated as of March 8, 2021, with Innovatus Life Sciences Lending Fund I, LP (“Innovatus”), pursuant to which the Company borrowed $54,000. The loan agreement had a maturity date of March 1, 2026 and required monthly principal and interest payments of $2,056 beginning April 2024, which was amended to February 2025, through maturity.
The amounts outstanding under the Loan Agreement accrue interest at the floating per annum rate of interest equal to the sum of (a) the greater of (i) Prime Rate or (ii) 3.25%, and (b) 7.25% or upon the satisfaction of certain conditions described in the Loan Agreement, 6.5%. The Company issued Innovatus warrants to purchase 1,262,237 Redeemable Convertible Class B Preferred Units. The warrants have an exercise price of $1.39435 and will expire ten years from the effective date of the warrant issuance. In addition, the Company was required to pay a final fee upon maturity or prepayment that increased in the event the Company elected to cancel the warrants. The Company amortized the final fee to interest expense over the term of the Loan Agreement.
Total financing costs related to the Loan Agreement amounted to $1,693 which have been deferred and presented net against the related debt in the accompanying Consolidated Balance Sheets. The debt issuance costs are amortized into interest expense over the period of the related debt. Amortization of these costs during the three and six months ended June 30, 2026 and 2025 were $0 and $39, respectively, which were recorded as interest expense.
On February 25, 2025, the Company entered into a new secured loan agreement (the “Senior Loan Agreement”) which proceeds were used to repay the outstanding Loan Agreement. The Company repaid in full its Loan Agreement with an outstanding principal balance of $36,500, paid related fees and expenses including accumulated paid-in-kind interest of $3,479 and a final fee of $5,130. The final fee was related to an amount due upon payment plus an amount related to the cancellation of the outstanding warrants held by Innovatus. In connection with this repayment, the Company incurred total debt extinguishment costs of $2,098, which primarily related to the final fees paid to lenders.
These costs were recognized as a loss on extinguishment of debt and are included in “Loss on extinguishment of debt” in the consolidated statements of comprehensive income (loss) for the six months ended June 30, 2025.
The extinguishment resulted in the termination of all obligations under the Loan Agreement.
Senior Loan Agreement:
On February 25, 2025, the Company entered into a senior secured loan agreement (“Senior Loan Agreement”) with credit funds managed by SLR Capital Partners, LLC (“SLR”) to provide the Company with $60 million of capital. On February 25, 2025, the Company also entered into a credit agreement, with Gemino Healthcare Finance, LLC d/b/a SLR Healthcare ABL, or Gemino, pursuant to which the Company may borrow up to $5 million in revolving loans and may request Gemino to increase the amount up to an aggregate amount of $10 million (“Revolving Loans”). The proceeds from the initial funding of the Senior Loan Agreement were used to retire the Company’s existing Loan Agreement, pay related fees and expenses, and provide additional working capital. The borrowings under the Senior Loan Agreement are secured by substantially all of the Company’s assets.
The Senior Loan Agreement has a term of five years and has a floating interest rate per annum equal to the Term SOFR plus 5.30% and the Revolving Loans accrue interest at a floating interest rate per annum equal to the Term SOFR plus 3.95%. Beginning in March 2028, the Company is required to make monthly principal
F-50
Centinel Spine, LLC and Subsidiaries
NOTES TO CONDENSED CONSOLIDATED FINANCIAL STATEMENTS (Continued)
(unaudited)
(In thousands, except unit and per unit amounts)
(unaudited)
(In thousands, except unit and per unit amounts)
3. Note Payable, net: (Continued)
payments of $2,500 through maturity on February 25, 2030. At maturity, the Company is required to pay a final fee of $3.0 million. The final fee is being amortized to interest expense over the term of the Senior Loan Agreement. Upon occurrence of certain specified events, including an initial public offering, the Company will be required to pay an exit fee of $1.8 million. In addition, the Senior Loan Agreement includes a revenue covenant that requires the Company to maintain a minimum trailing six-month net product revenue. The Company was in compliance with such covenant as of June 30, 2026 and December 31, 2025.
Total financing costs related to the Loan Agreement amounted to $2,300 which have been deferred and presented net against the related debt in the accompanying Consolidated Balance Sheets. The debt issuance costs are amortized into interest expense over the period of the related debt. Amortization of these costs during the three months ended June 30, 2026 and 2025 were $114 and $114, respectively, and $228 and $157, during the six months ended June 30, 2026 and 2025, respectively, which were recorded as interest expense.
As of June 30, 2026 the principal outstanding loan payable of $60,000, accumulated final fee of $1,423, net of unamortized financing fee of $1,683, are presented as notes payable on the Company’s condensed consolidated balance sheet.
4. Convertible Promissory Notes Payable:
On March 29, 2021, the Company entered into a convertible promissory note agreement, and subsequent amendments, (as amended, the “Note Agreement”) with Vision Biobanc pursuant to which the Company borrowed $10,000 evidenced by the Convertible Notes. The Convertible Note had an initial term of five years which was amended in conjunction with the new Senior Loan Agreement for an additional four and a half years, is unsecured and is subordinated to the obligations owing to SLR under the Senior Loan Agreement and previously Innovatus under the Loan Agreement. The outstanding principal amount of the Convertible Note accrues interest at 6.0% per year, compounded and payable quarterly, except that under the subordination agreement between SLR and Vision Biobanc, the Company may only pay one-half of the interest in cash, provided the Company is not in default under the SLR Senior Loan Agreement, and must defer payment of the other half. Vision Biobanc has the option of converting the outstanding principal amount of the Convertible Note and accrued and unpaid interest thereon into Redeemable Convertible Class B Preferred Units of the Company at a price per unit equal to $1.39435. On February 20, 2025, Vision Biobanc elected to convert the accrued and unpaid interest into Redeemable Convertible Class B Preferred Units of the Company at a price per unit equal to $1.39435. As a result, during the three and six months ended June 30, 2025, $89 and $1,542, respectively, of accrued and unpaid interest was converted into 64,034 and 1,106,418 Class B Preferred Units, respectively. During the three and six months ended June 30, 2026, $150 and $300, respectively, of accrued and unpaid interest was converted into 107,577 and 215,154 Class B Preferred Units, respectively.
The outstanding principal amount of the Convertible Note and accrued interest thereon will automatically convert into Redeemable Convertible Class B Preferred Units prior to the completion of a qualified public offering.
Total financing costs related to the Note Agreement amounted to $94 which have been deferred and presented net against the related debt in the accompanying Consolidated Balance Sheets. The debt issuance costs will be amortized into interest expense over the period of the related debt.
As of June 30, 2026 and December 31, 2025 the principal outstanding on the Convertible Note of $10,000 is presented as convertible notes payable, net of accumulated paid-in-kind interest and unamortized financing fees, on the Company’s consolidated balance sheet.
In November 2021, the Company entered into an agreement (“The Subordinated Convertible Note Agreement”) with various investors, including certain of our officers, directors and entities controlled by
F-51
Centinel Spine, LLC and Subsidiaries
NOTES TO CONDENSED CONSOLIDATED FINANCIAL STATEMENTS (Continued)
(unaudited)
(In thousands, except unit and per unit amounts)
(unaudited)
(In thousands, except unit and per unit amounts)
4. Convertible Promissory Notes Payable: (Continued)
certain of our directors, pursuant to which it issued the first tranche of subordinate convertible promissory notes (the “Subordinated Convertible Promissory Notes”) to various investors, with subsequent issuances through May 2024. The interest rate on the Subordinated Convertible Promissory Notes is subject to increases to match any greater interest rate agreed upon by the Company in subsequent issuances of subordinated convertible promissory notes. The current interest rate on these Notes is 4.42%. As of June 30, 2026 and December 31, 2025, the amount of Subordinated Convertible Promissory Notes held by our officers, directors, and entities controlled by certain of our directors was $36,919.
The maturity dates for the various tranches of outstanding Subordinated Convertible Promissory Notes issued through June 30, 2026 are as follows:
| | | |
Tranche Amount
|
| |
Maturity Date
|
| | | | |||
| | | | | $ | 5,200 | | | |
November 2030
|
| | | |
| | | | | | 7,000 | | | |
December 2030
|
| | | |
| | | | | | 10,659 | | | |
April 2031
|
| | | |
| | | | | | 250 | | | |
May 2031
|
| | | |
| | | | | | 4,466 | | | |
July 2031
|
| | | |
| | | | | | 980 | | | |
March 2032
|
| | | |
| | | | | | 10,000 | | | |
April 2032
|
| | | |
| | | | | | 6,250 | | | |
March 2033
|
| | | |
| | | | | | 250 | | | |
April 2033
|
| | | |
| | | | | | 994 | | | |
May 2033
|
| | | |
| | | | | $ | 46,049 | | | | | | | | |
For all Subordinated Convertible Promissory Notes issued, the holders of the Subordinated Convertible Promissory Notes have the option of converting the outstanding principal amount of the Subordinated Convertible Promissory Notes and accrued and unpaid interest thereon at any time into Redeemable Convertible Class B Preferred Units of the Company at a price per unit equal to $1.39435.
Additionally, such holders have the option to convert the outstanding principal amount of the Subordinated Convertible Promissory Notes and accrued and unpaid interest thereon to equity interests under a newly-created preferred unit class, should the Company issue new preferred units subsequent to November 17, 2021 at a conversion price equal to the lowest purchase price of the new preferred units minus a discount described in the Subordinated Convertible Promissory Notes Agreement. The outstanding principal amount of the Subordinated Convertible Promissory Notes and accrued and unpaid interest thereon will automatically convert into the same type of security issued in connection with a public offering at a conversion price equal to a thirty percent discount to the purchase price of the security issued in such public offering. This feature has been accounted for as an embedded derivative (see Note 2).
As of June 30, 2026 and December 31, 2025 the principal outstanding on the Subordinated Convertible Promissory Notes of $46,049, while the accumulated paid-in-kind interest was $6,936 and $5,927, respectively. These amounts are presented as convertible notes payable, net of unamortized financing fees of $819 and $896 as of June 30, 2026 and December 31, 2025, respectively, on the Company’s consolidated balance sheet.
5. Credit Agreement:
The Company entered into an agreement (“Subordinated Credit Agreement”) dated as of April 18, 2023, with entities and a trust controlled by some of our equity holders and board observers under which term loans in
F-52
Centinel Spine, LLC and Subsidiaries
NOTES TO CONDENSED CONSOLIDATED FINANCIAL STATEMENTS (Continued)
(unaudited)
(In thousands, except unit and per unit amounts)
(unaudited)
(In thousands, except unit and per unit amounts)
5. Credit Agreement: (Continued)
an aggregate principal amount equal to $5,250 and an initial interest rate of 10%, which shall be payable in-kind, were issued (the “Term Loans”). Each lender under the Subordinated Credit Agreement was issued warrants, or the Class B Warrants, to purchase Class B Preferred Units at an exercise price of $0.01. The Class B Warrants provide the lenders holding such warrants the right to purchase, in the aggregate, 564,779 Class B Preferred Units.
In the event of any repayment of the Term Loans, an initial amount equal to $7,875 minus the aggregate amount of interest accrued will be payable to the Term Loan investors (“Make-Whole amount”).
Total financing costs and origination costs related to the Term Loans agreements issued in 2023 amounted to $182 which have been deferred and presented net against the related debt in the accompanying consolidated balance sheet. The debt issuance costs will be amortized as interest expense over the period of the related debt.
On February 25, 2025, the Company entered into Amendment No. 1 to its Subordinated Credit Agreement with certain lenders under which the Term Loans were modified (the “New Term Loans”). The New Term Loans extended the maturity date to September 30, 2030 and revised the make-whole provisions to a multiple-based construct with the following Make-Whole Multiples: (i) through August 31, 2026, 2.50; (ii) September 1, 2026 to August 31, 2027, 2.75; (iii) September 1, 2027 to August 31, 2028, 3.00; (iv) September 1, 2028 to August 31, 2029, 3.25; and (v) thereafter, 3.50. All other material terms, including 10% per annum PIK interest, repayment ordering, subordination to Senior Loan Agreement, and lender origination fees, remained unchanged.
The Term Loans bear interest at 10% per annum, payable in kind by adding accrued interest to principal annually on each loan’s anniversary date. The loans are repayable on the earlier of maturity or the occurrence of a Repayment Trigger Event, which includes (i) a sale of the Company, (ii) an initial public offering of the Company or its successor, or (iii) a refinancing of the Senior Debt. Notwithstanding the foregoing, no principal, interest, or make-whole amounts are payable until full payment of the Senior Debt, in accordance with the subordination provisions.
Upon repayment, the Company is required to pay the “Make-Whole Amount,” defined as the product of $5,250 and the applicable Make-Whole Multiple then in effect, less $5,250, less the aggregate amount of interest accrued on the loans from origination to the repayment date.
The effective interest rates (the “EIR”) on the New Term Loans ranges from 10.44%–10.78%.
The Company recognizes interest expense for each New Term Loan using the effective interest method based on the applicable EIR and opening amortized cost basis. The Company accretes 10% PIK interest and the contractual Make-Whole Amount as non-cash increases to the New Term Loans balance over the remaining term. Premium amortization is recognized within interest expense as the difference between EIR-based interest expense and the combined contractual accretion for PIK and Make-Whole Amount.
On June 30, 2026 and December 31, 2025, the principal amount outstanding under the New Term Loans is $5,250, the accumulated paid-in-kind interest is $1,848 and $1,522 respectively, the accrued make-whole amount is $1,662 and $1,028, respectively, and unamortized premium is $3,738 and $4,072, respectively, resulting in a net carrying amount of $12,498 and $11,872 as of June 30, 2026 and December 31, 2025, respectively, presented as “Term notes payable, net” within noncurrent liabilities.
Principal payments are not due until the New Term Loans mature in 2030.
Upon repayment (at maturity or upon a Repayment Trigger Event), accrued and unpaid paid-in-kind interest through the repayment date and the contractual Make-Whole amount, if any, will also be due in accordance with the Subordinated Credit Agreement, as amended.
F-53
Centinel Spine, LLC and Subsidiaries
NOTES TO CONDENSED CONSOLIDATED FINANCIAL STATEMENTS (Continued)
(unaudited)
(In thousands, except unit and per unit amounts)
(unaudited)
(In thousands, except unit and per unit amounts)
5. Credit Agreement: (Continued)
The February 2025 amendment resulted in an extinguishment of the Term Loans. The Company derecognized the old debt (aggregate carrying amount of $9,390), recognized the New Term Loans at fair value of $10,750, and recorded a loss on extinguishment of debt of $1,360 for the six months ended June 30, 2025, presented as “Loss on extinguishment of debt” in the statement of comprehensive income (loss).
6. Accrued Expenses:
Accrued expenses are comprised of the following:
| | | |
June 30, 2026
|
| |
December 31, 2025
|
| ||||||
|
Accrued employee compensation & benefits
|
| | | $ | 2,266 | | | | | $ | 3,784 | | |
|
Accrued commissions & royalties
|
| | | | 8,548 | | | | | | 8,677 | | |
|
Clinical study accrual
|
| | | | 1,177 | | | | | | 1,289 | | |
|
Accrued professional services
|
| | | | 860 | | | | | | 782 | | |
|
Accrued interest payable
|
| | | | 63 | | | | | | 63 | | |
|
Accrued other liabilities
|
| | | | 2,374 | | | | | | 989 | | |
|
Total
|
| | | $ | 15,288 | | | | | $ | 15,584 | | |
7. Member’s Equity:
Capital Structure:
Centinel Spine, LLC was authorized to issue 280,952,833 units of which (a) 66,518,221 units are Redeemable Convertible Class A Preferred Units (including 717,178 Units of VB Fee Redeemable Convertible Class A Preferred Units), (b) 47,566,535 are Redeemable Convertible Class B Preferred Units, (c) 149,387,822 Units are Common units, (d) 1 unit is a Redeemable Convertible Special Member Unit, and (e) 17,480,254 units are Incentive Units. The number of authorized units is not fixed and increases automatically in accordance with the operating agreement upon the execution of conversions in accordance with the terms of certain debt instruments. The number of units authorized are sufficient to accommodate any unissued common units to provide for the conversion of all outstanding Redeemable Convertible Class A Preferred Units (including any Redeemable Convertible Class A Preferred Units underlying the outstanding warrants), Redeemable Convertible Class B Preferred Units and the exercise of all outstanding options and warrants to purchase Common units.
During the three and six months ended June 30, 2026, Vision Biobanc converted accrued and unpaid interest to 107,577 and 215,154 Class B Preferred Units, respectively (Note 4). As of June 30, 2026, Centinel Spine, LLC was authorized to issue 284,026,285 units of which (a) 66,518,221 units are Redeemable Convertible Class A Preferred Units (including 717,178 Units of VB Fee Redeemable Convertible Class A Preferred Units), (b) 49,103,261 are Redeemable Convertible Class B Preferred Units, (c) 150,924,548 Units are Common units, (d) 1 unit is a Redeemable Convertible Special Member Unit, and (e) 17,480,254 units are Incentive Units.
During the three and six months ended June 30, 2025, Vision Biobanc converted outstanding and unpaid interest to 64,034 and 1,106,418 Class B Preferred Units, respectively (Note 4).
The VB Fee Redeemable Convertible Class A Preferred Units are intended to be treated as profit interests for income tax purposes but maintain the same rights and preferences as the Redeemable Convertible Class A Preferred Units. The VB Fee Redeemable Convertible Class A Preferred Units are included in the disclosures below for Redeemable Convertible Class A Preferred Units unless otherwise noted.
F-54
Centinel Spine, LLC and Subsidiaries
NOTES TO CONDENSED CONSOLIDATED FINANCIAL STATEMENTS (Continued)
(unaudited)
(In thousands, except unit and per unit amounts)
(unaudited)
(In thousands, except unit and per unit amounts)
7. Member’s Equity: (Continued)
The holders of the issued warrants will be treated as members with respect to Redeemable Convertible Class A Preferred Units underlying the warrants only if, when, and to the extent the warrants are exercised and the applicable Redeemable Convertible Class A Preferred Units are issued to such holder. There are 3,227,300 warrants with an exercise price of $1.39435 outstanding at June 30, 2026 and December 31, 2025.
The Redeemable Convertible Class A Preferred Units, Redeemable Convertible Class B Preferred Units and Redeemable Convertible Special Member Unit are classified as temporary, or mezzanine, equity on the accompanying consolidated balance sheets since the units contained certain conversion and redemption features that are not solely within the control of the Company. The Company has not accreted the Redeemable Convertible Preferred Units to their redemption values since the units are not currently redeemable and redemption is not deemed to be probable.
Voting:
Common unit holders are entitled to one vote per common unit. Redeemable Convertible Class A Preferred Unit, not including the VB Fee Redeemable Convertible Class A Preferred Unit, and Redeemable Convertible Class B Preferred Unit holders are entitled to one vote per common unit as if such units are converted to common units. The Redeemable Convertible Special Member unit holder does not have the right to vote. The VB Fee Redeemable Convertible Class A Preferred Units holders do not have the right to vote. The Incentive Units holders do not have the right to vote.
Conversion:
All Redeemable Convertible Preferred Units shall be convertible after the issuance of such Redeemable Convertible Preferred Unit upon the election of the majority preferred investors (means the preferred unit holders, collectively, holding at least a majority of the aggregate number of outstanding Redeemable Convertible Class A Preferred Units and Redeemable Convertible Class B Preferred Units (or converted common units) then-held by all Preferred Members (other than with respect to any VB Fee Redeemable Convertible Class A Preferred Units)).
Each Redeemable Convertible Preferred Unit shall automatically be converted into Common Units at the then-applicable conversion price upon the occurrence of a public offering where the Company receives aggregate gross proceeds in an amount equal to or more than $75,000 and at a price per share of common stock to be issued in such public offering of no less than $2.79 per share after giving effect to the conversion or reorganization of the Company into another entity form and subject to appropriate adjustments in the event of any equity split, equity dividend, recapitalization, combination or similar transaction (a “Qualified Public Offering”).
Redeemable Convertible Class A Preferred Units are convertible to common units by dividing the initial unit value on December 19, 2017 subject to adjustment by the conversion price, as defined, at the time of conversion. Redeemable Convertible Class B Preferred Units are convertible to common units by dividing the initial unit value on March 30, 2020 subject to adjustment by the conversion price, as defined, at the time of conversion.
Upon Board approval of an entity conversion, change in control or Qualified Public Offering, the Redeemable Convertible Special Membership Unit shall be converted into shares of a class of common stock of the Company (or such converted entity) junior to the common stock of the Company (or such converted entity).
Distributions, Liquidation and Redemption:
Periodic distributions including those made upon any company sale, entity conversion or company liquidation will be made in order of priority as such: (a) 100% pro rata to Redeemable Convertible Class B Preferred Unit
F-55
Centinel Spine, LLC and Subsidiaries
NOTES TO CONDENSED CONSOLIDATED FINANCIAL STATEMENTS (Continued)
(unaudited)
(In thousands, except unit and per unit amounts)
(unaudited)
(In thousands, except unit and per unit amounts)
7. Member’s Equity: (Continued)
holders’ contributions, (b) Redeemable Convertible Class A Preferred Unit holders to the extent of such unit holders’ contributions, then (c) the unconverted-basis Redeemable Convertible Special Member, and then (d) Common unit holders and Incentive unit holders in proportion to their number of vested units held. If the Redeemable Convertible Class A Preferred Unit and Redeemable Convertible Class B Preferred Unit holders had already converted their units to common units, they continue to maintain respective preferences. The Special Membership Unit earns a yield of 8% per year.
Redemption of the Redeemable Convertible Class A, Redeemable Convertible Class B units and Redeemable Convertible Special Member Unit will occur upon liquidation of the Company. There are no redemption features at the option of the holder.
Certain of Member’s units in Centinel Spine LLC are subject to certain buy back provisions as outlined in the Operating Agreement giving Centinel first refusal to purchase back such units.
Term:
Centinel’s term shall continue until dissolved in accordance with Article IX of the Operating Agreement and for as long as is reasonably necessary for winding up the business.
8. Unit-based compensation:
Centinel has a unit incentive option plan that provides the Company’s compensation committee with the ability to issue options to purchase units to employees, officers, directors and consultants of the Company. Units that are expired, forfeited, canceled or otherwise terminated without having been fully exercised will be available for future grant under the plan. As of June 30, 2026 there were 17,480,254 units of incentive units authorized and 2,368,802 units available for issuance under the plan.
A summary of the Company’s option activity and related information for the period ended June 30, 2026 follows:
| | | |
Options Outstanding
|
| | | | ||||||||||||||||||||||||
| | | |
Shares Available
for Grant |
| |
Number of Units
|
| |
Weighted
Average Exercise Price |
| |
Weighted Average
Remaining Contractual Life (in years) |
| |
Aggregate
intrinsic value |
| |||||||||||||||
|
Balances, December 31, 2025
|
| | | | 2,046,615 | | | | | | 13,995,652 | | | | | $ | 0.31 | | | | | | 5.04 | | | | | | | | |
|
Units granted
|
| | | | — | | | | | | — | | | | | | — | | | | | | | | | | | | | | |
|
Units exercised
|
| | | | — | | | | | | (10,000) | | | | | | 0.35 | | | | | | | | | | | | | | |
|
Units forfeited/cancelled/expired
|
| | | | 322,187 | | | | | | (322,187) | | | | | | 0.35 | | | | | | | | | | | | | | |
|
Balances, June 30, 2026
|
| | | | 2,368,802 | | | | | | 13,663,465 | | | | | $ | 0.31 | | | | | | 4.59 | | | | | $ | 10,718 | | |
|
Vested and exercisable at June 30,
2026 |
| | | | | | | | | | 12,548,508 | | | | | $ | 0.32 | | | | | | 4.35 | | | | | $ | 9,719 | | |
Unit-Based Compensation:
Options generally vest over four years where 25% vest upon the first anniversary of the issuance date and 1/12th per quarter thereafter. As of June 30, 2026, there were total unrecognized compensation costs of $151 related to unit option awards. The unrecognized compensation cost as of June 30, 2026 is expected to be recognized over a weighted-average amortization period of 3.6 years.
The following table summarizes the components of unit-based compensation expense recorded in the Company’s statement of comprehensive income (loss):
F-56
Centinel Spine, LLC and Subsidiaries
NOTES TO CONDENSED CONSOLIDATED FINANCIAL STATEMENTS (Continued)
(unaudited)
(In thousands, except unit and per unit amounts)
(unaudited)
(In thousands, except unit and per unit amounts)
8. Unit-based compensation: (Continued)
| | | |
Three Months Ended
June 30, |
| |
Six months Ended
June 30, |
| ||||||||||||||||||
| | | |
2026
|
| |
2025
|
| |
2026
|
| |
2025
|
| ||||||||||||
|
Selling and marketing expenses
|
| | | $ | 7 | | | | | $ | 9 | | | | | $ | 14 | | | | | $ | 21 | | |
|
General and administrative expenses
|
| | | | 107 | | | | | | 22 | | | | | | 121 | | | | | | 50 | | |
|
Research and development expenses
|
| | | | 2 | | | | | | 4 | | | | | | 4 | | | | | | 9 | | |
| | | | | $ | 116 | | | | | $ | 35 | | | | | $ | 139 | | | | | $ | 80 | | |
9. Income Taxes:
The Company is a U.S. limited liability company classified as a partnership for income tax purposes and is therefore not a taxable entity in the U.S. and in many state jurisdictions. The Company is subject to state income taxes imposed directly on partnerships in certain state jurisdictions and the Company’s foreign subsidiaries are subject to corporate income taxes in their respective country of organization.
We incurred income tax expense of $61 and $108 for the three and six months ended June 30, 2026 and $36 and $150 for the three and six months ended June 30, 2025, respectively. The primary reconciling items between the statutory tax rate of the Company and the effective tax rate are attributable to partnership income not subject to taxation, the recognition of valuation allowances against net operating loss carry forwards and temporary differences, and foreign income subject to tax at lower statutory tax rates.
The Company did not have any unrecognized tax benefits relating to uncertain tax positions and did not recognize any interest or penalties related to uncertain tax positions as of June 30, 2026 and December 31, 2025.
10. Related Party Transactions:
Centinel Spine Holdings, Inc. (Holdings) is a unit holder of the Company. The Company has a net receivable to Holdings as a result of transactions enacted on Holding’s behalf of $15 as of June 30, 2026 and December 31, 2025, recorded in prepaid expenses and other current assets in the consolidated balance sheets. There were no expenses incurred in either period.
The Viscogliosi Brothers, LLC (“VB”), who has membership interest in the Company, incurred expenses on behalf of the Company which were subsequently submitted to Centinel for reimbursement. The amount due to VB was $16 which is included in due to related parties as of June 30, 2026 and December 31, 2025 in the consolidated balance sheets. There were no expenses incurred in either period.
During 2025, an investor in the Company invested in Summit Orthopedic (Summit). The Company engages in manufacturing service arrangements with Summit which provides contract manufacturing and related production services for the Company’s products. For the three months ended June 30, 2026 and 2025, the Company incurred manufacturing service expenses of approximately $35 and $24, from Summit. For the six months ended June 30, 2026 and 2025, the Company incurred manufacturing service expenses of approximately $120 and $108, from Summit.
11. Commitments and Contingencies:
Litigation:
The Company may be subject to claims and suits arising in the ordinary course of business. The Company accrues for such liabilities when they are known if they are deemed probable and can be reasonably estimated.
F-57
Centinel Spine, LLC and Subsidiaries
NOTES TO CONDENSED CONSOLIDATED FINANCIAL STATEMENTS (Continued)
(unaudited)
(In thousands, except unit and per unit amounts)
(unaudited)
(In thousands, except unit and per unit amounts)
11. Commitments and Contingencies: (Continued)
Such matters are subject to many uncertainties, and the outcomes of these matters are not within the control of the Company and may not be known for prolonged periods of time. In some actions, the claimants seek damages, as well as other relief, including injunctions prohibiting us from engaging in certain activities, which, if granted, could require significant expenditures and/or result in lost revenues. If the reasonable estimate of a probable loss is a range, and no amount within the range is a better estimate than any other, the minimum amount of the range is accrued. If a loss is reasonably possible but not known or probable, and can be reasonably estimated, the estimated loss or range of loss is disclosed. In most cases, significant judgment is required to estimate the amount and timing of a loss to be recorded. The estimates are based on consultation with legal counsel, previous settlement experience and settlement strategies. If actual outcomes are less favorable than those estimated by management, additional expense may be incurred, which could unfavorably affect future operating results. The Company expenses legal costs related to loss contingencies as incurred. The Company is not currently involved in any significant claims or legal actions that, in the opinion of management, will have a material adverse impact on the Company’s operations, financial position or cash flows.
12. Leases:
The Company leases certain facilities, equipment, and vehicles under operating leases. Our leases have initial lease terms ranging from one year to three years. Certain leases contain options to extend terms beyond the lease termination date. In these leases, we use judgment to determine whether it is reasonably possible that we will extend the lease beyond the initial term and the length of the possible extension. Leases that have terms of less than 12 months are treated as short-term and are not recognized as right of use assets or lease liabilities. As most leases do not provide an implicit rate, we use an incremental borrowing rate based on the information available at commencement date in determining the present value of future payments.
Lease expense is recognized, on a straight-line basis over the term of the lease, as a component of operating income on the Consolidated Statement of Income.
Amounts reported in the consolidated balance sheet are as follows:
| | | |
June 30,
2026 |
| |
December 31,
2025 |
| ||||||
| Operating leases: | | | | | | | | | | | | | |
|
Right of use assets
|
| | | $ | 457 | | | | | $ | 672 | | |
|
Lease liability—short term
|
| | | | 422 | | | | | | 426 | | |
|
Lease liability—long term
|
| | | | 35 | | | | | | 246 | | |
|
Total operating lease liability
|
| | | $ | 457 | | | | | $ | 672 | | |
| | | |
Three Months Ended
June 30 |
| |||||||||
| | | |
2026
|
| |
2025
|
| ||||||
|
Lease expense
|
| | | $ | 106 | | | | | $ | 102 | | |
F-58
Centinel Spine, LLC and Subsidiaries
NOTES TO CONDENSED CONSOLIDATED FINANCIAL STATEMENTS (Continued)
(unaudited)
(In thousands, except unit and per unit amounts)
(unaudited)
(In thousands, except unit and per unit amounts)
12. Leases: (Continued)
| | | |
Six Months Ended
June 30 |
| |||||||||
| | | |
2026
|
| |
2025
|
| ||||||
|
Lease expense
|
| | | $ | 213 | | | | | $ | 207 | | |
| Supplemental non-cash information: | | | | | | | | | | | | | |
|
Weighted-average remaining lease term (years)
|
| | | | 1.2 | | | | | | 2.4 | | |
|
Weighted-average discount rate
|
| | | | 5.3% | | | | | | 5.3% | | |
Future minimum lease payments under non-cancellable leases as of June 30, 2026 are as follows:
| | | |
Operating Leases
|
| |||
|
2026
|
| | | $ | 214 | | |
|
2027
|
| | | | 224 | | |
|
2028
|
| | | | 27 | | |
|
2029
|
| | | | 3 | | |
|
2030
|
| | | | — | | |
|
Total undiscounted lease payments
|
| | | $ | 468 | | |
|
Less: imputed interest
|
| | | | 11 | | |
|
Total lease liability
|
| | | $ | 457 | | |
13. Segment Reporting:
The Company’s business consists of one operating segment, which is also its one reportable segment. The Company operates in the United States and Internationally and derives revenues by providing motion preservation products to customers. The Company’s chief operating decision maker (“CODM”) is its chief executive officer, who reviews financial information presented on a consolidated basis. The CODM assesses performance and decides how to allocate resources based on segment net income (loss). This measure is used to monitor budget versus actual results to assess performance of the segment. The Company’s measure of segment assets is total assets, as reported on the consolidated balance sheets. Accounting policies for the company’s single operating segment are the same as those described in Note 2—Summary of Significant Accounting Policies.
F-59
Centinel Spine, LLC and Subsidiaries
NOTES TO CONDENSED CONSOLIDATED FINANCIAL STATEMENTS (Continued)
(unaudited)
(In thousands, except unit and per unit amounts)
(unaudited)
(In thousands, except unit and per unit amounts)
13. Segment Reporting: (Continued)
The following table presents our single segment revenue, significant expenses, and net income (loss) for the three and six months ended June 30, 2026 and 2025:
| | | |
Three Months Ended
June 30, |
| |
Six Months Ended
June 30, |
| ||||||||||||||||||
| | | |
2026
|
| |
2025
|
| |
2026
|
| |
2025
|
| ||||||||||||
| Revenue: | | | | | | | | | | | | | | | | | | | | | | | | | |
|
Revenue—US
|
| | | $ | 38,621 | | | | | $ | 26,926 | | | | | $ | 72,879 | | | | | $ | 49,542 | | |
|
Revenue—International
|
| | | | 6,118 | | | | | | 5,451 | | | | | | 12,365 | | | | | | 10,516 | | |
|
Total revenue
|
| | | | 44,739 | | | | | | 32,377 | | | | | | 85,244 | | | | | | 60,058 | | |
| Segment operating expenses: | | | | | | | | | | | | | | | | | | | | | | | | | |
|
Cost of goods sold
|
| | | | 6,705 | | | | | | 5,085 | | | | | | 12,627 | | | | | | 9,653 | | |
|
General & Administrative
|
| | | | 4,328 | | | | | | 2,984 | | | | | | 8,107 | | | | | | 5,556 | | |
|
Sales
|
| | | | 19,563 | | | | | | 15,133 | | | | | | 38,133 | | | | | | 28,382 | | |
|
Marketing
|
| | | | 1,238 | | | | | | 987 | | | | | | 2,328 | | | | | | 1,857 | | |
|
Research & Development
|
| | | | 391 | | | | | | 243 | | | | | | 617 | | | | | | 446 | | |
|
Regulatory Affairs & Quality Assurance
|
| | | | 488 | | | | | | 489 | | | | | | 1,020 | | | | | | 886 | | |
|
Clinical
|
| | | | 1,038 | | | | | | 1,142 | | | | | | 2,201 | | | | | | 2,023 | | |
|
Operations
|
| | | | 1,215 | | | | | | 1,190 | | | | | | 2,353 | | | | | | 2,216 | | |
|
Reimbursement
|
| | | | 316 | | | | | | 288 | | | | | | 612 | | | | | | 576 | | |
|
Medical Education
|
| | | | 1,008 | | | | | | 936 | | | | | | 1,690 | | | | | | 1,562 | | |
|
Depreciation and amortization
|
| | | | 1,218 | | | | | | 1,051 | | | | | | 2,490 | | | | | | 2,080 | | |
|
Inventory reserves
|
| | | | (43) | | | | | | 200 | | | | | | 42 | | | | | | 350 | | |
|
Total segment operating expenses
|
| | | | 37,465 | | | | | | 29,728 | | | | | | 72,220 | | | | | | 55,587 | | |
|
Other Segment Expenses(1)
|
| | | | 652 | | | | | | 36 | | | | | | (2,788) | | | | | | (4,974) | | |
|
Net income (loss)
|
| | | $ | 7,926 | | | | | $ | 2,685 | | | | | $ | 10,236 | | | | | $ | (503) | | |
(1)
Other segment expenses includes other income (expense), net, foreign currency gain (loss), interest expense, loss on extinguishment of debt, and income tax expense (benefit).
14. Geographic Area Information
The following table represents revenue, by geographic area, based on the location of the customer for the years presented:
| | | |
Three Months Ended
June 30, |
| |
Six Months Ended
June 30, |
| ||||||||||||||||||
| | | |
2026
|
| |
2025
|
| |
2026
|
| |
2025
|
| ||||||||||||
|
U.S.
|
| | | $ | 38,621 | | | | | $ | 26,926 | | | | | $ | 72,879 | | | | | $ | 49,542 | | |
|
International
|
| | | | 6,118 | | | | | | 5,451 | | | | | | 12,365 | | | | | | 10,516 | | |
|
Total revenue
|
| | | $ | 44,739 | | | | | | 32,377 | | | | | | 85,244 | | | | | | 60,058 | | |
F-60
Centinel Spine, LLC and Subsidiaries
NOTES TO CONDENSED CONSOLIDATED FINANCIAL STATEMENTS (Continued)
(unaudited)
(In thousands, except unit and per unit amounts)
(unaudited)
(In thousands, except unit and per unit amounts)
14. Geographic Area Information (Continued)
The table below presents property and equipment, net by geographic area:
| | | |
As of
|
| |||||||||
| | | |
June 30, 2026
|
| |
December 31, 2025
|
| ||||||
|
U.S.
|
| | | $ | 7,397 | | | | | $ | 5,840 | | |
|
International
|
| | | | 1,512 | | | | | | 1,436 | | |
|
Total property and equipment, net
|
| | | $ | 8,909 | | | | | $ | 7,276 | | |
15. Subsequent Events:
Subsequent events have been evaluated through October 7, 2026, which is the date the consolidated financial statements were issued.
F-61
Shares
Class A Common Stock
Prospectus
| |
Morgan Stanley
|
| |
Goldman Sachs & Co. LLC
|
| |
Piper Sandler
|
|
| |
Canaccord Genuity
|
| |
BTIG
|
|
, 2026
Through and including , 2026 (the 25th day after the date of this prospectus), all dealers that effect transactions in these securities, whether or not participating in this offering, may be required to deliver a prospectus. This is in addition to the dealers’ obligation to deliver a prospectus when acting as underwriters and with respect to their unsold allotments or subscriptions.
PART II
INFORMATION NOT REQUIRED IN PROSPECTUS
Item 13. Other Expenses of Issuance and Distribution.
The following table sets forth the fees and expenses, other than the underwriting discounts and commissions, payable by the Registrant in connection with the offer and sale of Class A Common Stock being registered. All amounts shown are estimates except for the Securities and Exchange Commission (“SEC”) registration fee, the Financial Industry Regulatory Authority, Inc. (“FINRA”) filing fee and NYSE listing fee.
|
Item
|
| |
Amount
to be paid |
| |||
|
SEC registration fee
|
| | | $ | 8,700 | | |
|
FINRA filing fee
|
| | | | * | | |
|
NYSE listing fee
|
| | | | * | | |
|
Printing expenses
|
| | | | * | | |
|
Legal fees and expenses
|
| | | | * | | |
|
Accounting fees and expenses
|
| | | | * | | |
|
Transfer agent fees and expenses
|
| | | | * | | |
|
Miscellaneous expenses
|
| | | | * | | |
|
Total
|
| | | $ | * | | |
*
To be completed by amendment
Item 14. Indemnification of Directors and Officers.
Section 102 of the Delaware General Corporation Law of the State of Delaware (the “DGCL”) permits a corporation to eliminate the personal liability of directors of a corporation to the corporation or its stockholders for monetary damages for a breach of fiduciary duty as a director, except where the director breached his or her duty of loyalty, failed to act in good faith, engaged in intentional misconduct or knowingly violated a law, authorized the payment of a dividend or approved a stock repurchase in violation of Delaware corporate law or obtained an improper personal benefit. Upon the closing of the offering, our amended and restated certificate of incorporation will provide that none of our directors shall be personally liable to us or our stockholders for monetary damages for any breach of fiduciary duty as a director, notwithstanding any provision of law imposing such liability, except to the extent that the DGCL prohibits the elimination or limitation of liability of directors for breaches of fiduciary duty. If in the future the DGCL is amended to authorize corporate action further eliminating or limiting the personal liability of Directors, our amended and restated certificate of incorporation will provide that the liability of a director shall be eliminated or limited to the fullest extent permitted by the DGCL, as so amended.
Section 145 of the DGCL provides that a corporation has the power to indemnify a director, officer, employee or agent of the corporation, or a person serving at the request of the corporation for another corporation, partnership, joint venture, trust or other enterprise in related capacities against expenses (including attorneys’ fees), judgments, fines and amounts paid in settlement actually and reasonably incurred by the person in connection with any threatened, pending or completed action, suit or proceeding, whether civil, criminal, administrative or investigative, to which he or she was or is a party or is threatened to be made a party by reason of such position, if such person acted in good faith and in a manner he or she reasonably believed to be in or not opposed to the best interests of the corporation, and, in any criminal action or proceeding, had no reasonable cause to believe his or her conduct was unlawful, except that, in the case of actions brought by or in the right of the corporation, no indemnification shall be made with respect to any claim, issue or matter as to which such person shall have been adjudged to be liable to the corporation unless and only to the extent that the adjudicating court determines that, despite the adjudication of liability but in view of all of the circumstances of the case, such person is fairly and reasonably entitled to indemnity for such expenses which such court shall deem proper.
II-1
Our amended and restated certificate of incorporation, which will become effective immediately prior to the completion of this offering will contain provisions that limit the liability of our directors and officers for monetary damages to the fullest extent permitted by the Delaware General Corporation Law, as amended (the “DGCL”). The DGCL provides that directors or officers of a corporation will not be personally liable to us or our stockholders for monetary damages for any breach of fiduciary duties as directors or officers, except liability for any:
•
transaction from which the director or officer derives an improper personal benefit;
•
act or omission not in good faith or that involves intentional misconduct or a knowing violation of law;
•
unlawful payment of dividends or redemption of shares by a director;
•
an officer in any action by or in the right of the corporation; or
•
breach of a director’s or officer’s duty of loyalty to the corporation or its stockholders.
These limitations of liability will not apply to liabilities arising under federal securities laws and will not affect the availability of equitable remedies such as injunctive relief or recession.
Our amended and restated certificate of incorporation will require us to indemnify our directors and officers to the fullest extent permitted by DGCL. Our amended and restated certification of incorporation will also provide that we are obligated to advance expenses (including attorney’s fees) incurred by any indemnified person in advance of the final disposition of any action or proceeding provided that the indemnified person undertakes to repay such advances if it is ultimately determined that such person is not entitled to indemnification.
We have entered, and expect to continue to enter, into separate agreements to indemnify our directors, executive officers and other employees as determined by our board of directors. With specified exceptions, these agreements provide for indemnification for related expenses including, among other things, attorneys’ fees, judgments, fines and settlement amounts incurred by any of these individuals in any action or proceeding. We also maintain directors’ and officers’ liability insurance pursuant to which our directors and officers are insured against liability for actions taken in their capacities as directors and officers.
In any underwriting agreement we enter into in connection with the sale of Class A Common Stock being registered hereby, the underwriters will agree to indemnify, under certain conditions, us, our directors, our officers and persons who control us within the meaning of the Securities Act of 1933, as amended, or the Securities Act, against certain liabilities.
Insofar as indemnification for liabilities arising under the Securities Act may be permitted to our directors, officers and controlling persons pursuant to the foregoing provisions, or otherwise, we have been advised that in the opinion of the SEC such indemnification is against public policy as expressed in the Securities Act and is, therefore, unenforceable. Please read the section titled “Item 17. Undertakings” for more information on the SEC’s position regarding such indemnification provisions.
II-2
Item 15. Recent Sales of Unregistered Securities.
Set forth below is information regarding unregistered securities issued by Centinel Holdco since formation in April 2026:
On April 24, 2026, in connection with its incorporation, Centinel Holdco issued one share of its common stock to Varun Gandhi for $0.01. The issuance of such share of Class A Common Stock was not registered under the Securities Act because the share was offered and sold in a transaction exempt from registration under Section 4(a)(2) of the Securities Act.
Item 16. Exhibits and Financial Statement Schedules
(a)
Exhibits. See the Exhibit Index included in this registration statement, which is incorporated by reference herein.
(b)
Financial Statement Schedules. All schedules have been omitted because they are not required or because the required information is given in the financial statements or notes to those statements.
Item 17. Undertakings.
(a)
The undersigned registrant hereby undertakes to provide to the underwriters at the closing specified in the underwriting agreement certificates in such denominations and registered in such names as required by the underwriters to permit prompt delivery to each purchaser.
(b)
Insofar as indemnification for liabilities arising under the Securities Act may be permitted to directors, officers and controlling persons of the Registrant pursuant to the foregoing provisions, or otherwise, the Registrant has been advised that in the opinion of the SEC such indemnification is against public policy as expressed in the Securities Act and is, therefore, unenforceable. In the event that a claim for indemnification against such liabilities (other than the payment by the Registrant of expenses incurred or paid by a director, officer, or controlling person of the Registrant in the successful defense of any action, suit, or proceeding) is asserted by such director, officer, or controlling person in connection with the securities being registered, the Registrant will, unless in the opinion of its counsel the matter has been settled by controlling precedent, submit to a court of appropriate jurisdiction, the question whether such indemnification by it is against public policy as expressed in the Securities Act and will be governed by the final adjudication of such issue.
(c)
The Registrant hereby further undertakes that:
(1)
For purposes of determining any liability under the Securities Act, the information omitted from the form of prospectus filed as part of this registration statement in reliance upon Rule 430A and contained in a form of prospectus filed by the Registrant pursuant to Rule 424(b)(1) or (4) or 497(h) under the Securities Act shall be deemed to be part of this registration statement as of the time it was declared effective.
(2)
For the purpose of determining any liability under the Securities Act, each post-effective amendment that contains a form of prospectus shall be deemed to be a new registration statement relating to the securities offered therein, and the offering of such securities at that time shall be deemed to be the initial bona fide offering thereof.
II-3
EXHIBIT INDEX
|
Exhibit No.
|
| |
Description
|
|
| 1.1* | | | Form of Underwriting Agreement. | |
| 3.1* | | | Certificate of Incorporation of Centinel Spine Holdco, Inc., as currently in effect. | |
| 3.2* | | |
Form of Amended and Restated Certificate of Incorporation of Centinel Spine Holdco, Inc., to be effective upon the consummation of the Organizational Transactions.
|
|
| 3.3* | | | Bylaws of Centinel Spine Holdco, Inc., as currently in effect. | |
| 3.4* | | |
Form of Amended and Restated Bylaws of Centinel Spine Holdco, Inc., to be effective upon the consummation of the Organizational Transactions.
|
|
| 4.1* | | | Specimen Class A Common Stock Certificate. | |
| 4.2* | | |
Form of Registration Rights Agreement, to be effective upon the consummation of the Organizational Transactions.
|
|
| 5.1* | | | Opinion of Blank Rome LLP. | |
| 10.1* | | |
Agreement of Lease, dated as of January 28, 2011, between Centinel Spine Inc. and DPRM 900 Airport Road, LP.
|
|
| 10.1.1* | | |
Commercial Lease Renewal Option Agreement, dated as of May 17, 2013, between Centinel Spine, Inc. and DPRM 900 Airport Road, LP.
|
|
| 10.1.2* | | |
Lease Amendment and Expansion Agreement, dated as of February 22, 2016, between Centinel Spine Inc. and DPRM 900 Airport Road, LP.
|
|
| 10.1.3* | | |
Third Lease Amendment, dated as of December 5, 2016, between Centinel Spine Inc. and DPRM 900 Airport Road, LP.
|
|
| 10.1.4* | | |
Fourth Lease Amendment, dated as of February 5, 2019, between Centinel Spine, LLC and DPRM 900 Airport Road, LP.
|
|
| 10.1.5* | | |
Fourth Lease Amendment (Revision 2), dated as of October 2, 2021, between Centinel Spine Inc. and DPRM 900 Airport Road, LP.
|
|
| 10.1.6* | | |
Fourth Lease Amendment Option Acceptance Agreement, dated as of June 28, 2022, between Centinel Spine Inc. and DPRM 900 Airport Road, LP.
|
|
| 10.1.7* | | |
Fifth Lease Amendment, dated as of December 2, 2022, between Centinel Spine Inc. and DPRM 900 Airport Road, LP.
|
|
| 10.1.8* | | |
Fifth Lease Amendment, dated as of November 28, 2023, between Centinel Spine, LLC and DPRM 900 Airport Road, LP.
|
|
| 10.2*† | | |
Supply Agreement, dated as of April 1, 2024, between Centinel Spine, LLC and Medicoat AG, with updated on September 12, 2025.
|
|
| 10.3*† | | |
Supply Agreement, dated as of January 1, 2025, between Centinel Spine, LLC and Hammill Manufacturing Co.
|
|
| 10.3.1*† | | |
Supply Agreement Amendment 2026, dated as of January 1, 2026, between Centinel Spine, LLC and Hammill Manufacturing Co.
|
|
| 10.4*† | | |
Supply Agreement, dated as of August 12, 2024, Centinel Spine, LLC and Fruh Packaging Inc.
|
|
| 10.5*† | | |
Supply Agreement, dated as of August 12, 2024, Centinel Spine and Fruh Verpackungstechnik AG.
|
|
| 10.6*† | | |
Supply Agreement, dated as of January 1, 2026, between Centinel Spine, LLC and Bricon Technology GmbH.
|
|
| 10.7* | | |
Loan and Security Agreement, dated as of February 25, 2025, among Centinel Spine, LLC, CS Swiss Holdings, LLC, SLR Investment Corp., and the lender parties thereto.
|
|
| 10.7.1* | | |
Credit Agreement, dated as of February 25, 2025, between Centinel Spine, LLC and Gemino Healthcare Finance, LLC d/b/a SLR Healthcare ABL, with the form of revolving note attached thereto.
|
|
II-4
|
Exhibit No.
|
| |
Description
|
|
| 10.7.2* | | |
Intercreditor Agreement, dated as of February 25, 2025, among Centinel Spine, LLC, Gemino Healthcare Finance, LLC d/b/a SLR Healthcare ABL, SLR Investment Corp., and the lender parties thereto.
|
|
| 10.8* | | |
Credit Agreement, dated as of April 18, 2023, among Centinel Spine, LLC and the lender parties thereto, with the form of promissory note attached thereto.
|
|
| 10.8.1* | | |
Amendment No.1 to Credit Agreement and Joinder Agreement, dated as of February 25, 2025, among Centinel Spine, LLC and the lender parties thereto.
|
|
| 10.8.2* | | |
Subordination Agreement, dated as of February 25, 2025, among Centinel Spine, LLC, SLR Investment Corp., Gemino Healthcare Finance, LLC d/b/a SLR Healthcare ABL, and the junior lender parties thereto.
|
|
| 10.9* | | |
Convertible Note Purchase Agreement, dated as of March 29, 2021, between Centinel Spine, LLC and Vision Biobanc Holdings, Inc., with the form of convertible promissory note attached thereto.
|
|
| 10.9.1* | | |
Letter Agreement, dated as of April 15, 2021, between Centinel Spine, LLC and Vision Biobanc Holdings, Inc.
|
|
| 10.9.2* | | |
Letter Agreement, dated as of July 10, 2021, among Centinel Spine, LLC, Vision Biobanc Holdings, Inc. and Millenium Trust Company LLC, custodian for the benefit of Vision Biobanc Holdings, Inc.
|
|
| 10.9.3* | | |
Assignment of Interest, dated as of September 5, 2024, between Vision Biobanc Holdings, LLC and Millennium Trust Company.
|
|
| 10.9.4* | | |
Conversion Agreement and Note Amendment, dated as of February 20, 2025, between Centinel Spine, LLC and Vision Biobanc Holdings, LLC.
|
|
| 10.9.5* | | |
Subordination Agreement, dated as of February 25, 2025, among Vision Biobanc Holdings, LLC, SLR Investment Corp. and Gemino Healthcare Finance, LLC d/b/a SLR Healthcare ABL.
|
|
| 10.10* | | |
Subordinated Convertible Promissory Note Purchase Agreement, dated as of November 17, 2021, among Centinel Spine, LLC and the purchasers party thereto, with the form of subordinated convertible promissory note attached thereto.
|
|
| 10.10.1* | | |
First Amendment to Subordinated Convertible Promissory Note Purchase Agreement, dated as of January 6, 2023, among Centinel Spine, LLC and the purchasers thereto.
|
|
| 10.10.2* | | |
Second Amendment to Subordinated Convertible Promissory Note Purchase Agreement, dated as of January 30, 2024, among Centinel Spine, LLC and the purchasers party thereto.
|
|
| 10.10.3* | | |
Subordination Agreement, dated as of February 25, 2025, among Centinel Spine, LLC, SLR Investment Corp., Gemino Healthcare Finance, LLC, and the subordinated creditors party thereto.
|
|
| 10.11#* | | | Form of Indemnification Agreement for directors and executive officers, as currently in effect. | |
| 10.12#* | | |
Form of Indemnification Agreement for directors and executive officers, to be effective upon the consummation of the Organizational Transactions.
|
|
| 10.13#* | | |
Employment Agreement between Steven Murray and Centinel Spine, LLC, effective as of March 16, 2020.
|
|
| 10.14#* | | |
Employment Agreement between Varun Gandhi and Centinel Spine, LLC, effective as of August 16, 2020.
|
|
| 10.15#* | | |
Health Benefits Addendum, dated September 17, 2024, to Mr. Gandhi’s Employment Agreement with Centinel Spine, LLC
|
|
| 10.16#* | | |
Retention Bonus Agreement between Steven Murray and Centinel Spine, LLC, effective as of May 23, 2025.
|
|
| 10.17#* | | |
Retention Bonus Agreement between Varun Gandhi and Centinel Spine, LLC, effective as of May 23, 2025.
|
|
| 10.18#* | | | Centinel Spine, LLC Change in Control Bonus Plan, effective as of December 2, 2024 | |
II-5
|
Exhibit No.
|
| |
Description
|
|
| 10.19#* | | |
Change in Control Bonus Plan, Award Agreement between Steven Murray and Centinel Spine, LLC, effective as of December 30, 2024.
|
|
| 10.20#* | | |
Change in Control Bonus Plan, Award Agreement between Varun Gandhi and Centinel Spine, LLC, effective as of December 26, 2024.
|
|
| 10.21#* | | | Centinel Spine, LLC Unit Incentive Plan, as amended, and form of unit option agreement | |
| 10.22#* | | |
First Amendment to Centinel Spine, LLC Unit Incentive Plan, to be effective upon the consummation of the Organizational Transactions.
|
|
| 10.23#* | | |
Centinel Spine Holdco, Inc. 2026 Omnibus Incentive Plan and related form agreements, to be effective upon the consummation of the Organizational Transactions.
|
|
| 10.24#* | | |
Centinel Spine Holdco, Inc. Annual Cash Bonus Plan, to be effective upon the consummation of the Organizational Transactions.
|
|
| 10.25#* | | |
Non-Employee Director Compensation Program, to be effective upon the consummation of the Organizational Transactions.
|
|
| 10.26* | | |
Form of Exchange Agreement, to be effective upon the consummation of the Organizational Transactions.
|
|
| 10.27* | | |
Form of Tax Receivable Agreement, to be effective upon the consummation of the Organizational Transactions.
|
|
| 10.28* | | |
Form of Amended and Restated Operating Agreement of Centinel Spine, LLC, to be effective immediately prior to the consummation of the Offering.
|
|
| 21.1* | | |
Subsidiaries of Centinel Spine Holdco, Inc., to be in effect upon the consummation of the Organizational Transactions.
|
|
| 23.1 | | | | |
| 23.2 | | | | |
| 23.3* | | | Consent of Blank Rome LLP (included in Exhibit 5.1). | |
| 24.1 | | | | |
| 107 | | | |
*
To be filed by amendment.
#
Indicates management contract or compensatory plan.
†
Certain portions of this exhibit have been omitted pursuant to Item (601)(b)(10) of Regulation S-K.
II-6
SIGNATURES
Pursuant to the requirements of the Securities Act of 1933, as amended, the Registrant has duly caused this Registration Statement on Form S-1 to be signed on its behalf by the undersigned, thereunto duly authorized, in West Chester, Commonwealth of Pennsylvania, on this 7th day of October 2026.
Centinel Spine Holdco, Inc.
By:
/s/ Steven Murray
Name:
Steven Murray
Title:
Chief Executive Officer
POWER OF ATTORNEY
KNOW ALL PERSONS BY THESE PRESENTS, that each person whose signature appears below constitutes and appoints Steven Murray and Varun Gandhi, and each of them, his true and lawful attorneys-in-fact and agents, with full power of substitution and resubstitution, for him and in his name, place, and stead, in any and all capacities, to sign any and all amendments (including post-effective amendments) to this Registration Statement and any and all additional registration statements pursuant to Rule 462(b) under the Securities Act of 1933, as amended, and to file the same, with all exhibits thereto, and all other documents in connection therewith, with the Securities and Exchange Commission, granting unto each said attorney-in-fact and agents full power and authority to do and perform each and every act and thing requisite or necessary to be done in connection therewith, as fully to all intents and purposes as he might or could do in person, hereby ratifying and confirming all that said attorneys-in-fact and agents or either of them or their or his substitute or substitutes may lawfully do or cause to be done by virtue hereof.
Pursuant to the requirements of the Securities Act of 1933, as amended, this Registration Statement has been signed by the following persons in the capacities and on the dates indicated:
| |
Name
|
| |
Title
|
| |
Date
|
|
| |
/s/ Steven Murray
Steven Murray
|
| |
Chief Executive Officer (Principal Executive
Officer) |
| | October 7, 2026 | |
| |
/s/ Varun Gandhi
Varun Gandhi
|
| |
Chief Financial Officer (Principal Financial
Officer and Principal Accounting Officer) |
| | October 7, 2026 | |
| |
/s/ Ali Abdullah Al Amri
Ali Abdullah Al Amri
|
| | Director | | | October 7, 2026 | |
| |
/s/ Robert Donohue
Robert Donohue
|
| | Director | | | October 7, 2026 | |
| |
/s/ Craig Greener
Craig Greener
|
| | Director | | | October 7, 2026 | |
| |
/s/ Dirk Kuyper
Dirk Kuyper
|
| | Director | | | October 7, 2026 | |
II-7
| |
Name
|
| |
Title
|
| |
Date
|
|
| |
/s/ Deepankar Panigrahi
Deepankar Panigrahi
|
| | Director | | | October 7, 2026 | |
| |
/s/ Anthony Viscogliosi
Anthony Viscogliosi
|
| | Director | | | October 7, 2026 | |
| |
/s/ Marc Viscogliosi
Marc Viscogliosi
|
| | Director | | | October 7, 2026 | |
II-8