☒ QUARTERLY REPORT PURSUANT TO SECTION 13 OR 15(d) OF THE SECURITIES EXCHANGE ACT OF 1934
For the quarterly period ended September 30, 2026
or
☐ TRANSITION REPORT PURSUANT TO SECTION 13 OR 15(d) OF THE SECURITIES EXCHANGE ACT OF 1934
For the transition period from __________ to __________
Commission File Number: 001-02960
NPK International Inc.
(Exact name of registrant as specified in its charter)
Delaware
72-1123385
(State or other jurisdiction of incorporation or organization)
(I.R.S. Employer Identification No.)
9320 Lakeside Boulevard,
Suite 100
The Woodlands,
Texas
77381
(Address of principal executive offices)
(Zip Code)
(281) 362-6800
(Registrant’s telephone number, including area code)
Not Applicable
(Former name, former address and former fiscal year, if changed since last report)
Securities registered pursuant to Section 12(b) of the Act:
Title of each class
Trading Symbol(s)
Name of each exchange on which registered
Common Stock, $0.01 par value
NPKI
New York Stock Exchange
Indicate by check mark whether the registrant (1) has filed all reports required to be filed by Section 13 or 15(d) of the Securities Exchange Act of 1934 during the preceding 12 months (or for such shorter period that the registrant was required to file such reports), and (2) has been subject to such filing requirements for the past 90 days.
Yes☑ No ☐
Indicate by check mark whether the registrant has submitted electronically every Interactive Data File required to be submitted pursuant to Rule 405 of Regulation S-T (§232.405 of this chapter) during the preceding 12 months (or for such shorter period that the registrant was required to submit such files).
Yes☑ No ☐
Indicate by check mark whether the registrant is a large accelerated filer, an accelerated filer, a non-accelerated filer, a smaller reporting company, or an emerging growth company. See the definitions of “large accelerated filer,” “accelerated filer,” “smaller reporting company,” and “emerging growth company” in Rule 12b-2 of the Exchange Act.
Large accelerated filer
☐
Accelerated filer
☑
Non-accelerated filer
☐
Smaller reporting company
☐
Emerging growth company
☐
If an emerging growth company, indicate by check mark if the registrant has elected not to use the extended transition period for complying with any new or revised financial accounting standards provided pursuant to Section 13(a) of the Exchange Act. ☐
Indicate by check mark whether the registrant is a shell company (as defined in Rule 12b-2 of the Exchange Act).
Yes ☐ No ☑
As of October 28, 2026, a total of 83,923,121 shares of common stock, $0.01 par value per share, were outstanding.
This Quarterly Report on Form 10-Q contains “forward-looking statements” within the meaning of Section 27A of the Securities Act of 1933, as amended, Section 21E of the Securities Exchange Act of 1934, as amended, and the Private Securities Litigation Reform Act of 1995, as amended. We also may provide oral or written forward-looking statements in other materials we release to the public. Words such as “will,” “may,” “could,” “would,” “should,” “anticipates,” “believes,” “estimates,” “expects,” “plans,” “intends,” and similar expressions are intended to identify these forward-looking statements but are not the exclusive means of identifying them. These forward-looking statements reflect the current views of our management as of the filing date of this Quarterly Report on Form 10-Q; however, various risks, uncertainties, contingencies, and other factors, some of which are beyond our control, are difficult to predict and could cause our actual results, performance, or achievements to differ materially from those expressed in, or implied by, these statements.
We assume no obligation to update, amend, or clarify publicly any forward-looking statements, whether as a result of new information, future events, or otherwise, except as required by securities laws. In light of these risks, uncertainties, and assumptions, the forward-looking events discussed in this Quarterly Report on Form 10-Q might not occur.
For further information regarding these and other factors, risks, and uncertainties that could cause actual results to differ, we refer you to the risk factors set forth in Item 1A “Risk Factors” in our Annual Report on Form 10-K for the year ended December 31, 2025.
1
PART I FINANCIAL INFORMATION
ITEM 1. Financial Statements
NPK International Inc.
Condensed Consolidated Balance Sheets
(Unaudited)
(In thousands, except share data)
September 30, 2026
December 31, 2025
ASSETS
Cash and cash equivalents
$
4,230
$
5,140
Receivables, net of allowance of $543 and $330, respectively
65,735
59,806
Inventories
16,417
11,500
Prepaid expenses and other current assets
6,947
5,046
Total current assets
93,329
81,492
Property, plant and equipment, net
257,058
233,048
Operating lease assets
11,573
11,195
Goodwill
75,914
76,341
Other intangible assets, net
17,525
21,297
Deferred tax assets
1,558
5,535
Other assets
8,682
12,850
Total assets
$
465,639
$
441,758
LIABILITIES AND STOCKHOLDERS’ EQUITY
Current debt
$
5,067
$
5,170
Accounts payable
23,353
22,327
Accrued liabilities
27,175
29,647
Total current liabilities
55,595
57,144
Long-term debt, less current portion
21,229
11,692
Noncurrent operating lease liabilities
9,778
9,877
Deferred tax liabilities
11,039
7,476
Other noncurrent liabilities
1,908
4,413
Total liabilities
99,549
90,602
Commitments and contingencies (Note 9)
Common stock, $0.01 par value (200,000,000 shares authorized and 89,969,464 and 90,134,477 shares issued, respectively)
900
902
Paid-in capital
489,664
489,632
Accumulated other comprehensive loss
(2,716)
(1,610)
Retained earnings (deficit)
(71,993)
(100,527)
Treasury stock, at cost (6,046,343 and 5,616,798 shares, respectively)
(49,765)
(37,241)
Total stockholders’ equity
366,090
351,156
Total liabilities and stockholders’ equity
$
465,639
$
441,758
See Accompanying Notes to Unaudited Condensed Consolidated Financial Statements
2
NPK International Inc.
Condensed Consolidated Statements of Operations
(Unaudited)
Three Months Ended September 30,
Nine Months Ended September 30,
(In thousands, except per share data)
2026
2025
2026
2025
Revenues
$
76,276
$
68,838
$
232,931
$
201,848
Cost of revenues
52,371
46,870
151,681
129,449
Selling, general and administrative expenses
14,738
13,279
42,089
38,682
Other operating (income) loss, net
8
(368)
(511)
(497)
Operating income from continuing operations
9,159
9,057
39,672
34,214
Foreign currency exchange (gain) loss
101
31
92
(909)
Interest (income) expense, net
460
(47)
1,130
(94)
Income from continuing operations before income taxes
8,598
9,073
38,450
35,217
Provision for income taxes from continuing operations
2,268
3,010
9,773
9,995
Income from continuing operations
6,330
6,063
28,677
25,222
Loss from discontinued operations
(221)
(409)
(143)
(887)
Net income
$
6,109
$
5,654
$
28,534
$
24,335
Income (loss) per common share - basic:
Income from continuing operations
$
0.07
$
0.07
$
0.34
$
0.30
Loss from discontinued operations
—
—
—
(0.01)
Net income
$
0.07
$
0.07
$
0.34
$
0.29
Income (loss) per common share - diluted:
Income from continuing operations
$
0.07
$
0.07
$
0.33
$
0.29
Loss from discontinued operations
—
—
—
(0.01)
Net income
$
0.07
$
0.07
$
0.33
$
0.28
See Accompanying Notes to Unaudited Condensed Consolidated Financial Statements
3
NPK International Inc.
Condensed Consolidated Statements of Comprehensive Income (Loss)
(Unaudited)
Three Months Ended September 30,
Nine Months Ended September 30,
(In thousands)
2026
2025
2026
2025
Net income
$
6,109
$
5,654
$
28,534
$
24,335
Foreign currency translation adjustments
7
(166)
(1,106)
203
Comprehensive income
$
6,116
$
5,488
$
27,428
$
24,538
See Accompanying Notes to Unaudited Condensed Consolidated Financial Statements
4
NPK International Inc.
Condensed Consolidated Statements of Stockholders’ Equity
(Unaudited)
(In thousands)
Common Stock
Paid-In Capital
Accumulated Other Comprehensive Loss
Retained Earnings (Deficit)
Treasury Stock
Total
Balance at June 30, 2026
$
900
$
487,744
$
(2,723)
$
(78,102)
$
(36,442)
$
371,377
Net income
—
—
—
6,109
—
6,109
Employee stock options, restricted stock and employee stock purchase plan
—
(109)
—
—
71
(38)
Stock-based compensation expense
—
2,029
—
—
—
2,029
Treasury shares purchased at cost
—
—
—
—
(13,394)
(13,394)
Foreign currency translation, net of tax
—
—
7
—
—
7
Balance at September 30, 2026
$
900
$
489,664
$
(2,716)
$
(71,993)
$
(49,765)
$
366,090
Balance at June 30, 2025
$
1,117
$
629,952
$
(2,502)
$
(120,785)
$
(178,947)
$
328,835
Net income
—
—
—
5,654
—
5,654
Employee stock options, restricted stock and employee stock purchase plan
—
(691)
—
—
2,188
1,497
Stock-based compensation expense
—
1,541
—
—
—
1,541
Treasury shares purchased at cost
—
—
—
—
(3,438)
(3,438)
Foreign currency translation, net of tax
—
—
(166)
—
—
(166)
Balance at September 30, 2025
$
1,117
$
630,802
$
(2,668)
$
(115,131)
$
(180,197)
$
333,923
Balance at December 31, 2025
$
902
$
489,632
$
(1,610)
$
(100,527)
$
(37,241)
$
351,156
Net income
—
—
—
28,534
—
28,534
Employee stock options, restricted stock and employee stock purchase plan
—
(5,030)
—
—
2,459
(2,571)
Stock-based compensation expense
—
6,154
—
—
—
6,154
Treasury shares purchased at cost
—
—
(16,077)
(16,077)
Treasury shares cancelled
(2)
(1,092)
1,094
—
Foreign currency translation, net of tax
—
—
(1,106)
—
—
(1,106)
Balance at September 30, 2026
$
900
$
489,664
$
(2,716)
$
(71,993)
$
(49,765)
$
366,090
Balance at December 31, 2024
$
1,117
$
633,239
$
(2,871)
$
(139,466)
$
(165,524)
$
326,495
Net income
—
—
—
24,335
—
24,335
Employee stock options, restricted stock and employee stock purchase plan
—
(6,574)
—
—
5,977
(597)
Stock-based compensation expense
—
4,137
—
—
—
4,137
Treasury shares purchased at cost
—
—
—
—
(20,650)
(20,650)
Foreign currency translation, net of tax
—
—
203
—
—
203
Balance at September 30, 2025
$
1,117
$
630,802
$
(2,668)
$
(115,131)
$
(180,197)
$
333,923
See Accompanying Notes to Unaudited Condensed Consolidated Financial Statements
5
NPK International Inc.
Condensed Consolidated Statements of Cash Flows
(Unaudited)
Nine Months Ended September 30,
(In thousands)
2026
2025
Cash flows from operating activities:
Net income
$
28,534
$
24,335
Adjustments to reconcile net income to net cash provided by operations:
Gain on divestitures
(500)
—
Depreciation and amortization
25,404
18,235
Stock-based compensation expense
6,154
4,137
Provision for deferred income taxes
7,697
9,362
Credit loss expense
95
19
Gain on sale of assets
(1,261)
(2,203)
Amortization of original issue discount and debt issuance costs
237
394
Change in assets and liabilities:
Increase in receivables
(7,558)
(2,462)
(Increase) decrease in inventories
(4,790)
5,007
Increase in other assets
(3,119)
(3,711)
Increase in accounts payable
2,425
1,466
Increase (decrease) in accrued liabilities and other
(3,172)
405
Net cash provided by operating activities
50,146
54,984
Cash flows from investing activities:
Capital expenditures
(45,519)
(34,419)
Proceeds from divestitures, net of cash disposed
5,490
14,485
Proceeds from sale of property, plant and equipment
1,811
3,819
Other investing activities
(627)
3,089
Net cash used in investing activities
(38,845)
(13,026)
Cash flows from financing activities:
Borrowings on lines of credit
49,100
—
Payments on lines of credit
(38,500)
—
Debt issuance costs
—
(811)
Purchases of treasury stock
(19,330)
(22,695)
Proceeds from employee stock plans
528
1,497
Other financing activities
(3,979)
(2,639)
Net cash used in financing activities
(12,181)
(24,648)
Effect of exchange rate changes on cash
(30)
91
Net increase (decrease) in cash, cash equivalents, and restricted cash
(910)
17,401
Cash, cash equivalents, and restricted cash at beginning of period
5,140
18,237
Cash, cash equivalents, and restricted cash at end of period
$
4,230
$
35,638
See Accompanying Notes to Unaudited Condensed Consolidated Financial Statements
6
NPK INTERNATIONAL INC.
NOTES TO UNAUDITED CONDENSED CONSOLIDATED FINANCIAL STATEMENTS
Note 1 – Basis of Presentation and Significant Accounting Policies
NPK International Inc. is a worksite access solutions company that manufactures, sells, and rents recyclable composite matting products, along with a full suite of services, including planning, logistics, and site restoration. We serve customers in various markets including power transmission, oil and natural gas exploration and production, pipeline, renewable energy, petrochemical, construction and other industries within the United States and United Kingdom. We also sell our manufactured recyclable composite mats to customers around the world, with power transmission being the primary end-market.
The accompanying unaudited condensed consolidated financial statements of NPK International Inc. and our wholly-owned subsidiaries, which we collectively refer to as “NPK,” the “Company,” “we,” “our,” or “us,” have been prepared in accordance with Rule 10-01 of Regulation S-X for interim financial statements required to be filed with the Securities and Exchange Commission, and do not include all information and footnotes required by the accounting principles generally accepted in the United States (“U.S. GAAP”) for complete financial statements. These unaudited condensed consolidated financial statements should be read in conjunction with the consolidated financial statements and notes thereto included in our Annual Report on Form 10-K for the year ended December 31, 2025. Our fiscal year end is December 31, our third quarter represents the three-month period ended September 30, and our first nine months represents the nine-month period ended September 30. The results of operations for the third quarter and first nine months of 2026 are not necessarily indicative of the results to be expected for the entire year. Unless otherwise noted, all currency amounts are stated in U.S. dollars.
In the opinion of management, the accompanying unaudited condensed consolidated financial statements reflect all adjustments necessary to present fairly our financial position as of September 30, 2026, our results of operations for the third quarter and first nine months of 2026 and 2025, and our cash flows for the first nine months of 2026 and 2025. All adjustments are of a normal recurring nature. Our balance sheet at December 31, 2025 is derived from the audited consolidated financial statements at that date.
The preparation of financial statements in conformity with U.S. GAAP requires management to make estimates and assumptions that affect the reported amounts of assets and liabilities, the disclosure of contingent assets and liabilities at the date of the financial statements, and the reported amounts of revenues and expenses during the reporting period. Actual results could differ from those estimates. For further information, see Note 1 in our Annual Report on Form 10-K for the year ended December 31, 2025.
New Accounting Pronouncements
Standards Not Yet Adopted
Disaggregation of Income Statement Expenses. In November 2024, the FASB issued new guidance which requires entities to disclose additional information about specific expense categories, such as purchases of inventory, employee compensation, depreciation, and intangible asset amortization. This guidance will be effective for us for years beginning after December 15, 2026, and interim periods beginning after December 15, 2027, with early adoption permitted on either a prospective or retrospective basis. We are currently evaluating the impact of the new guidance on our consolidated financial statements and related disclosures.
7
Note 2 – Business Combinations and Discontinued Operations
Acquisition of Grassform Plant Hire Limited
On November 24, 2025, we completed the acquisition of Grassform Plant Hire Limited (“Grassform”), a U.K. market leader in ground protection and temporary roadway solutions and services.
The purchase price for this acquisition is $49.0 million, as reduced by $1.2 million during the first nine months of 2026, or $44.8 million net of cash acquired, with $42.1 million funded at closing in 2025. The acquisition is subject to customary post-closing adjustments pursuant to completion accounts and certain other adjustment mechanisms. Additional consideration, currently estimated to be $2.7 million, will be payable in 2026 based upon Grassform’s trailing twelve-month performance through February 28, 2026.
The Grassform acquisition has been recorded using the acquisition method of accounting and accordingly, preliminary amounts recognized for the assets acquired and liabilities assumed were recorded at their estimated fair values as of the acquisition date. The acquisition resulted in the recognition of $12.5 million in other intangible assets, consisting of customer relationships and tradename. The customer relationships and tradename are finite-lived intangible assets that will be amortized over periods of 15 years and 10 years, respectively. The excess of the total consideration over the fair value of the net assets acquired, $28.4 million, was recorded as goodwill, which is not deductible for U.S. tax purposes. The fair values of the identifiable assets acquired and liabilities assumed were based on our estimates and assumptions using various market, income, and cost valuation approaches, which are classified within level 3 of the fair value hierarchy.
Depreciation and amortization for the third quarter and first nine months of 2026 includes $1.6 million and $4.6 million, respectively, related to the acquired Grassform business.
The results of operations of Grassform are reported within the condensed consolidated statements of operations for the period subsequent to the date of the acquisition.
Sale of Fluids Systems Business
We previously operated a Fluids Systems business, which was historically reported as a separate operating segment, that provided drilling and completion fluids products and related technical services to customers for oil, natural gas, and geothermal projects. In September 2024, we completed the sale of substantially all of the Company’s Fluids Systems segment (the “Sale Transaction”) to SCF Partners.
In the first quarter of 2026, we collected $5.0 million, plus applicable accrued interest, on a note receivable due from the Purchaser, as well as $0.5 million for certain pre-closing tax assets. In the third quarter of 2026, we paid $0.6 million to the Purchaser for certain pre-closing obligations attributable to the Fluids Systems business. As of September 30, 2026, approximately $0.7 million of net liabilities were included within the consolidated balance sheet, reflecting an estimated $1.5 million due to the Purchaser partially offset by $0.8 million due from the Purchaser.
Estimated liabilities due to the Purchaser represents an estimated liability for contractual indemnifications related to various pre-closing contingencies of the Fluids Systems business. These estimated liabilities due to the Purchaser are included in other noncurrent liabilities in the condensed consolidated balance sheet. Estimated deferred consideration due from the Purchaser reflects the recovery of certain pre-closing assets, and are included in other receivables in the condensed consolidated balance sheet.
Our estimates for the fair value of liabilities due to the Purchaser and deferred consideration due from the Purchaser may change and any income or expense associated with such changes will be presented in discontinued operations. In the first nine months of 2026, we recognized a $0.5 million pre-tax gain on sale related to the resolution of certain contractual indemnifications related to the Sale Transaction. In addition, as part of the Sale Transaction, we retained the obligation to complete the closure of certain foreign subsidiaries that are no longer operational. We expect to continue to incur certain costs for these efforts until all such entities are closed.
8
Note 3 – Earnings Per Share
The following table presents the reconciliation of the numerator and denominator for calculating net income (loss) per share:
Third Quarter
First Nine Months
(In thousands, except per share data)
2026
2025
2026
2025
Numerator
Income from continuing operations
$
6,330
$
6,063
$
28,677
$
25,222
Loss from discontinued operations
(221)
(409)
(143)
(887)
Net income
$
6,109
$
5,654
$
28,534
$
24,335
Denominator
Weighted average common shares outstanding - basic
84,420
84,359
84,454
84,959
Dilutive effect of restricted stock awards and stock options
952
707
1,234
862
Weighted average common shares outstanding - diluted
85,372
85,066
85,688
85,821
Income (loss) per common share - basic:
Income from continuing operations
$
0.07
$
0.07
$
0.34
$
0.30
Loss from discontinued operations
—
—
—
(0.01)
Net income
$
0.07
$
0.07
$
0.34
$
0.29
Income (loss) per common share - diluted:
Income from continuing operations
$
0.07
$
0.07
$
0.33
$
0.29
Loss from discontinued operations
—
—
—
(0.01)
Net income
$
0.07
$
0.07
$
0.33
$
0.28
We excluded the following weighted-average potential shares from the calculations of diluted net income (loss) per share during the applicable periods because their inclusion would have been anti-dilutive for continuing operations:
Third Quarter
First Nine Months
(In thousands)
2026
2025
2026
2025
Restricted stock awards and stock options
262
—
96
343
Note 4 – Repurchase Program
Our Board of Directors has authorized a securities repurchase program available for repurchases of our common stock.
Our repurchase program authorizes us to purchase outstanding shares of our common stock in the open market or as otherwise determined by management, subject to certain limitations under the Credit Facility (as defined in Note 8) and other factors. The repurchase program has no specific term. Repurchases are expected to be funded from operating cash flows, available cash on hand, and borrowings under our Credit Facility. As part of the share repurchase program, our management has been authorized to establish trading plans under Rule 10b5-1 of the Securities Exchange Act of 1934.
During the first nine months of 2026, we repurchased an aggregate of 1.2 million shares of our common stock under the repurchase program for a cost of $16.1 million. During the first nine months of 2025, we repurchased an aggregate of 3.0 million shares of our common stock under the repurchase program for a cost of $20.4 million.
As of September 30, 2026, we had $75.6 million remaining under the program.
Note 5 – Stock-Based and Other Long-Term Incentive Compensation
During the first nine months of 2026, the Compensation Committee of our Board of Directors (“Compensation Committee”) approved equity-based compensation awards to executive officers and other key employees consisting of an aggregate of 0.2 million restricted stock units, which will vest in equal installments over a three-year period. In addition, non-employee directors received grants of an aggregate of 0.1 million restricted stock awards, which will vest in full on the earlier of the day prior to the next annual meeting of stockholders following the grant date or the first anniversary of the grant date.
9
The weighted average grant-date fair value was $15.04 per share for the restricted stock units and $15.24 per share for the restricted stock awards. At September 30, 2026, 3.0 million shares remained available for award under the 2015 Plan and 0.2 million shares remained available for awards under the 2014 Director Plan.
Also, during the second quarter of 2026, the Compensation Committee approved the issuance of 0.2 million performance-based restricted stock units (at target level) to certain executive officers with the payout of shares for each executive ranging from 0% to 200% of target. The performance-based restricted stock units will be settled in shares of common stock, with 70% to be settled based on the relative ranking of the Company’s total shareholder return (“TSR”) as compared to the TSR of a designated peer group and 30% to be settled based on the Company’s consolidated return on net capital employed (“RONCE”), each measured over a three-year performance period. TSR performance for the 2026 grants will be determined based on the Company’s and peer group’s average closing share price for the 30-calendar day period ending May 31, 2029, adjusted for dividends, as compared to the 30-calendar day period ending June 1, 2026. RONCE performance for the 2026 grants will be determined based on the Company’s average three-year RONCE performance for the fiscal years ending December 31, 2026, 2027 and 2028.
The TSR portion of the performance-based restricted stock units had a grant-date fair value of $21.07 per share using a Monte-Carlo valuation model, which will be recognized ratably over the service period. Assumptions used in the model included a risk-free interest rate of 3.9%, an expected life of 3 years, and an expected volatility of 37.5%. The RONCE portion of the performance-based restricted stock units had a grant-date fair value of $15.29 per share, which will be recognized ratably over the service period using the probable number of shares expected to vest based on the RONCE performance condition.
In addition, in May 2026, the Compensation Committee modified the retirement eligibility terms applicable to our outstanding long-term incentive awards, including unvested grants from 2024 and 2025. Selling, general and administrative expenses (“SG&A”) for the first nine months of 2026 includes a $0.9 million charge reflecting the acceleration of compensation expense for such awards for retirement eligible executive officers and other employees.
Note 6 – Receivables
Receivables consisted of the following:
(In thousands)
September 30, 2026
December 31, 2025
Trade receivables:
Gross trade receivables
$
62,052
$
53,146
Allowance for credit losses
(543)
(330)
Net trade receivables
61,509
52,816
Income tax receivables
1,000
1,651
Other receivables
3,226
5,339
Total receivables, net
$
65,735
$
59,806
Other receivables as of September 30, 2026 and December 31, 2025 included $0.8 million and $1.3 million, respectively, for amounts due from the Purchaser, including the receivables and estimated deferred consideration related to the Sale Transaction (see Note 2).
Changes in our allowance for credit losses were as follows:
First Nine Months
(In thousands)
2026
2025
Balance at beginning of period
$
330
$
948
Credit loss expense
95
19
Write-offs, net of recoveries
118
(618)
Balance at end of period
$
543
$
349
10
Note 7 – Inventories
Inventories consisted of the following:
(In thousands)
September 30, 2026
December 31, 2025
Raw materials
$
4,202
$
5,337
Finished goods
12,215
6,163
Total inventories
$
16,417
$
11,500
Raw materials consist primarily of resins and other materials used to manufacture composite mats, as well as materials that are consumed in providing spill containment and other services to our customers. Finished goods consist primarily of newly manufactured composite mats, which are available for deployment into our rental fleet or sale to customers.
Note 8 – Financing Arrangements and Fair Value of Financial Instruments
Financing arrangements consisted of the following:
September 30, 2026
December 31, 2025
(In thousands)
Principal Amount
Unamortized Discount and Debt Issuance Costs
Total Debt
Principal Amount
Unamortized Discount and Debt Issuance Costs
Total Debt
Credit Facility
$
15,900
$
—
$
15,900
$
5,300
$
—
$
5,300
Finance leases
10,396
—
10,396
11,562
—
11,562
Total debt
26,296
—
26,296
16,862
—
16,862
Less: current portion
(5,067)
—
(5,067)
(5,170)
—
(5,170)
Long-term debt
$
21,229
$
—
$
21,229
$
11,692
$
—
$
11,692
Credit Facility. In June 2025, we entered into a U.S. senior secured revolving credit agreement (the “Credit Facility”) with a group of lenders that provides financing of up to $150 million available for borrowings (inclusive of letters of credit), which can be increased up to $250 million, subject to certain conditions. The Credit Facility and the loans made under the Credit Facility are secured by a first priority lien on substantially all of the personal property of the Company and its significant U.S. subsidiaries as guarantors (subject to customary exceptions and exclusions). The Credit Facility will mature in June 2030.
As of September 30, 2026, we had $15.9 million outstanding borrowings and $1.9 million in outstanding letters of credit, resulting in $132.2 million of remaining availability under the Credit Facility.
Under the terms of the Credit Facility, we may elect to borrow at a variable interest rate based on either the Term SOFR rate or an alternate base rate plus, in each case, a per annum applicable margin. The applicable margin will range from 1.75% to 2.25% for Term SOFR loans and 0.75% to 1.25% for alternate base rate loans, based on the consolidated leverage ratio (as defined in the Credit Facility) as of the last day of the most recent fiscal quarter. We are also required to pay a commitment fee on the unused portion of the Credit Facility ranging from 0.25% to 0.35% per annum based on the consolidated leverage ratio.
As of September 30, 2026, the applicable margin for loans under the Credit Facility was 1.75% for Term SOFR loans and 0.75% for alternate base rate loans, and the applicable commitment fee was 0.25% per annum. As of September 30, 2026, the weighted average interest rate for the Credit Facility was 6.5%.
The Credit Facility requires compliance with a maximum consolidated leverage ratio and a minimum consolidated fixed charge coverage ratio, each as defined in the Credit Facility. In addition, at our option, we may choose to increase the maximum consolidated leverage ratio for a certain period following a significant acquisition, subject to certain limitations, as defined in the Credit Facility. As of September 30, 2026, we were in compliance with required ratios.
The Credit Facility contains various customary representations, warranties and covenants that, among other things and subject to certain specified circumstances and exceptions, restrict or limit the ability of the Company and its subsidiaries to incur indebtedness (including guarantees), grant liens, make investments, pay dividends or distributions with respect to capital stock or make other restricted payments, make prepayments on other indebtedness, engage in mergers or other fundamental changes, dispose of property, or change the nature of their business.
The Credit Facility includes various events of default (subject to certain materiality thresholds and/or grace periods), including non-payment of principal, interest or fees, violation of covenants, inaccuracy of representations or warranties, cross-
11
default to other material indebtedness, bankruptcy and insolvency events, invalidity or impairment of guarantees or security interests or invalidity of loan documents, certain ERISA events, unsatisfied or unstayed judgments and change of control.
Other Financing Arrangements. We maintain finance leases primarily related to transportation equipment. During the first nine months of 2026, we entered into $2.9 million of new finance lease liabilities in exchange for leased assets.
In addition, at September 30, 2026, we had $3.7 million in outstanding letters of credit (inclusive of the amount outstanding under the Credit Facility as described above), performance bonds, and other guarantees.
Fair Value of Financial Instruments. Our financial instruments include cash and cash equivalents, receivables, payables, and debt. We believe the carrying values of these instruments approximated their fair values at September 30, 2026 and December 31, 2025. Cash equivalents primarily consist of money market accounts which are measured at fair value on a recurring basis using a market approach based on quoted prices in active markets.
Note 9 – Commitments and Contingencies
In the ordinary course of conducting our business, we become involved in litigation and other claims from private party actions, as well as judicial and administrative proceedings involving governmental authorities at the federal, state, and local levels. In addition, in connection with the Sale Transaction, we have indemnified the Purchaser for certain pre-closing contingencies of the Fluids Systems business. While the outcome of litigation or other proceedings against us, including pre-closing contingencies of the Fluids Systems business, cannot be predicted with certainty, management does not expect that any loss resulting from such litigation or other proceedings, in excess of any amounts accrued or covered by insurance, will have a material adverse impact on our consolidated financial statements.
Note 10 – Supplemental Disclosures to the Statements of Cash Flows
Supplemental disclosures to the statements of cash flows are presented below:
First Nine Months
(In thousands)
2026
2025
Cash paid (received) for interest
$
1,083
$
(477)
First Nine Months
(In thousands)
2026
Cash paid (received) for income taxes (net of refunds):
U.S. Federal
$
130
U.S. State (1)
235
Foreign (2)
(227)
Total
$
138
(1) Includes a $0.3 million payment in Texas, $0.1 million payment in New Jersey, $0.1 million payment in Wisconsin, and $0.1 million refund in Florida, among other insignificant amounts.
(2) Includes a $0.2 million refund in Brazil.
Cash received for income tax refunds was $0.2 million for the first nine months of 2025.
Cash, cash equivalents, and restricted cash in the consolidated statements of cash flows consisted of the following:
(In thousands)
September 30, 2026
December 31, 2025
Cash and cash equivalents
$
4,230
$
5,140
Restricted cash (included in prepaid expenses and other current assets)
—
—
Cash, cash equivalents, and restricted cash
$
4,230
$
5,140
12
Note 11 – Segment Data
We have one reportable segment. The Company’s chief operating decision maker (“CODM”), its Chief Executive Officer, allocates resources and assesses financial performance on a consolidated basis. The Company’s operations, currently in the United States and United Kingdom, are substantially similar with respect to services provided, type of customers, and sourcing of materials. Resource allocations are based on the capacity of the Company’s existing rental fleet, manufacturing facility and current status of operations, including projected demand for our products and services in the industries and locations we serve. Consolidated income from continuing operations as presented in the consolidated statements of operations is used to measure performance. As such, management has determined that the Company functions as a single operating segment, and reports as a single reportable segment.
The following table presents further disaggregated revenues by type:
Third Quarter
First Nine Months
(In thousands)
2026
2025
2026
2025
Rental revenues
$
31,840
$
29,591
$
104,673
$
89,355
Service revenues
17,724
14,688
50,396
44,629
Product sales revenues
26,712
24,559
77,862
67,864
Total revenues
$
76,276
$
68,838
$
232,931
$
201,848
Service revenues in the table above include certain services performed that are directly related to mat rental operations. Such services include freight (hauling of rental mats), rental mat installation and removal, and direct labor related to such activities, and totaled approximately $49 million and $37 million for the first nine months of 2026 and 2025, respectively.
The following table presents further disaggregated revenues by geography, based on the country in which the sale originates:
Third Quarter
First Nine Months
(In thousands)
2026
2025
2026
2025
United States
$
66,993
$
65,407
$
204,399
$
189,402
United Kingdom
9,283
3,431
28,532
12,446
Total revenues
$
76,276
$
68,838
$
232,931
$
201,848
The following table presents disaggregated expense information:
Third Quarter
First Nine Months
(In thousands)
2026
2025
2026
2025
Depreciation and amortization - Included in cost of revenues
$
8,427
$
5,811
$
23,991
$
16,833
Depreciation and amortization - Included in selling, general and administrative expenses
432
450
1,413
1,402
Total depreciation and amortization
$
8,859
$
6,261
$
25,404
$
18,235
13
ITEM 2. Management’s Discussion and Analysis of Financial Condition and Results of Operations
The following discussion of our financial condition, results of operations, liquidity, and capital resources should be read in conjunction with the unaudited condensed consolidated financial statements and notes thereto included in this report as well as our Annual Report on Form 10-K for the year ended December 31, 2025. Our third quarter represents the three-month period ended September 30 and our first nine months represents the nine-month period ended September 30. Unless otherwise noted, all currency amounts are stated in U.S. dollars. The reference to a “Note” herein refers to the accompanying Notes to Unaudited Condensed Consolidated Financial Statements contained in Item 1 “Financial Statements.”
Overview
NPK International Inc. (“NPK,” the “Company,” “we,” “our,” or “us”) is a worksite access solutions company that manufactures, sells, and rents recyclable composite matting products, along with a full suite of services, including planning, logistics, and site restoration. For the first nine months of 2026, 67% of our revenues were generated from the rental of our recyclable composite matting systems, along with related site construction and services to customers in various markets including power transmission, oil and natural gas exploration and production, pipeline, renewable energy, petrochemical, construction and other industries within the United States and United Kingdom. The remaining 33% of our first nine months of 2026 revenues were generated from the sale of our manufactured recyclable composite mats to customers around the world, with power transmission being the primary end-market.
2026 Priorities
Our long-term strategy includes key foundational elements that are intended to enhance long-term shareholder value creation:
•Accelerate Organic Growth – We seek to accelerate revenue growth primarily through the expansion of our rental business, which includes a combination of geographic expansion to new growth territories, primarily within the U.S., while also expanding customer market share within currently-served markets. As part of this effort, we have placed a particular emphasis on penetrating larger-scale, longer-term (six months or longer) projects, which we believe will help drive improvements in revenue stability and operational efficiency.
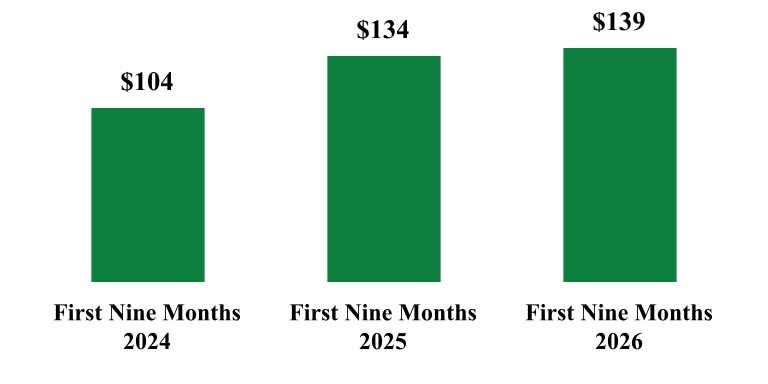
Due in part to the success of these efforts, our rental and service revenues have meaningfully increased in recent years. The following reflects our total rental and service revenues for the first nine months from 2024 to 2026, excluding the impact of the Grassform acquisition (in millions):
As illustrated above, organic growth efforts resulted in a year-over-year increase of rental and service revenues of $30 million (29%) for the first nine months of 2025 and $5 million (4%) for the first nine months of 2026. In the first nine months of 2025, the majority of the growth was driven by our success penetrating larger-scale, longer-term utility transmission projects within Texas, which contributed to exceptionally high rental fleet utilization levels. We also supplemented our rental fleet with cross-rented mats from third parties, in order to meet customer demand. During the first nine months of 2026, the revenue growth rate declined relative to the prior year, reflecting a reduction in rental volume following the completion of multiple large-scale projects completed in the second quarter, along with the impact of exceptionally dry weather in Texas, which negatively impacted matting demand during the third quarter of 2026. Following the impacts of these items, rental volume and fleet utilization have meaningfully improved in the early fourth quarter of 2026, relative to the third quarter of 2026.
To support our organic growth objective, we prioritize investments to expand our rental mat fleet, where over the past several years, we have seen the strong market adoption. During the first nine months of 2026, we made net investments of $27.0 million in the expansion of our rental fleet, expanding the rental fleet by approximately 10%. Further, with our revenue growth and the favorable macro-environment, in March 2026, our Board of Directors approved management’s plan to expand our composite mat production capacity by approximately 50% over current
14
levels. We expect to invest $40 million to $45 million through the second quarter of 2027 to complete this expansion, of which $10.5 million was invested in the first nine months of 2026, with production expected to start up by mid-2027.
•Pursue Inorganic Growth – We seek to accelerate our growth and enhance shareholder value through strategically-aligned inorganic actions, leveraging our scale to increase our value and relevance to customers, and we continually evaluate inorganic opportunities that align with our objectives. In November 2025, we completed the acquisition of Grassform Plant Hire Limited (“Grassform”), a U.K. market leader in ground protection and temporary roadway solutions and services with a fleet of over 20,000 composite mats. Our U.K. operations generated $28.5 million of revenues during the first nine months of 2026, a $16.1 million increase over the first nine months of 2025, with the substantial majority of the increase driven by the Grassform acquisition.
•Drive Operational Efficiency – We are focused on efficiency improvements and operating cost optimization across every aspect of our business. Throughout 2025 and 2026, we continued to evaluate and execute actions intended to streamline the organization and our cost structure, driving improvements in profitability. SG&A as a percentage of revenues was 18.1% for the first nine months of 2026 compared to 19.2% for the first nine months of 2025. SG&A for the first nine months of 2026 includes approximately $1.2 million in severance and related costs associated with the third quarter 2026 executive leadership transition, a $0.9 million charge reflecting the acceleration of compensation expense for awards for retirement eligible executive officers and other employees, as well as $0.8 million in strategic planning, diligence, and acquisition-related costs.
•Enhance Return on Capital – We are committed to maintaining a strong balance sheet, prioritizing organic investment to expand our rental business while evaluating accretive inorganic growth opportunities to accelerate growth and returning excess cash generation via programmatic share repurchases. During the first nine months of 2026, we utilized $16.1 million to repurchase 1.2 million shares under our share repurchase program.
15
Third Quarter of 2026 Compared to Third Quarter of 2025
Consolidated Results of Operations
Summarized results of operations for the third quarter of 2026 compared to the third quarter of 2025 are as follows:
Third Quarter
2026 vs 2025
(In thousands)
2026
2025
$
%
Revenues
$
76,276
$
68,838
$
7,438
11
%
Cost of revenues
52,371
46,870
5,501
12
%
Selling, general and administrative expenses
14,738
13,279
1,459
11
%
Other operating (income) loss, net
8
(368)
376
NM
Operating income from continuing operations
9,159
9,057
102
1
%
Foreign currency exchange (gain) loss
101
31
70
NM
Interest (income) expense, net
460
(47)
507
NM
Income from continuing operations before income taxes
8,598
9,073
(475)
(5)
%
Provision for income taxes from continuing operations
2,268
3,010
(742)
(25)
%
Income from continuing operations
6,330
6,063
267
4
%
Loss from discontinued operations, net of tax
(221)
(409)
188
46
%
Net income
$
6,109
$
5,654
$
455
8
%
The following table presents further disaggregated revenues by type:
Third Quarter
2026 vs 2025
(In thousands)
2026
2025
$
%
Revenues
Rental and service revenues
$
49,564
$
44,279
$
5,285
12
%
Product sales revenues
26,712
24,559
2,153
9
%
Total revenues
$
76,276
$
68,838
$
7,438
11
%
Third Quarter
Change
2026
2025
Total gross profit margin
31.3
%
31.9
%
(60)
bps
Revenues
Revenues increased 11% to $76.3 million for the third quarter of 2026, compared to $68.8 million for the third quarter of 2025, including a 12% increase in rental and service revenues and a 9% increase in product sales revenues. Rental revenues increased $2.2 million (8%), including the contribution from the Grassform acquisition ($3 million). Within the base business (excluding acquisition impact), rental volume declined ($3 million) due to the impact of exceptionally dry weather in Texas, which negatively impacted matting demand. This was partially offset by higher pricing ($2 million). Service revenues increased $3.0 million (21%), primarily attributable to the timing of rental project demobilization activities as well as the contribution from the Grassform acquisition ($1 million). Product sales revenues increased $2.2 million (9%), reflecting continued strength in customer adoption of manufactured composite matting products relative to timber-based products that represent the primary solution used for worksite access in the market.
Cost of revenues
Cost of revenues increased 12% to $52.4 million for the third quarter of 2026 (31.3% gross profit margin), compared to $46.9 million for the third quarter of 2025 (31.9% gross profit margin), primarily driven by the 11% increase in revenues described above. Gross profit for rental and service activities remained in line with prior year, reflecting the higher revenues
16
largely offset by increased costs associated with the expanding rental fleet and the impact of the Grassform acquisition. Gross profit for product sales increased $2 million, reflecting higher sales volume along with manufacturing cost leverage.
Selling, general and administrative expenses
Selling, general and administrative expenses increased to $14.7 million for the third quarter of 2026, which includes $0.7 million attributable to the Grassform acquisition, compared to $13.3 million for the third quarter of 2025. Selling, general and administrative expenses as a percentage of revenues was 19.3% for the third quarter of 2026 and the third quarter of 2025. SG&A for the third quarter of 2026 includes approximately $1.2 million in severance and related costs associated with the third quarter executive leadership transition as well as $0.7 million in strategic planning, diligence, and acquisition-related costs. The third quarter of 2025 included $0.5 million in elevated costs related to performance-based incentives, along with $0.5 million in costs associated with strategic planning projects and our ERP implementation.
Other operating (income) loss, net
Other operating (income) loss, net primarily includes gains and losses on sales of non-rental assets.
Foreign currency exchange
Foreign currency exchange for the third quarter of 2026 and 2025 reflects the impact of currency translation on assets and liabilities (including intercompany balances) that are denominated in currencies other than functional currencies, principally related to our U.K. operations.
Interest (income) expense, net
Interest expense, net increased $0.5 million from the third quarter of 2025, reflecting the decrease in cash on-hand and the increase in average debt outstanding, primarily driven by the Grassform acquisition, elevated capital expenditures, including our manufacturing expansion, and share repurchases.
Provision for income taxes from continuing operations
The provision for income taxes from continuing operations was $2.3 million for the third quarter of 2026, reflecting an effective tax rate of 26%, compared to income taxes of $3.0 million for the third quarter of 2025, reflecting an effective tax rate of 33%.
Loss from discontinued operations, net of tax
Loss from discontinued operations, net of tax reflects ongoing wind down costs of the former Fluids Systems segment, which was sold in the third quarter of 2024, including costs related to the transaction and the closure of certain foreign subsidiaries that are no longer operational.
17
First Nine Months of 2026 Compared to First Nine Months of 2025
Consolidated Results of Operations
Summarized results of operations for the first nine months of 2026 compared to the first nine months of 2025 are as follows:
First Nine Months
2026 vs 2025
(In thousands)
2026
2025
$
%
Revenues
$
232,931
$
201,848
$
31,083
15
%
Cost of revenues
151,681
129,449
22,232
17
%
Selling, general and administrative expenses
42,089
38,682
3,407
9
%
Other operating (income) loss, net
(511)
(497)
(14)
3
%
Operating income from continuing operations
39,672
34,214
5,458
16
%
Foreign currency exchange (gain) loss
92
(909)
1,001
NM
Interest (income) expense, net
1,130
(94)
1,224
NM
Income from continuing operations before income taxes
38,450
35,217
3,233
9
%
Provision for income taxes from continuing operations
9,773
9,995
(222)
(2)
%
Income from continuing operations
28,677
25,222
3,455
14
%
Loss from discontinued operations
(143)
(887)
744
84
%
Net income
$
28,534
$
24,335
$
4,199
17
%
The following table presents further disaggregated revenues by type:
First Nine Months
2026 vs 2025
(In thousands)
2026
2025
$
%
Revenues
Rental and service revenues
$
155,069
$
133,984
$
21,085
16
%
Product sales revenues
77,862
67,864
9,998
15
%
Total revenues
$
232,931
$
201,848
$
31,083
15
%
First Nine Months
Change
2026
2025
Total gross profit margin
34.9
%
35.9
%
(100)
bps
Revenues
Revenues increased 15% to $232.9 million for the first nine months of 2026, compared to $201.8 million for the first nine months of 2025, including a 16% increase in rental and service revenues and a 15% increase in product sales revenues. Rental revenues increased $15.3 million (17%), including the contribution from the Grassform acquisition ($11 million). Within the base business (excluding acquisition impact), higher pricing ($6 million) was partially offset by lower rental volume ($2 million) following the completion of multiple large-scale projects completed in the second quarter of 2026, along with the impact of exceptionally dry weather in Texas, which negatively impacted matting demand during the third quarter of 2026. Service revenues increased $5.8 million (13%), primarily attributable to the contribution from the Grassform acquisition. Product sales revenues increased $10.0 million (15%), reflecting continued strength in customer adoption of manufactured composite matting products relative to timber-based products that represent the primary solution used for worksite access in the market. We sold approximately 32,000 mats during the first nine months of 2026, compared to approximately 30,000 mats during the first nine months of 2025, along with higher sales of ancillary products. During the first nine months of 2026, the majority of our product sales revenues were derived from utility companies.
18
Cost of revenues
Cost of revenues increased 17% to $151.7 million for the first nine months of 2026 (34.9% gross profit margin), compared to $129.4 million for the first nine months of 2025 (35.9% gross profit margin), primarily driven by the 15% increase in revenues described above. Gross profit for rental and service activities increased $1 million, reflecting the higher revenues largely offset by increased costs associated with the expanding rental fleet and the impact of the Grassform acquisition. Gross profit for product sales increased $8 million, reflecting higher sales volume along with manufacturing cost leverage.
Selling, general and administrative expenses
Selling, general and administrative expenses increased to $42.1 million for the first nine months of 2026, which includes $2.0 million attributable to the Grassform acquisition, compared to $38.7 million for the first nine months of 2025. Selling, general and administrative expenses as a percentage of revenues was 18.1% for the first nine months of 2026 compared to 19.2% for the first nine months of 2025. SG&A for the first nine months of 2026 includes approximately $1.2 million in severance and related costs associated with the executive leadership transition, a $0.9 million charge reflecting the acceleration of compensation expense for awards for retirement eligible executive officers and other employees, as well as $0.8 million in strategic planning, diligence, and acquisition-related costs. The first nine months of 2025 included $1.5 million in elevated costs related to performance-based incentives, $0.5 million in costs associated with strategic planning projects and our ERP implementation, and $0.4 million of severance costs.
Other operating (income) loss, net
Other operating (income) loss, net primarily includes gains and losses on sales of non-rental assets.
Foreign currency exchange
Foreign currency exchange for the first nine months of 2026 and 2025 reflects the impact of currency translation on assets and liabilities (including intercompany balances) that are denominated in currencies other than functional currencies, principally related to our U.K. operations.
Interest (income) expense, net
Interest expense, net increased by $1.2 million from the first nine months of 2025, primarily reflecting the decrease in cash on-hand and the increase in average debt outstanding, primarily driven by the Grassform acquisition, capital expenditures, including our manufacturing expansion, and share repurchases.
Provision for income taxes from continuing operations
The provision for income taxes from continuing operations was $9.8 million for the first nine months of 2026, reflecting an effective tax rate of 25%, compared to income taxes of $10.0 million for the first nine months of 2025, reflecting an effective tax rate of 28%.
Loss from discontinued operations, net of tax
Loss from discontinued operations, net of tax reflects net costs related to the former Fluids Systems segment, which was sold in the third quarter of 2024. In the first nine months of 2026, we recognized a $0.5 million pre-tax gain on sale related to the resolution of certain contractual indemnifications related to the Sale Transaction, which was offset by costs associated with the transaction as well as the closure of certain foreign subsidiaries that are no longer operational.
19
Liquidity and Capital Resources
Net cash provided by operating activities was $50.1 million for the first nine months of 2026 compared to $55.0 million for the first nine months of 2025. Net income adjusted for non-cash items provided cash of $66.4 million in the first nine months of 2026, compared to $54.3 million in 2025, while changes in working capital used cash of $16.2 million in the first nine months of 2026, compared to $0.7 million of cash provided in 2025. The 2026 increase in working capital is primarily attributable to the increase in receivables and inventories associated with the growth of the business, along with specific timing of customer transactions or the deployment of inventory into our rental fleet.
Net cash used in investing activities was $38.8 million for the first nine months of 2026, which includes $45.5 million in capital expenditures partially offset by $5.5 million in additional proceeds from the sale of the Fluids Systems business, $1.8 million in proceeds from sales of assets, and $0.6 million cash paid for other investing activities. Net cash used in investing activities was $13.0 million for the first nine months of 2025, which includes $34.4 million in capital expenditures partially offset by $14.5 million in additional proceeds from the sale of the Fluids Systems business, $3.8 million in proceeds from the sale of assets, and $3.1 million in proceeds from other investing activities. The substantial majority of our capital expenditures for the first nine months of 2026 and 2025 were directed to expanding our mat rental fleet, along with $10.5 million spent on the expansion of our Carencro, Louisiana manufacturing operations in 2026.
Net cash used in financing activities was $12.2 million for the first nine months of 2026, which primarily reflects $19.3 million in purchases of treasury stock, which were primarily funded through $10.6 million of net borrowings on our Credit Facility. Net cash used in financing activities was $24.6 million for the first nine months of 2025, primarily reflecting $22.7 million in purchases of treasury stock.
We primarily manage our liquidity utilizing cash on hand and availability under our Credit Facility and other existing financing arrangements.
We expect future working capital requirements for our operations will generally fluctuate directionally with revenues, and we expect net capital expenditures in 2026 to be $70 million to $75 million, which includes $40 million to $45 million invested to expand our rental fleet and approximately $20 million for the manufacturing expansion. We also expect to use a portion of our existing liquidity to pursue inorganic growth opportunities and return value to our shareholders through share repurchases. We expect cash on hand and cash generated by operations, as well as the projected availability under our Credit Facility and other existing financing arrangements, to be adequate to fund our current operations during the next 12 months.
Our capitalization is as follows:
(In thousands)
September 30, 2026
December 31, 2025
Credit Facility
$
15,900
$
5,300
Other debt
10,396
11,562
Unamortized discount and debt issuance costs
—
—
Total debt
$
26,296
$
16,862
Stockholders’ equity
366,090
351,156
Total capitalization
$
392,386
$
368,018
Total debt to capitalization
6.7
%
4.6
%
Credit Facility. In June 2025, we entered into a U.S. senior secured revolving credit agreement (the “Credit Facility”) with a group of lenders that provides financing of up to $150 million available for borrowings (inclusive of letters of credit), which can be increased up to $250 million, subject to certain conditions. The Credit Facility and the loans made under the Credit Facility are secured by a first priority lien on substantially all of the personal property of the Company and its significant U.S. subsidiaries as guarantors (subject to customary exceptions and exclusions). The Credit Facility will mature in June 2030.
As of September 30, 2026, we had $15.9 million outstanding borrowings and $1.9 million in outstanding letters of credit, resulting in $132.2 million of remaining availability under the Credit Facility.
Under the terms of the Credit Facility, we may elect to borrow at a variable interest rate based on either the Term SOFR rate or an alternate base rate plus, in each case, a per annum applicable margin. The applicable margin will range from 1.75% to 2.25% for Term SOFR loans and 0.75% to 1.25% for alternate base rate loans, based on the consolidated leverage ratio (as defined in the Credit Facility) as of the last day of the most recent fiscal quarter. We are also required to pay a commitment fee on the unused portion of the Credit Facility ranging from 0.25% to 0.35% per annum based on the consolidated leverage ratio.
20
As of September 30, 2026, the applicable margin for loans under the Credit Facility was 1.75% for Term SOFR loans and 0.75% for alternate base rate loans, and the applicable commitment fee was 0.25% per annum. As of September 30, 2026, the weighted average interest rate for the Credit Facility was 6.5%.
The Credit Facility requires compliance with a maximum consolidated leverage ratio and a minimum consolidated fixed charge coverage ratio, each as defined in the Credit Facility. In addition, at our option, we may choose to increase the maximum consolidated leverage ratio for a certain period following a significant acquisition, subject to certain limitations, as defined in the Credit Facility. As of September 30, 2026, we were in compliance with required ratios.
The Credit Facility contains various customary representations, warranties and covenants that, among other things and subject to certain specified circumstances and exceptions, restrict or limit the ability of the Company and its subsidiaries to incur indebtedness (including guarantees), grant liens, make investments, pay dividends or distributions with respect to capital stock or make other restricted payments, make prepayments on other indebtedness, engage in mergers or other fundamental changes, dispose of property, or change the nature of their business.
The Credit Facility includes various events of default (subject to certain materiality thresholds and/or grace periods), including non-payment of principal, interest or fees, violation of covenants, inaccuracy of representations or warranties, cross-default to other material indebtedness, bankruptcy and insolvency events, invalidity or impairment of guarantees or security interests or invalidity of loan documents, certain ERISA events, unsatisfied or unstayed judgments and change of control.
Other Financing Arrangements. We maintain finance leases primarily related to transportation equipment. During the first nine months of 2026, we entered into $2.9 million of new finance lease liabilities in exchange for leased assets.
In addition, at September 30, 2026, we had $3.7 million in outstanding letters of credit (inclusive of the amount outstanding under the Credit Facility as described above), performance bonds, and other guarantees.
Critical Accounting Estimates and Policies
Our consolidated financial statements are prepared in accordance with accounting principles generally accepted in the United States (“U.S. GAAP”), which requires management to make estimates and assumptions that affect the reported amounts and disclosures. Significant estimates used in preparing our consolidated financial statements include estimated cash flows and fair values used for impairments of long-lived assets, including goodwill and other intangibles, and valuation allowances for deferred tax assets. Our estimates are based on historical experience and on our future expectations that we believe to be reasonable. The combination of these factors forms the basis for making judgments about the carrying values of assets and liabilities that are not readily apparent from other sources. Actual results may differ from our current estimates and those differences may be material.
For additional discussion of our critical accounting estimates and policies, see “Management’s Discussion and Analysis of Financial Condition and Results of Operations” included in our Annual Report on Form 10-K for the year ended December 31, 2025. Our critical accounting estimates and policies have not materially changed since December 31, 2025.
21
ITEM 3. Quantitative and Qualitative Disclosures About Market Risk
We are exposed to market risk from changes in interest rates and changes in foreign currency exchange rates. A discussion of our primary market risk exposure in financial instruments is presented below.
Interest Rate Risk
We are primarily exposed to interest rate risk through our Credit Facility, which is subject to variable interest rates as determined by the debt agreement. As of September 30, 2026, we had $15.9 million outstanding under our Credit Facility and the weighted average interest rate was 6.5%. Based on the balance of variable rate debt at September 30, 2026, a 100 basis-point increase in short-term interest rates would have increased annual pre-tax interest expense by $0.2 million.
Foreign Currency Risk
Our principal foreign operations are currently conducted in the U.K., which contributed approximately 12.2% of our consolidated revenues for the first nine months of 2026. We have foreign currency exchange risks associated with these operations, which are conducted principally in British pounds. Historically, we have not used off-balance sheet financial hedging instruments to manage foreign currency risks when we enter into a transaction denominated in a currency other than our local currencies.
ITEM 4. Controls and Procedures
Evaluation of Disclosure Controls and Procedures
Our management, with the participation of our Chief Executive Officer and Chief Financial Officer, has evaluated the effectiveness of our disclosure controls and procedures (as defined in Rules 13a-15(e) and 15d-15(e) under the Securities Exchange Act of 1934 (the “Exchange Act”)) as of the end of the period covered by this quarterly report in accordance with Rules 13a-15 and 15d-15 under the Exchange Act. Based on such evaluation, our Chief Executive Officer and Chief Financial Officer concluded that our disclosure controls and procedures were effective as of September 30, 2026, the end of the period covered by this quarterly report.
Changes in Internal Control Over Financial Reporting
There were no changes in internal control over financial reporting during the quarter ended September 30, 2026 that materially affected, or are reasonably likely to materially affect, our internal control over financial reporting.
22
PART II OTHER INFORMATION
ITEM 1. Legal Proceedings
In the ordinary course of conducting our business, we become involved in litigation and other claims from private party actions, as well as judicial and administrative proceedings involving governmental authorities at the federal, state, and local levels. In addition, in connection with the Sale Transaction, we have indemnified the Purchaser for certain pre-closing contingencies of the Fluids Systems business. While the outcome of litigation or other proceedings against us, including pre-closing contingencies of the Fluids Systems business, cannot be predicted with certainty, management does not expect that any loss resulting from such litigation or other proceedings, in excess of any amounts accrued or covered by insurance, will have a material adverse impact on our consolidated financial statements.
ITEM 1A. Risk Factors
There have been no material changes during the period ended September 30, 2026 to our “Risk Factors” as discussed in Item 1A of our Annual Report on Form 10-K for the year ended December 31, 2025.
23
ITEM 2. Unregistered Sales of Equity Securities and Use of Proceeds
a)Not applicable
b)Not applicable
c)The following table details our repurchases of shares of our common stock for the three months ended September 30, 2026:
Period
Total Number of Shares Purchased
Average Price Paid Per Share
Total Number of Shares Purchased as Part of Publicly Announced Plans or Programs
Maximum Approximate Dollar Value of Shares that May Yet be Purchased Under Plans or Programs ($ in Millions)
July 2026
—
$
—
—
$
89.0
August 2026
715,698
$
13.56
715,698
$
79.3
September 2026
288,590
$
12.96
284,302
$
75.6
Total
1,004,288
1,000,000
Our Board of Directors has authorized a securities repurchase program available for repurchases of our common stock. In April 2025, our Board of Directors increased the remaining authorization under the repurchase program to $100 million.
Our repurchase program authorizes us to purchase outstanding shares of our common stock in the open market or as otherwise determined by management, subject to certain limitations under the Credit Facility (as defined in Note 8) and other factors. The repurchase program has no specific term. Repurchases are expected to be funded from operating cash flows, available cash on hand, and borrowings under our Credit Facility. As part of the share repurchase program, our management has been authorized to establish trading plans under Rule 10b5-1 of the Securities Exchange Act of 1934. All shares purchased are held as treasury stock.
There were 1.0 million shares of common stock repurchased under the repurchase program during the three months ended September 30, 2026. As of September 30, 2026, we had $75.6 million remaining under the program.
In addition, during the three months ended September 30, 2026, we purchased an aggregate of 4,288 shares surrendered in lieu of taxes under vesting of restricted shares. These shares were not acquired pursuant to our securities repurchase program described above. All of the shares purchased are held as treasury stock.
ITEM 3. Defaults Upon Senior Securities
None.
ITEM 4. Mine Safety Disclosures
Not applicable.
ITEM 5. Other Information
Insider Trading Arrangements
During the quarter ended September 30, 2026, no director or officer of the Company adopted or terminated any Rule 10b5-1 trading arrangement or non-Rule 10b5-1 trading arrangement, as each term is defined in Item 408(a) of Regulation S-K, except as follows:
On August 6, 2026, Lori Briggs, the Company’s former Executive Vice President, Business Operations, adopted a written trading arrangement for the sale of shares intended to satisfy the affirmative defense conditions of Rule 10b5-1(c). In connection with her departure from the Company, Ms. Briggs terminated the 10b5-1 trading arrangement on September 14, 2026. This trading arrangement was subject to a 90-day “cooling off” period before any trades could be conducted thereunder, would have expired on June 30, 2027 and provided for the sale of an undetermined number of shares of our common stock. No sales occurred under the plan.
24
ITEM 6. Exhibits
The exhibits listed are filed as part of, or incorporated by reference into, this Quarterly Report on Form 10-Q.
XBRL Instance Document - the instance document does not appear in the Interactive Data File because its XBRL tags are embedded within the Inline XBRL document
*101.SCH
Inline XBRL Schema Document
*101.CAL
Inline XBRL Calculation Linkbase Document
*101.DEF
Inline XBRL Definition Linkbase Document
*101.LAB
Inline XBRL Label Linkbase Document
*101.PRE
Inline XBRL Presentation Linkbase Document
*104
Cover Page Interactive Data File - the cover page XBRL tags are embedded within the Inline XBRL document.
* Filed herewith.
** Furnished herewith.
25
SIGNATURES
Pursuant to the requirements of the Securities Exchange Act of 1934, the registrant has duly caused this report to be signed on its behalf by the undersigned thereunto duly authorized.
Date: October 30, 2026
NPK International Inc.
(Registrant)
By:
/s/ Matthew S. Lanigan
Matthew S. Lanigan President and Chief Executive Officer (Principal Executive Officer)
By:
/s/ Gregg S. Piontek
Gregg S. Piontek Senior Vice President and Chief Financial Officer (Principal Financial Officer)
By:
/s/ Matthew J. Warren
Matthew J. Warren Vice President, Chief Accounting Officer (Principal Accounting Officer)